What does sub-divided bar diagram show ?
The correct Answer is:Sub-divided bar diagrams which simultaneously preset, total values as well as part values of a set of data.
Sub-divided bar diagrams which simultaneously preset, total values as well as part values of a set of data.
Similar Questions
The sub-divided bar diagram given below depicts the result of B.Com. Students of a college for 3 years. Study the graph and answer the given questions.
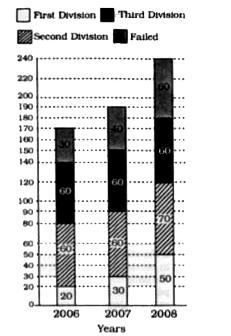
What was the pass percentage in 2008 ?
View SolutionThe sub-divided bar diagram given below depicts the result of B.Com. Students of a college for 3 years. Study the graph and answer the given questions.
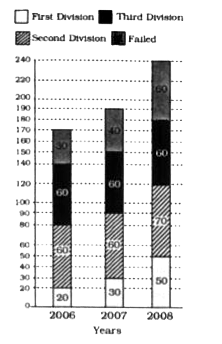
What was the number of third divisions in 2006 ?
View Solution
Knowledge Check
The production figures of a perfume manufacture are given in the form of percentage in sub-divided bar diagram. Study the diagram and answer the questions.
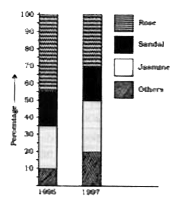
What is the percentage of sandal perfume during the year 1995 over that during 1997 ?A100%B1%C0%D50%The production figures of a perfume manufacture are given in the form of percenatge in sub-divided bar diagram. Study the diagram and answer the questions.
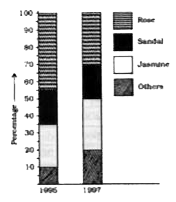
What is the ratio of percentage production of rose perfume during 1995 to that during the year 1997 ?A4:3B3:2C2:3D5:4
The sub-divided bar diagram given below depicts the result of B.Com. Students of a college for 3 years. Study the graph and answer the given questions.
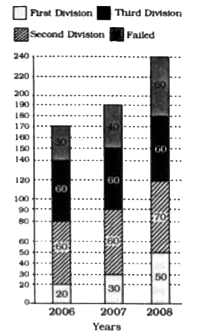
How many percent of students passed in first division in 2007?
View SolutionThe sub-divided bar diagram given below depicts the result of B.Com. Students of a college for 3 years. Study the graph and answer the given questions.
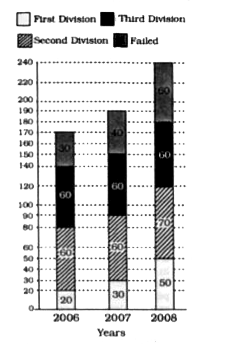
In which year, did the college have the best result for B.Com ?
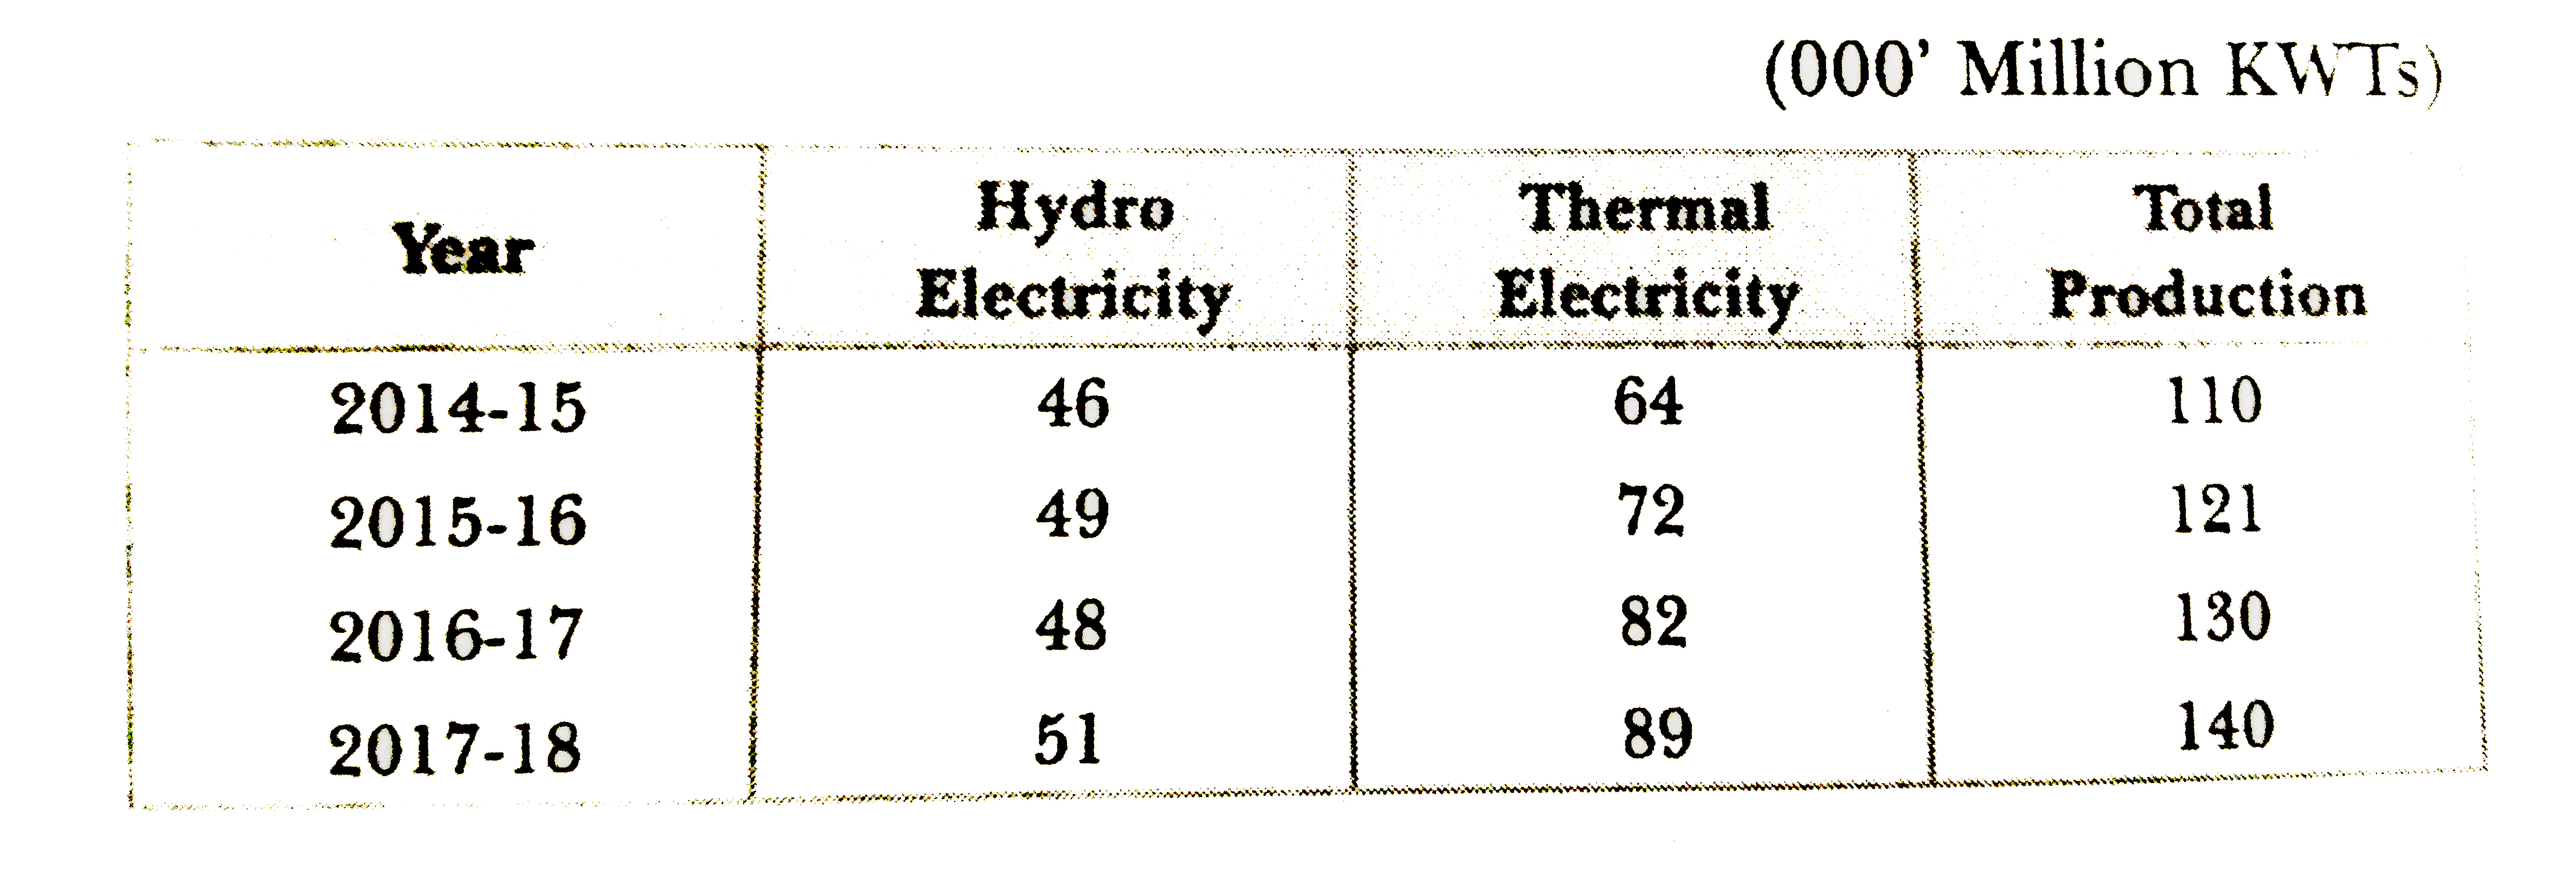
View SolutionThe following table shows Production of Electricity from different Sources in India during 2014-15 to 2017-18 (hypothetical data).
Present the data in a sub-divided bar diagram.
View SolutionThe sub divided bar diagram given below depicts H.S. Students of a school for three years. Study the diagram and answer the questions.
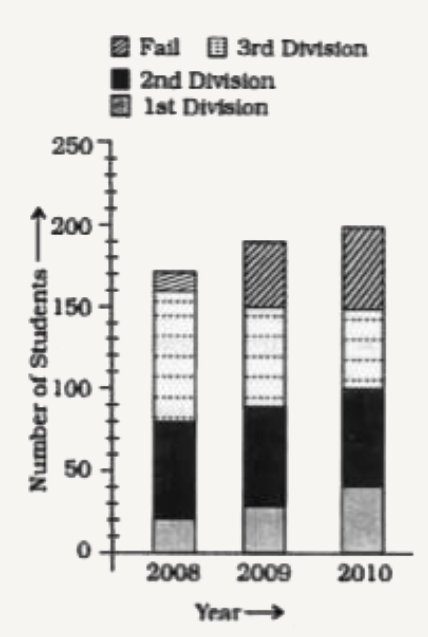
The percentage passed in 1st division in 2008 was
View SolutionThe sub divided bar diagram given below depicts H.S. Students of a school for three years. Study the diagram and answer the questions.
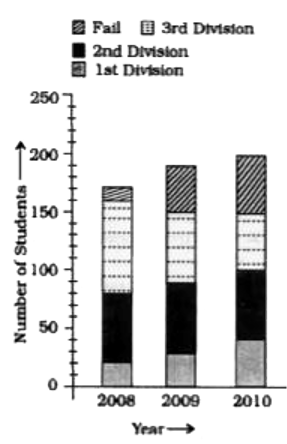
The percentage of the students passed with 2nd division in the year 2010 was
View SolutionThe sub divided bar diagram given below depicts the result of Class XII students of a school for three years. Study the diagram and answer the questions given below :
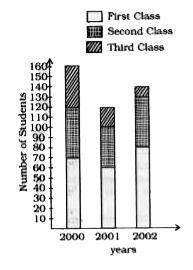
The percenatge of students passed with Second class in the year 2000 is
View Solution
