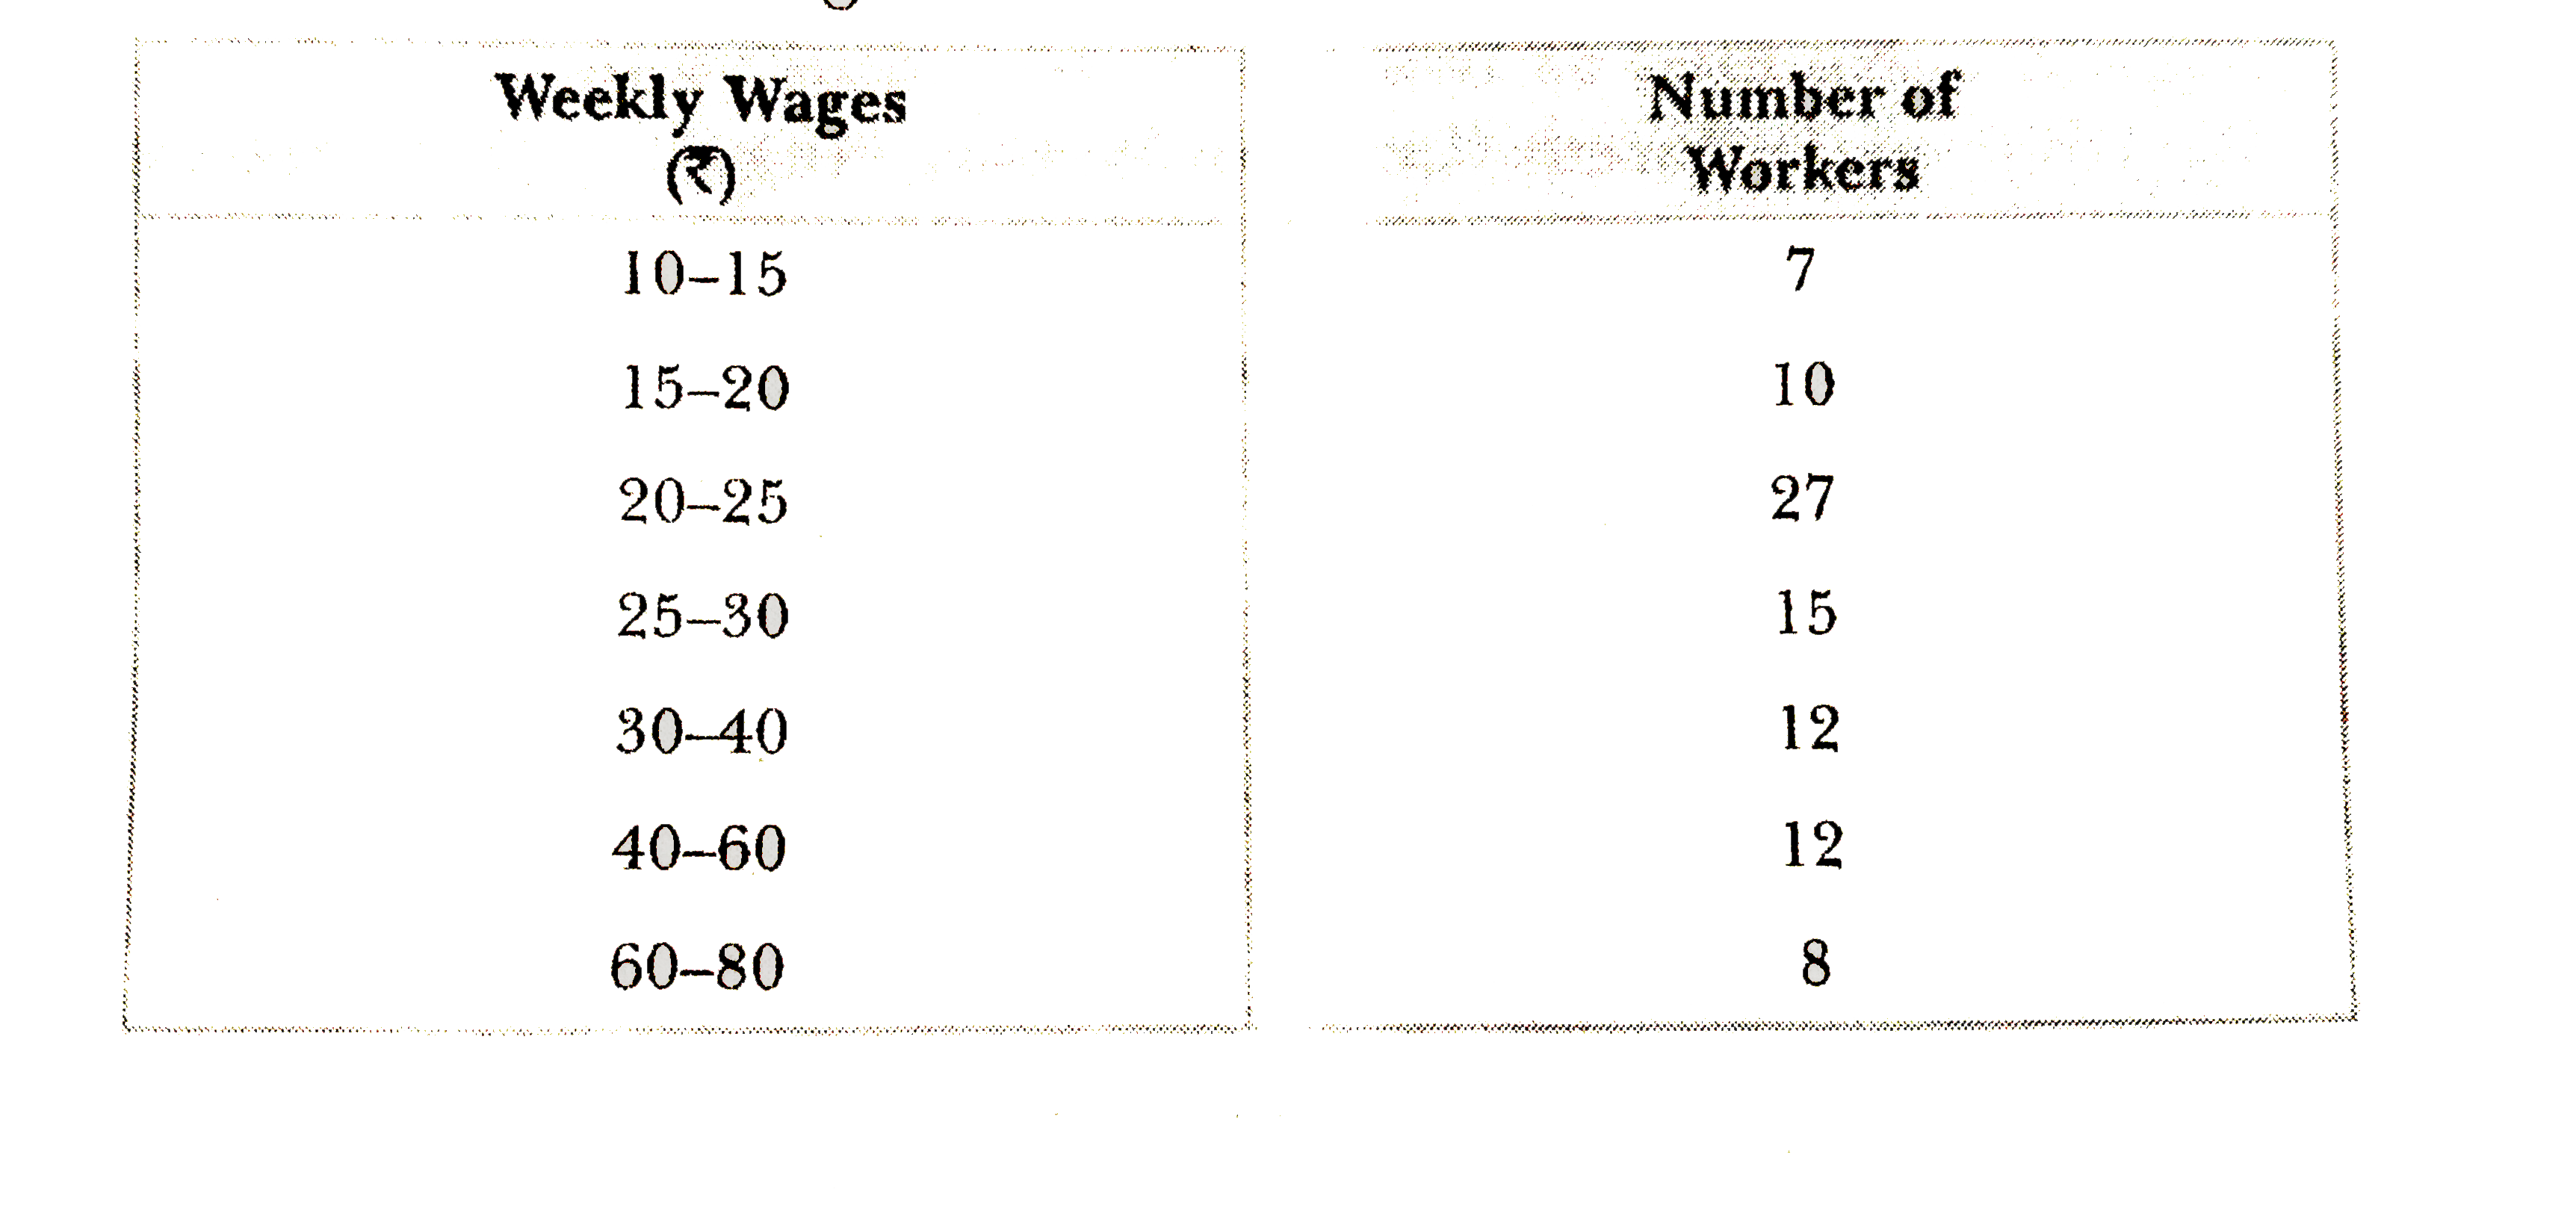
Following tables shows estimates of cost of production of certain commodities. Present the data in the form of sub divided bar diagram:

Step by step video & image solution for Following tables shows estimates of cost of production of certain commodities. Present the data in the form of sub divided bar diagram: by Economics experts to help you in doubts & scoring excellent marks in Class 11 exams.
Updated on:21/07/2023Topper's Solved these Questions
- DIAGRAMMATIC PRESENTATION OF DATA BAR DIAGRAMS AND PIE DIAGRAMSBook:TARUN JAIN & VK OHRIChapter:DIAGRAMMATIC PRESENTATION OF DATA BAR DIAGRAMS AND PIE DIAGRAMSExercise:NCERT Question (With Hints to Answers)
Explore 3 Videos
- DIAGRAMMATIC PRESENTATION OF DATA BAR DIAGRAMS AND PIE DIAGRAMSBook:TARUN JAIN & VK OHRIChapter:DIAGRAMMATIC PRESENTATION OF DATA BAR DIAGRAMS AND PIE DIAGRAMSExercise:Essential praticals
Explore 1 Video
- CORRELATIONBook:TARUN JAIN & VK OHRIChapter:CORRELATIONExercise:NCERT Questions (with Hints to Answers)
Explore 10 Videos
- FREQUENCY DIAGRAMS - HISTOGRAM, POLYGON AND OGIVEBook:TARUN JAIN & VK OHRIChapter:FREQUENCY DIAGRAMS - HISTOGRAM, POLYGON AND OGIVEExercise:EXERCISE NCERT
Explore 7 Videos
Similar Questions
Present the following data in the form of a multiple bar diagrm:

View SolutionWhat does sub-divided bar diagram show ?
View SolutionPresent the following data in the form of horizontal bar diagram :

View SolutionPresent the following data in the form of a histogram :

View SolutionPresent the following data in the form of a histogram :

View SolutionThe following table shows the monthly expenditure of different families on different items :

Represent the data in the form of a sub-divided bar diagram.
View SolutionPresent the following data on the production of food grains in the form of a sub divided bar diagrm:

View SolutionThe following table shows the interest of students of a school in different games :

Represent the data by using a simple bar diagram.
View SolutionFollowing data relate to the construction of a house in delhi .present the information in the form of a pie diagram:

View SolutionThe following table shows causes of noise pollution. Show it by a pie diagram.

View Solution
