Bar diagrams are those diagrams in which data are presented in the form of bars or rectangles. (True/False)
Text Solution
The correct Answer is:True
True
|
Similar Questions
Knowledge Check
18 Bar diagram is
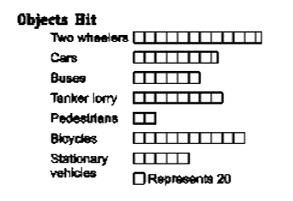
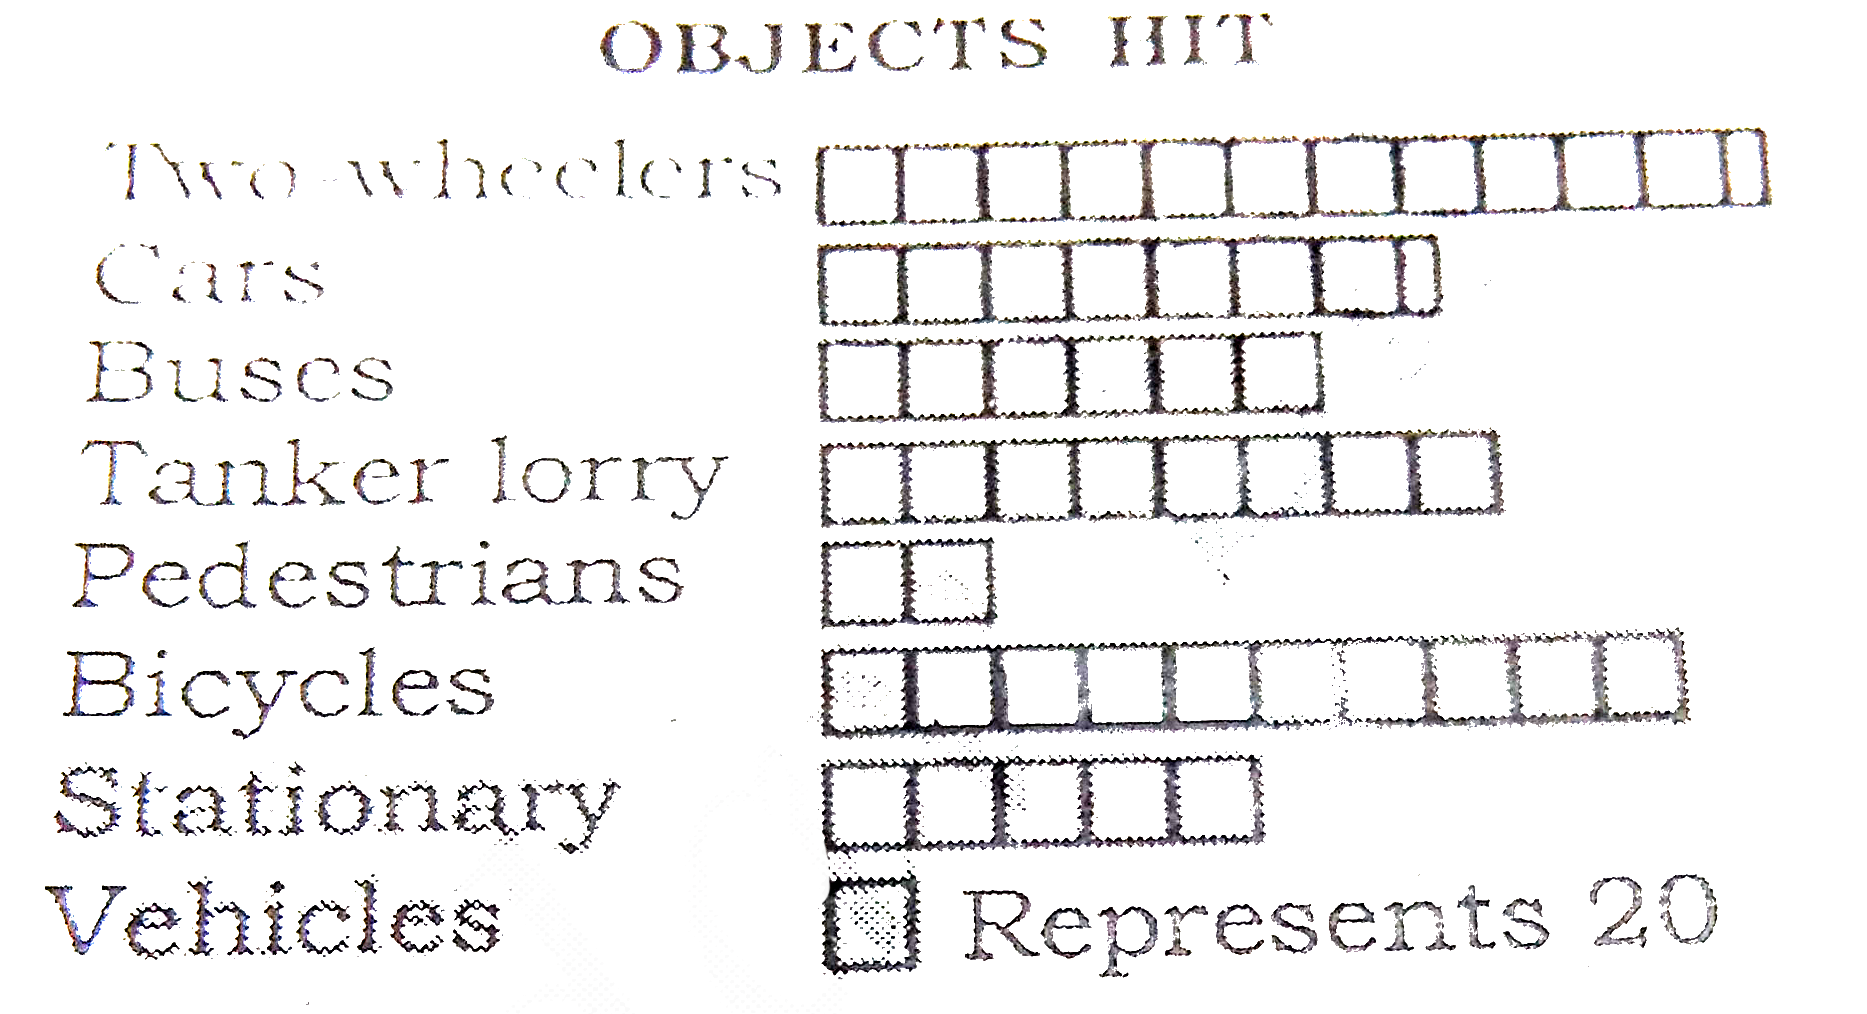
AsingularBmultipleC(1) and (2) both,DNone of these.Directions (Q. Nos. 16-20) The fallowing is a horizontal bar diagram showing the accidents in which two wheelers are involved with other objects. Study the diagram and answer the questions.

If the data of the bar diagram is represented by a pie chart and the angle of a sector of the pie chart is 36∘ , then this sector represents the accidents involvingAbusesBstationary vehiclesCpedestriansDbicyclesThe following is a horizontal bar diagram showing the accidents in which two - wheelers are involved with other objects. Study the diagram and answer the question.

कुल दुर्घटनाओं का 60% निम्न वाहनों से होता है ।ApedestrainsBbicylcesCbusesDstationary vehicles
Bars in bar diagrams are equidistant from each other. (True/False)
View Solutionbar graph and their construction
View SolutionMultiple bar diagrams are those diagrams which show…………..sets of data simultancolusly. (one or more/two of more)
View SolutionDraft a multiple bar diagram.
View SolutionBAR GRAPH: Definition
View Solution
