The sub-divided bar diagram given below depicts the result of B.Com. Students of a college for 3 years. Study the graph and answer the given questions.
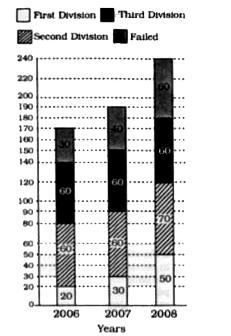
What was the pass percentage in 2008 ?
The correct Answer is:C
Step by step video & image solution for The sub-divided bar diagram given below depicts the result of B.Com. Students of a college for 3 years. Study the graph and answer the given questions. What was the pass percentage in 2008 ? by Maths experts to help you in doubts & scoring excellent marks in Class 14 exams.
Updated on:21/07/2023Topper's Solved these Questions
- STATISTICS AND DATA INTERPRETATIONBOOK - KIRAN PUBLICATIONCHAPTER - STATISTICS AND DATA INTERPRETATIONEXERCISE - TYPE-IV
182 Videos
- STATISTICS AND DATA INTERPRETATIONBOOK - KIRAN PUBLICATIONCHAPTER - STATISTICS AND DATA INTERPRETATIONEXERCISE - TYPE-V
38 Videos
- STATISTICS AND DATA INTERPRETATIONBOOK - KIRAN PUBLICATIONCHAPTER - STATISTICS AND DATA INTERPRETATIONEXERCISE - TYPE-II
131 Videos
- SIMPLIFICATIONBOOK - KIRAN PUBLICATIONCHAPTER - SIMPLIFICATIONEXERCISE - TEST YOURSELF
25 Videos
- TIME AND DISTANCEBOOK - KIRAN PUBLICATIONCHAPTER - TIME AND DISTANCEEXERCISE - Type -XI
74 Videos
Similar Questions
The sub-divided bar diagram given below depicts the result of B.Com. Students of a college for 3 years. Study the graph and answer the given questions.
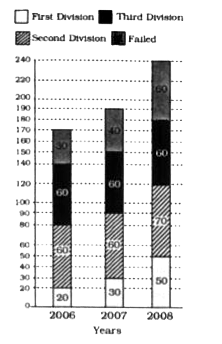
What was the number of third divisions in 2006 ?
View SolutionThe sub-divided bar diagram given below depicts the result of B.Com. Students of a college for 3 years. Study the graph and answer the given questions.
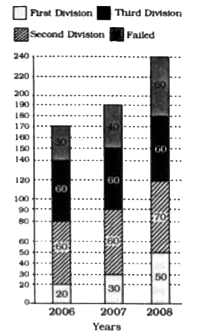
How many percent of students passed in first division in 2007?
View Solution
Knowledge Check
The sum-divided bar-diagram given below depicts the result of B.Sc. Students of a college for three years.
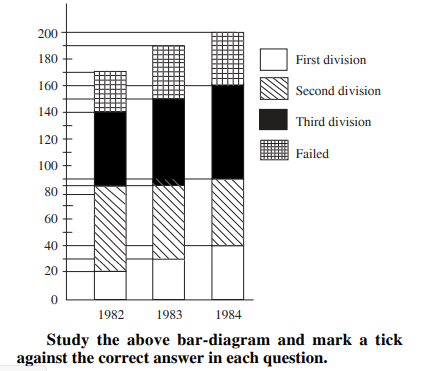
What was the pass percentage in 1982 ?A65%B70%C74.6%D88.8%The sum-divided bar-diagram given below depicts the result of B.Sc. Students of a college for three years.
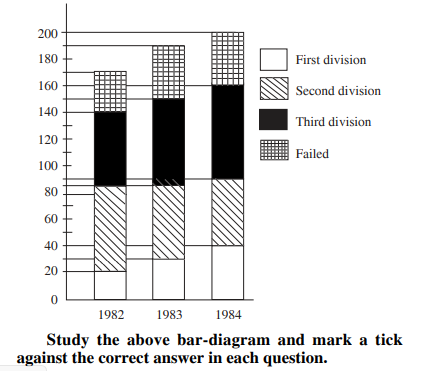
What is the number of third divisions in 1984 ?A165B75C70D65The sum-divided bar-diagram given below depicts the result of B.Sc. Students of a college for three years.
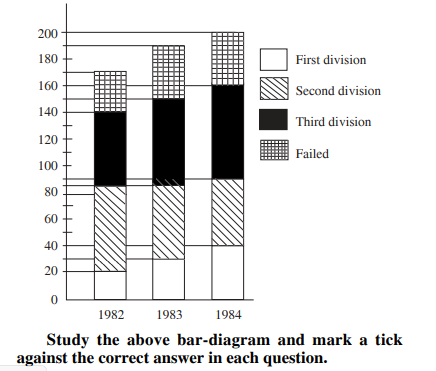
What is the aggregate pass percentage during three years ?A5123%B82.7%C80.4%D77.6%
The sub-divided bar diagram given below depicts the result of B.Com. Students of a college for 3 years. Study the graph and answer the given questions.
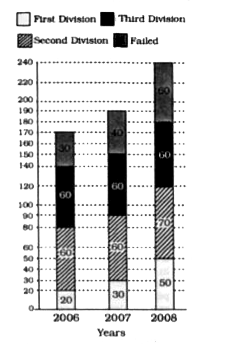
In which year, did the college have the best result for B.Com ?
View SolutionThe sub divided bar diagram given below depicts the result of Class XII students of a school for three years. Study the diagram and answer the questions given below :
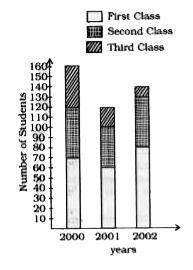
The percenatge of students passed with Second class in the year 2000 is
View SolutionThe sub divided bar diagram given below depicts the result of Class XII students of a school for three years. Study the diagram and answer the questions given below :
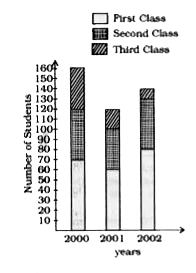
The percenatge of students passed with First class in the year 2001 is
View SolutionThe sum-divided bar-diagram given below depicts the result of B.Sc. Students of a college for three years.
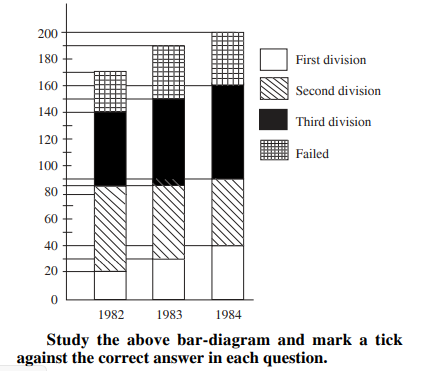
How many percent passed in Ist division in 1982 ?
View SolutionThe sum-divided bar-diagram given below depicts the result of B.Sc. Students of a college for three years.
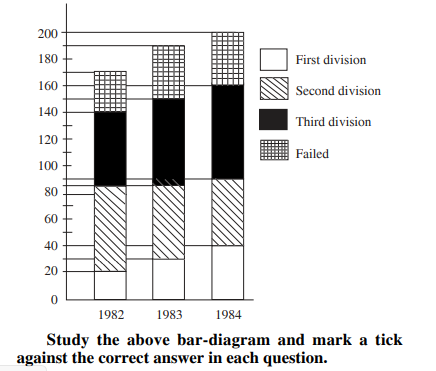
What is the percentage of students in 1984 over 1982 ?
View Solution
