The sub-divided bar diagram given below depicts the result of B.Com. Students of a college for 3 years. Study the graph and answer the given questions.
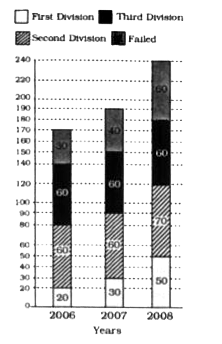
What was the number of third divisions in 2006 ?
60
140
59
120
The correct Answer is:A
Step by step video & image solution for The sub-divided bar diagram given below depicts the result of B.Com. Students of a college for 3 years. Study the graph and answer the given questions. What was the number of third divisions in 2006 ? by Maths experts to help you in doubts & scoring excellent marks in Class 14 exams.
Updated on:21/07/2023Topper's Solved these Questions
- STATISTICS AND DATA INTERPRETATIONBOOK - KIRAN PUBLICATIONCHAPTER - STATISTICS AND DATA INTERPRETATIONEXERCISE - TYPE-IV
182 Videos
- STATISTICS AND DATA INTERPRETATIONBOOK - KIRAN PUBLICATIONCHAPTER - STATISTICS AND DATA INTERPRETATIONEXERCISE - TYPE-V
38 Videos
- STATISTICS AND DATA INTERPRETATIONBOOK - KIRAN PUBLICATIONCHAPTER - STATISTICS AND DATA INTERPRETATIONEXERCISE - TYPE-II
131 Videos
- SIMPLIFICATIONBOOK - KIRAN PUBLICATIONCHAPTER - SIMPLIFICATIONEXERCISE - TEST YOURSELF
25 Videos
- TIME AND DISTANCEBOOK - KIRAN PUBLICATIONCHAPTER - TIME AND DISTANCEEXERCISE - Type -XI
74 Videos
Similar Questions
The sub-divided bar diagram given below depicts the result of B.Com. Students of a college for 3 years. Study the graph and answer the given questions.
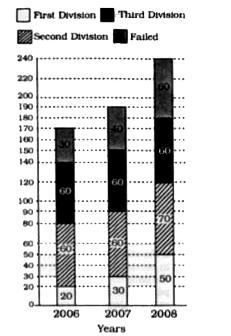
What was the pass percentage in 2008 ?
View SolutionThe sub-divided bar diagram given below depicts the result of B.Com. Students of a college for 3 years. Study the graph and answer the given questions.
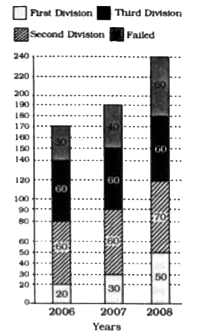
How many percent of students passed in first division in 2007?
View Solution
Knowledge Check
The sum-divided bar-diagram given below depicts the result of B.Sc. Students of a college for three years.
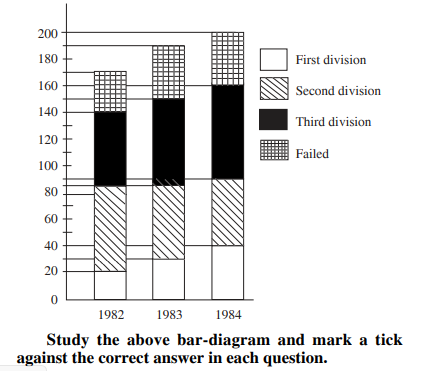
What is the number of third divisions in 1984 ?A165B75C70D65The sum-divided bar-diagram given below depicts the result of B.Sc. Students of a college for three years.
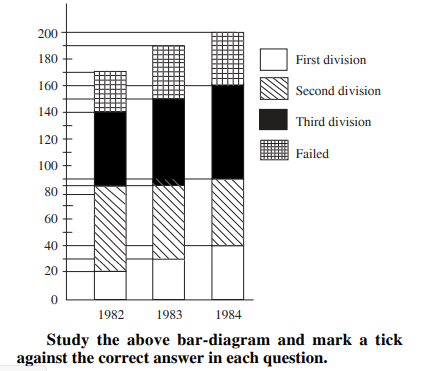
What was the pass percentage in 1982 ?A65%B70%C74.6%D88.8%The sum-divided bar-diagram given below depicts the result of B.Sc. Students of a college for three years.
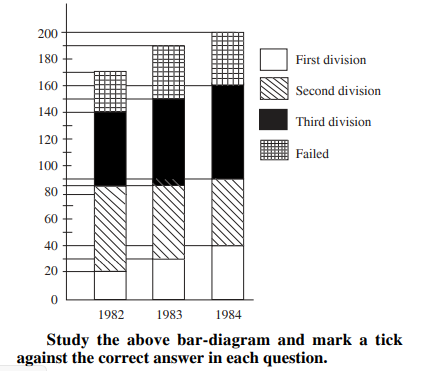
How many percent passed in Ist division in 1982 ?A20%B34%C1427%D111317%
The sub-divided bar diagram given below depicts the result of B.Com. Students of a college for 3 years. Study the graph and answer the given questions.
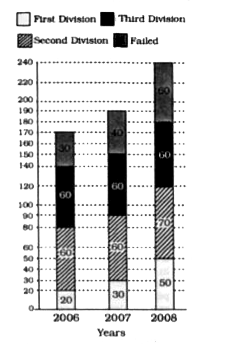
In which year, did the college have the best result for B.Com ?
View SolutionThe sub divided bar diagram given below depicts the result of Class XII students of a school for three years. Study the diagram and answer the questions given below :
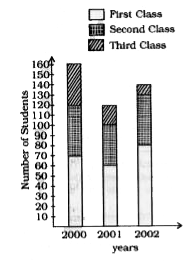
The number of students passed with Third class in th year 2002 is
View SolutionThe sub divided bar diagram given below depicts the result of Class XII students of a school for three years. Study the diagram and answer the questions given below :
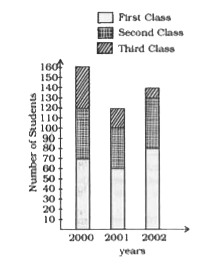
The number of students passed with Second class in th year 2002 is
View SolutionThe sum-divided bar-diagram given below depicts the result of B.Sc. Students of a college for three years.
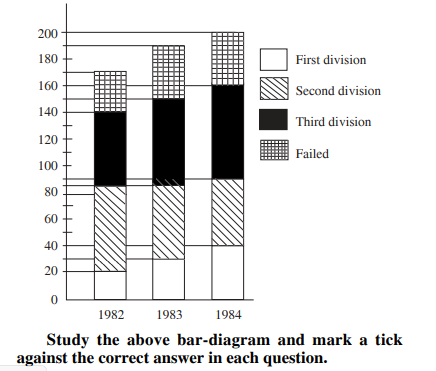
What is the aggregate pass percentage during three years ?
View SolutionDirection : The sub divided bar diagram given below depicts H.S Students of school for three years. Study the diagram and answer the questions.
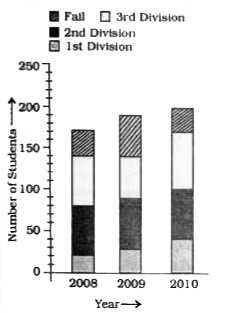
The number of students passed in third division in the year 2008 was
View Solution
