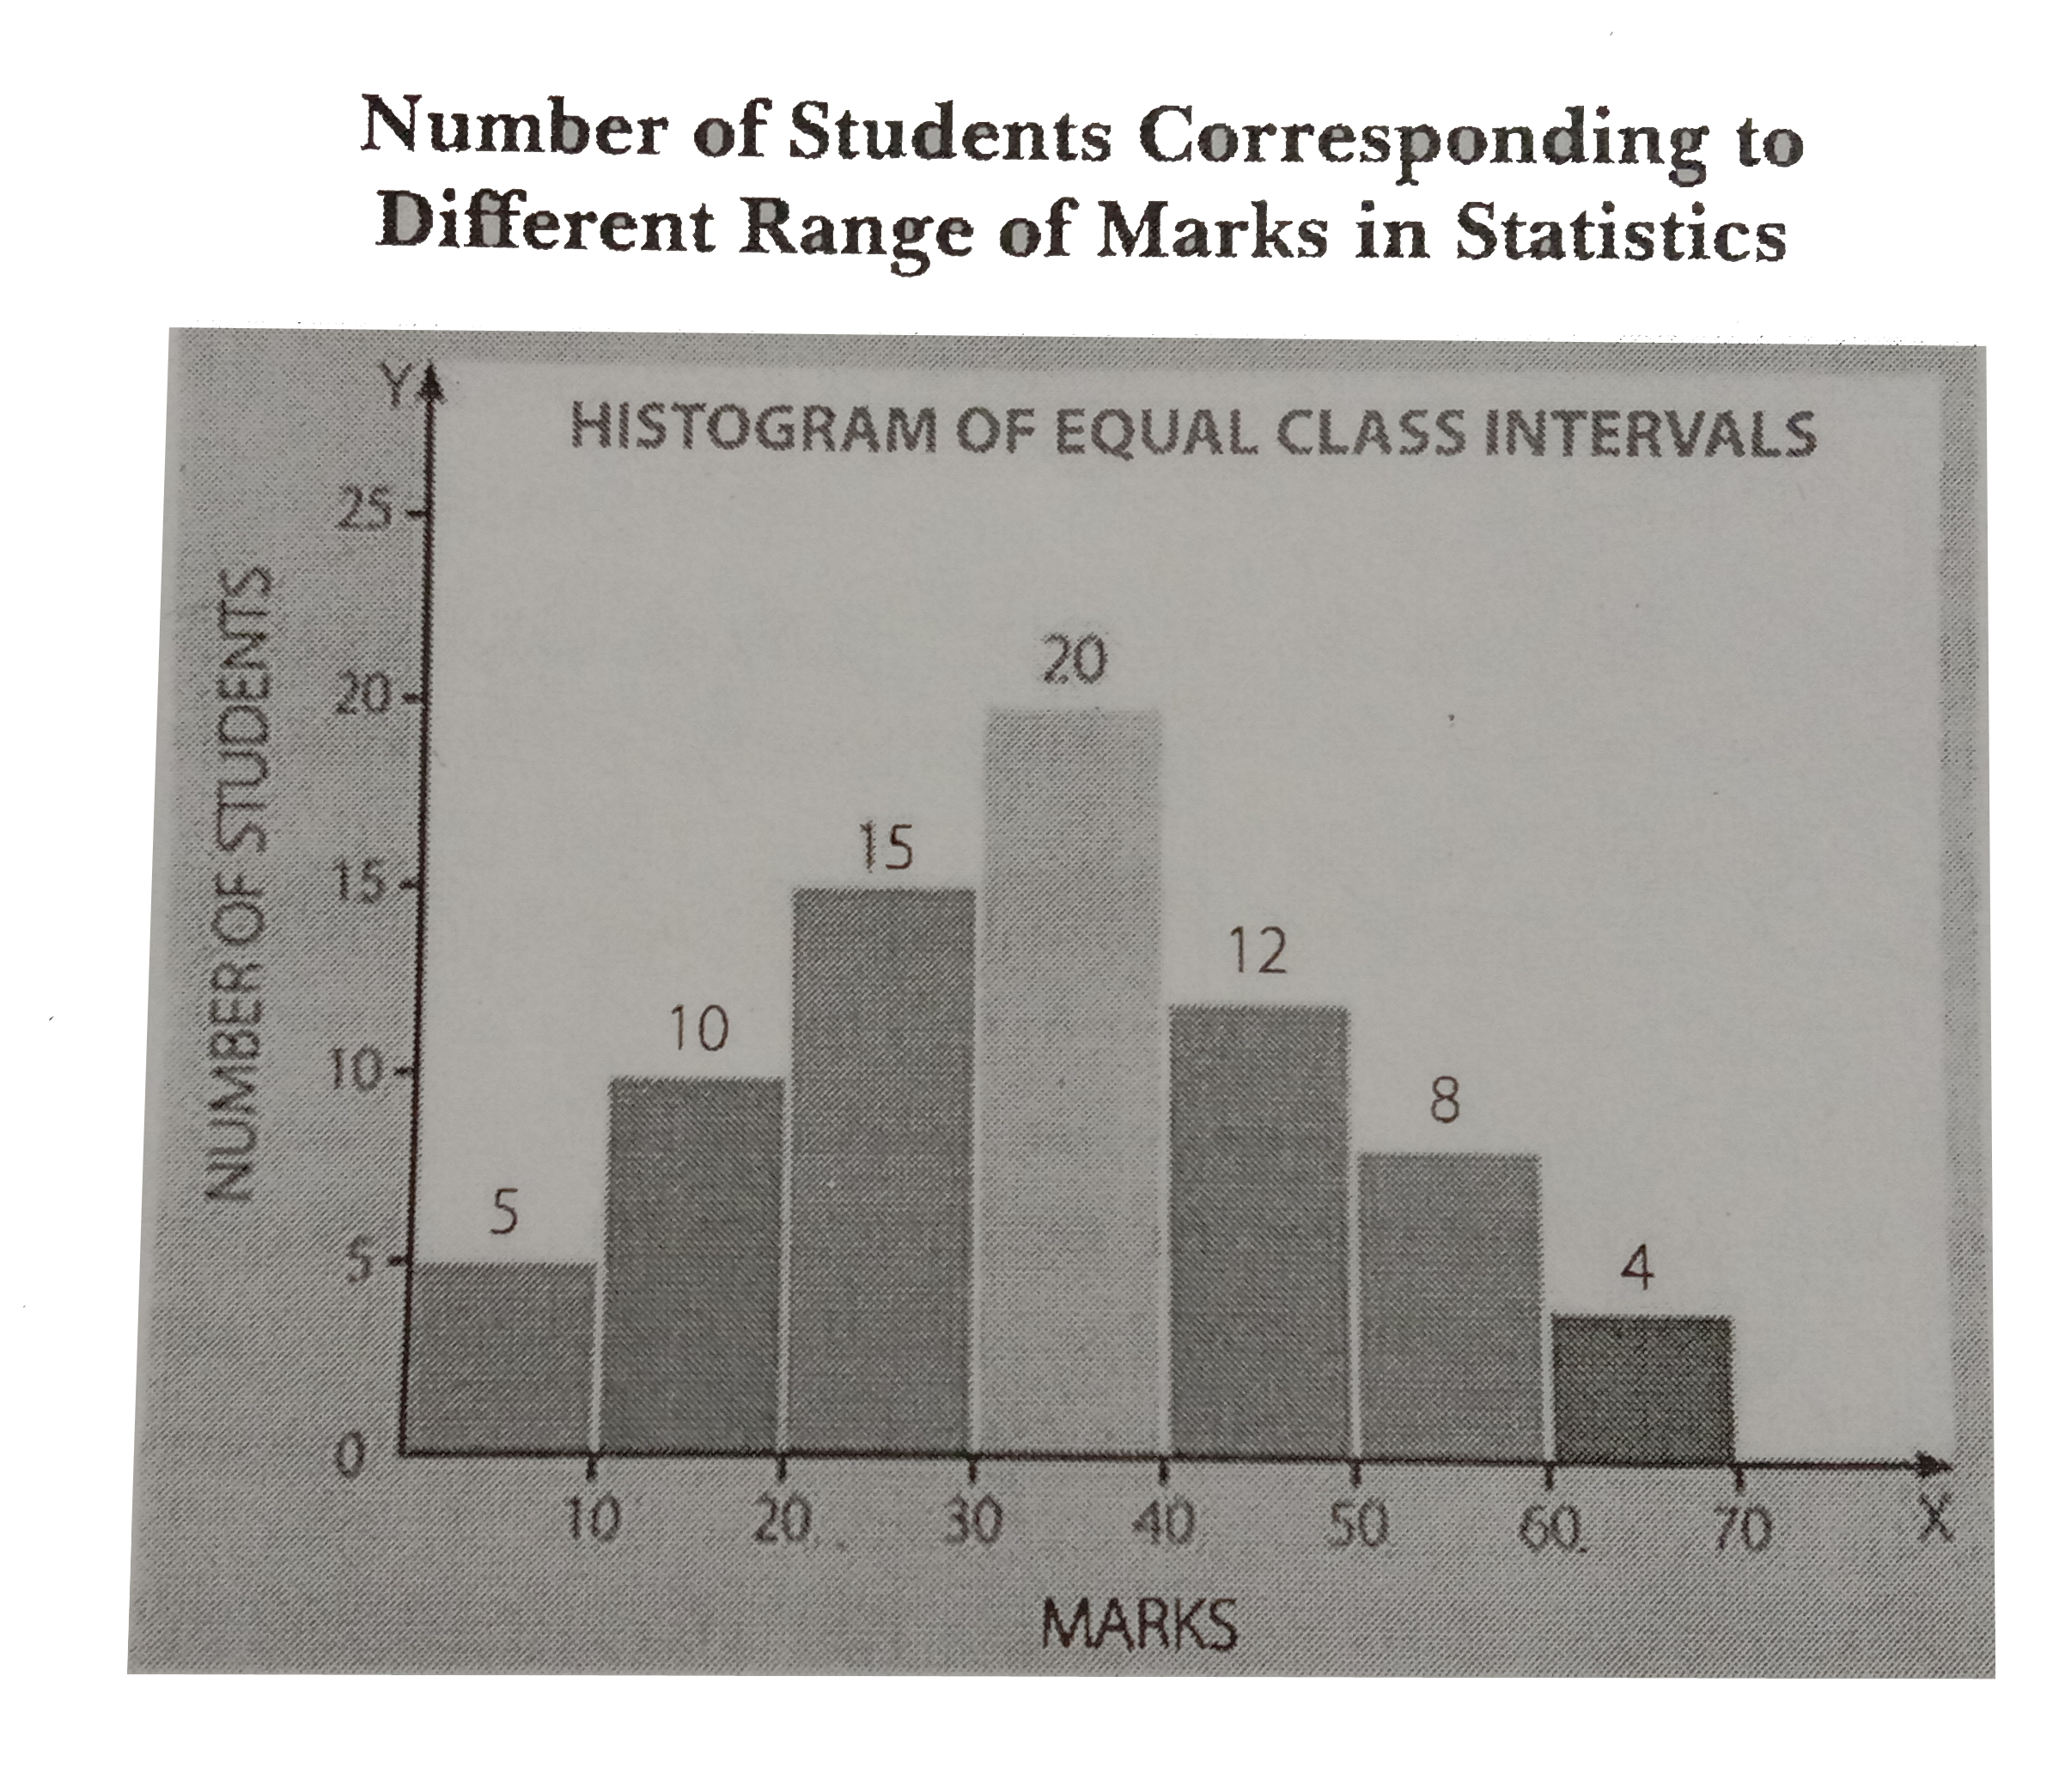
The table below shows number of students of students of a college corresponding to different range of marks in Statistics. Present the information in the form of a histogram.

Topper's Solved these Questions
- BOOK - TARUN JAIN & VK OHRICHAPTER - FREQUENCY DIAGRAMS - HISTOGRAM, POLYGON AND OGIVEEXERCISE - Miscellaneous Illustration8videos
FREQUENCY DIAGRAMS - HISTOGRAM, POLYGON AND OGIVE
- BOOK - TARUN JAIN & VK OHRICHAPTER - FREQUENCY DIAGRAMS - HISTOGRAM, POLYGON AND OGIVEEXERCISE - EXERCISE M.C.Q6videos
FREQUENCY DIAGRAMS - HISTOGRAM, POLYGON AND OGIVE
- BOOK - TARUN JAIN & VK OHRICHAPTER - DIAGRAMMATIC PRESENTATION OF DATA BAR DIAGRAMS AND PIE DIAGRAMSEXERCISE - NCERT Question (With Hints to Answers)3videos
DIAGRAMMATIC PRESENTATION OF DATA BAR DIAGRAMS AND PIE DIAGRAMS
- BOOK - TARUN JAIN & VK OHRICHAPTER - INDEX NUMBERSEXERCISE - NCERT Questions (With Hints to Answers)12videos
INDEX NUMBERS
Similar Questions
Knowledge Check
- Question 1 - Select One
The data below shows the number of students in class A having secured different marks.
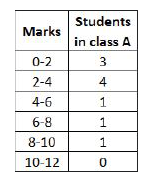
What is the mean marks of class A?A2B3.8C2.8D1.6 - Question 2 - Select One
The table given below shows the number of students strudying in five colleges in the given five years.
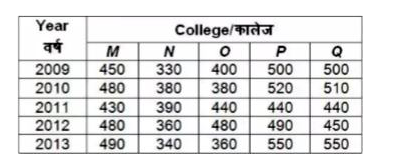
What is the ratio of the total number of students of college N in all years to the total number of students of all the colleges styding in the year 2011?A100 : 107B90 : 107C90 : 119D90 : 127 - Question 3 - Select One
The data below shows the number of students in class A and B having secured different marks.
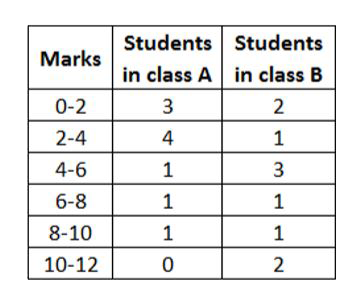
What is the combined mean of A and B?A3.75B3.5C4.7D4
The table given below shows the number of students who were absent and percentage of students who were present in the given two examinations from five different schools. The table also shows the percentage of students who were present in the Biology and Physics examination respectively.

If the number of students who were present in the Physics examination from school A is 250% of the difference of the number of the students who were present in Physics and bilogy examination, from school K, then what is the ratio of the number of students who were present from school L to number of students who were present in Physics examination from school A?View SolutionThe table given below shows the number of students who were absent and percentage of students who were present in the given two examinations from five different schools. The table shows the percentage of students who were present in the Biology and Physics examination respectively.
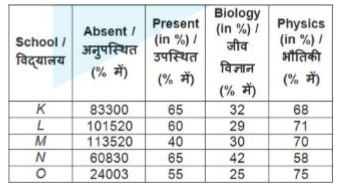
If the number of students who were present in the Physics examination from school A is 250% of the difference of the number of the students who were present in Physics and Biology examination, from school K, then what is the ratio of the number of students who were present from school L to number of students who were present in Physics examination from school A?View SolutionThe table given below shows the number of students enrolled in different courses of different colleges.
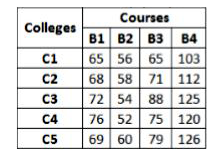
What is the difference in the total number of students enrolled in colleges C3 and C4?View SolutionThe table given below shows the number of students studying in five colleges in the given five years.
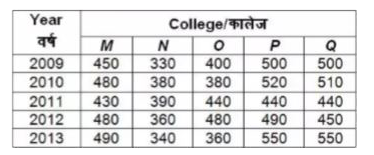
In which of the given years the average number of students studying is maximum?View SolutionThe table given below shows the number of students strudying in five colleges in the given five years.
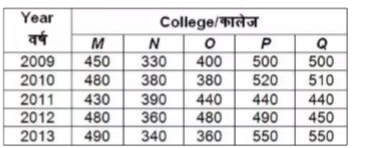
What is the average of the total number of students studying in college M in the given years?View Solution


