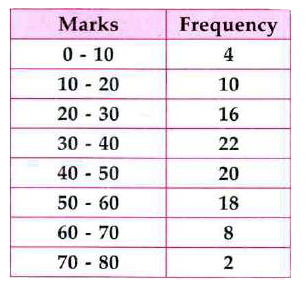
Present the following data in the form of a histogram :

The correct Answer is:First , convert the data into a continuous frequency table; e.g., 115 will be 110-120
Step by step video, text & image solution for Present the following data in the form of a histogram : by Economics experts to help you in doubts & scoring excellent marks in Class 11 exams.
Updated on:21/07/2023Topper's Solved these Questions
- FREQUENCY DIAGRAMS - HISTOGRAM, POLYGON AND OGIVEBOOK - TARUN JAIN & VK OHRICHAPTER - FREQUENCY DIAGRAMS - HISTOGRAM, POLYGON AND OGIVEEXERCISE - EXERCISE NCERT
7 Videos
- FREQUENCY DIAGRAMS - HISTOGRAM, POLYGON AND OGIVEBOOK - TARUN JAIN & VK OHRICHAPTER - FREQUENCY DIAGRAMS - HISTOGRAM, POLYGON AND OGIVEEXERCISE - EXERCISE CONCEPT BASED OBJECTIVE
5 Videos
- DIAGRAMMATIC PRESENTATION OF DATA BAR DIAGRAMS AND PIE DIAGRAMSBOOK - TARUN JAIN & VK OHRICHAPTER - DIAGRAMMATIC PRESENTATION OF DATA BAR DIAGRAMS AND PIE DIAGRAMSEXERCISE - NCERT Question (With Hints to Answers)
3 Videos
- INDEX NUMBERSBOOK - TARUN JAIN & VK OHRICHAPTER - INDEX NUMBERSEXERCISE - NCERT Questions (With Hints to Answers)
12 Videos
Similar Questions
Present the following data in the form of horizontal bar diagram :

View SolutionPresent the following data in the form of a multiple bar diagrm:

View SolutionPresent the following data in the form of a frequency polygon :

View SolutionThe table below shows number of students of students of a college corresponding to different range of marks in Statistics. Present the information in the form of a histogram.

View SolutionThe following table gives the marks scored by 100 students in an entrance examination

Represent this data in the form of a histogram.
View SolutionRepresent the following data by histogram:

View SolutionRepresent the following data using a histogram.

View SolutionPresent the following data on the production of food grains in the form of a sub divided bar diagrm:

View SolutionFollowing data relate to the construction of a house in delhi .present the information in the form of a pie diagram:

View SolutionPresent the data given in the table below in a histogram :

View Solution
