A graph showing________values of a variable on a graph paper is called arithmetic line-graph. (arithmetic/geometric)
Text Solution
The correct Answer is:arithmetic
arithmetic
|
Topper's Solved these Questions
- ARITHMETIC LINE-GRAPHS OR TIME SERIES GRAPHSBOOK - TARUN JAIN & VK OHRICHAPTER - ARITHMETIC LINE-GRAPHS OR TIME SERIES GRAPHSEXERCISE - C. True or False
2 Videos
- ARITHMETIC LINE-GRAPHS OR TIME SERIES GRAPHSBOOK - TARUN JAIN & VK OHRICHAPTER - ARITHMETIC LINE-GRAPHS OR TIME SERIES GRAPHSEXERCISE - D. Concept - based Objective Questions
5 Videos
- ARITHMETIC LINE-GRAPHS OR TIME SERIES GRAPHSBOOK - TARUN JAIN & VK OHRICHAPTER - ARITHMETIC LINE-GRAPHS OR TIME SERIES GRAPHSEXERCISE - A. Mupltiple Choice Questions
6 Videos
- CENSUS AND SAMPLE METHODS OF COLLECTION OF DATABOOK - TARUN JAIN & VK OHRICHAPTER - CENSUS AND SAMPLE METHODS OF COLLECTION OF DATAEXERCISE - NCERT Question
9 Videos
Similar Questions
Knowledge Check
Arithmetic line-graphs are also known as:
Alinear graphsBnon-linear graphsCtime series graphsDnone of theseThe graph showing a time series is called
AHistorigramBOgiveCHictogramDPolygon
Which one is the correct graph for arithmetic growth?
View SolutionWhich one is the correct graph for arithmetic growth?
View SolutionConstruction of Bar graphs on Graph paper
View SolutionDescribe arithmetic growth and geometric growth.
View SolutionIn a __________ graph, all the points on the graph lie on the same straight line.
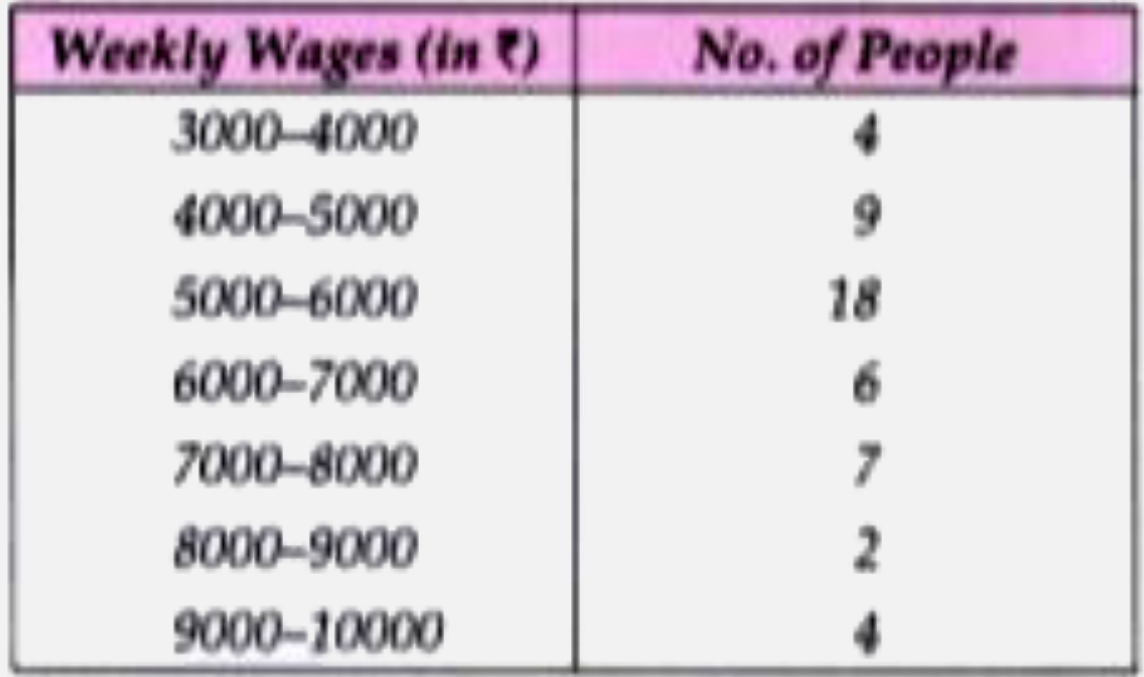
View SolutionDraw a Histogram for the data, using a graph paper:

Estimate the mode from the graph.
View Solution
