Which of the following volume-temperature plots represents the behaviour of of an ideal gas at the atmospheric pressure?
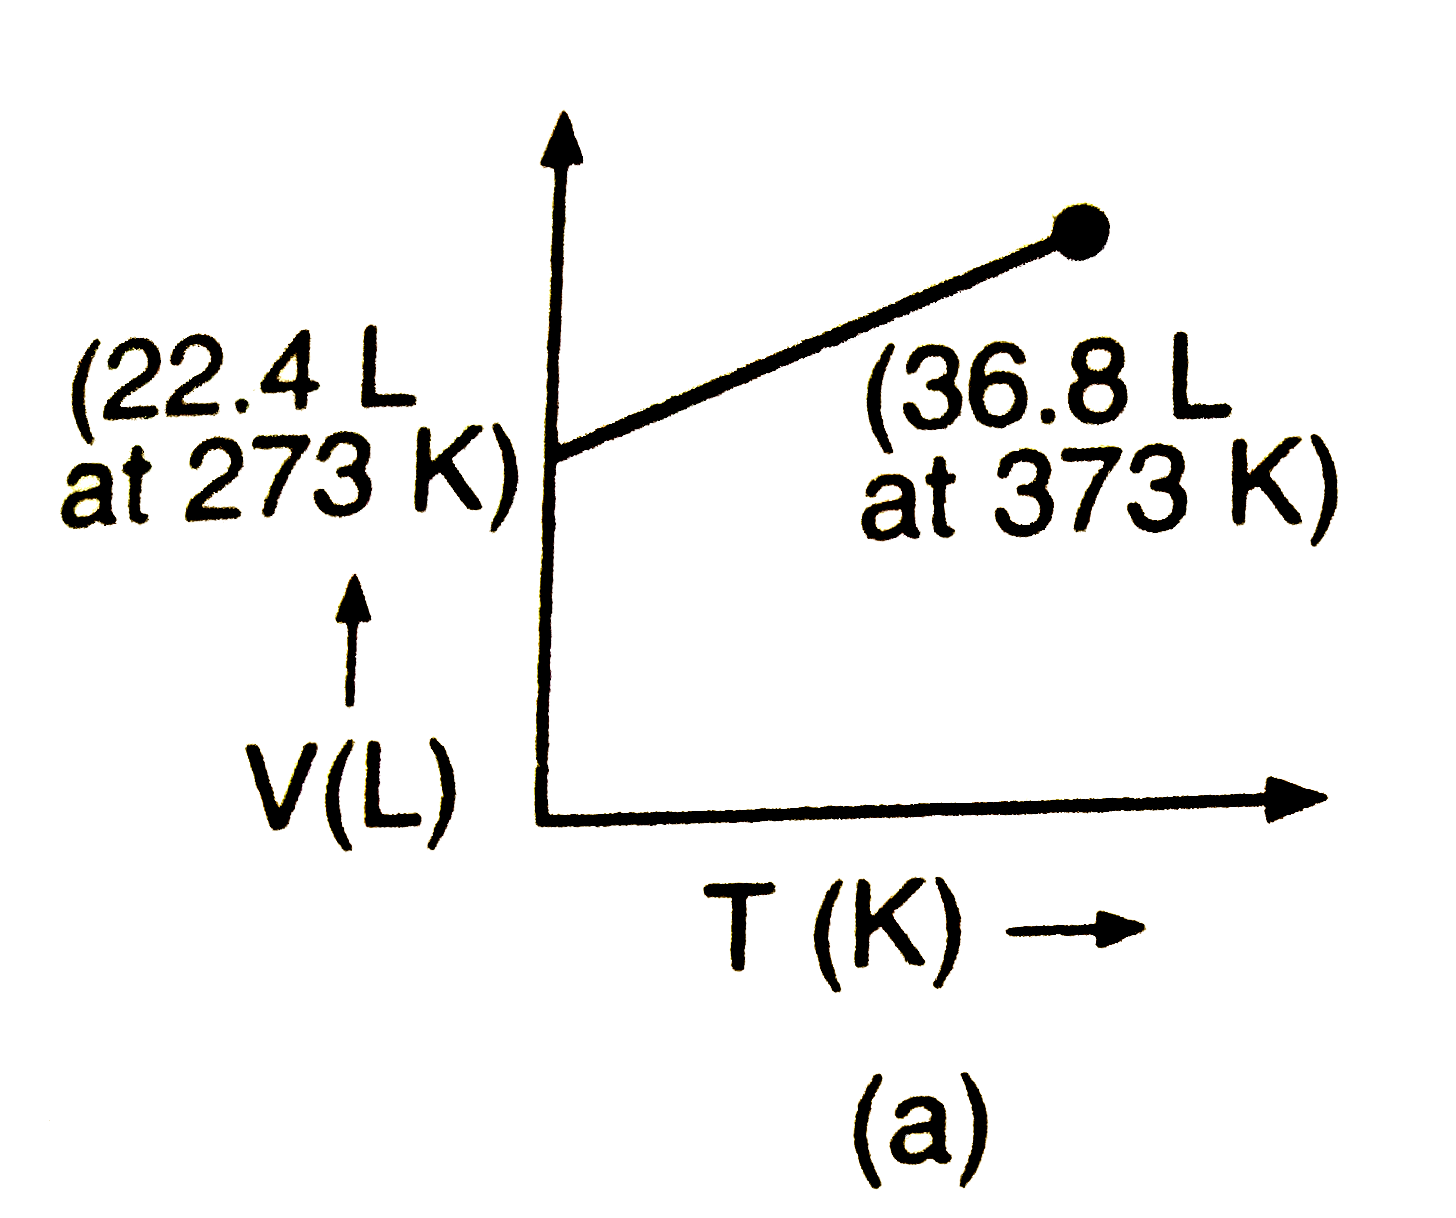
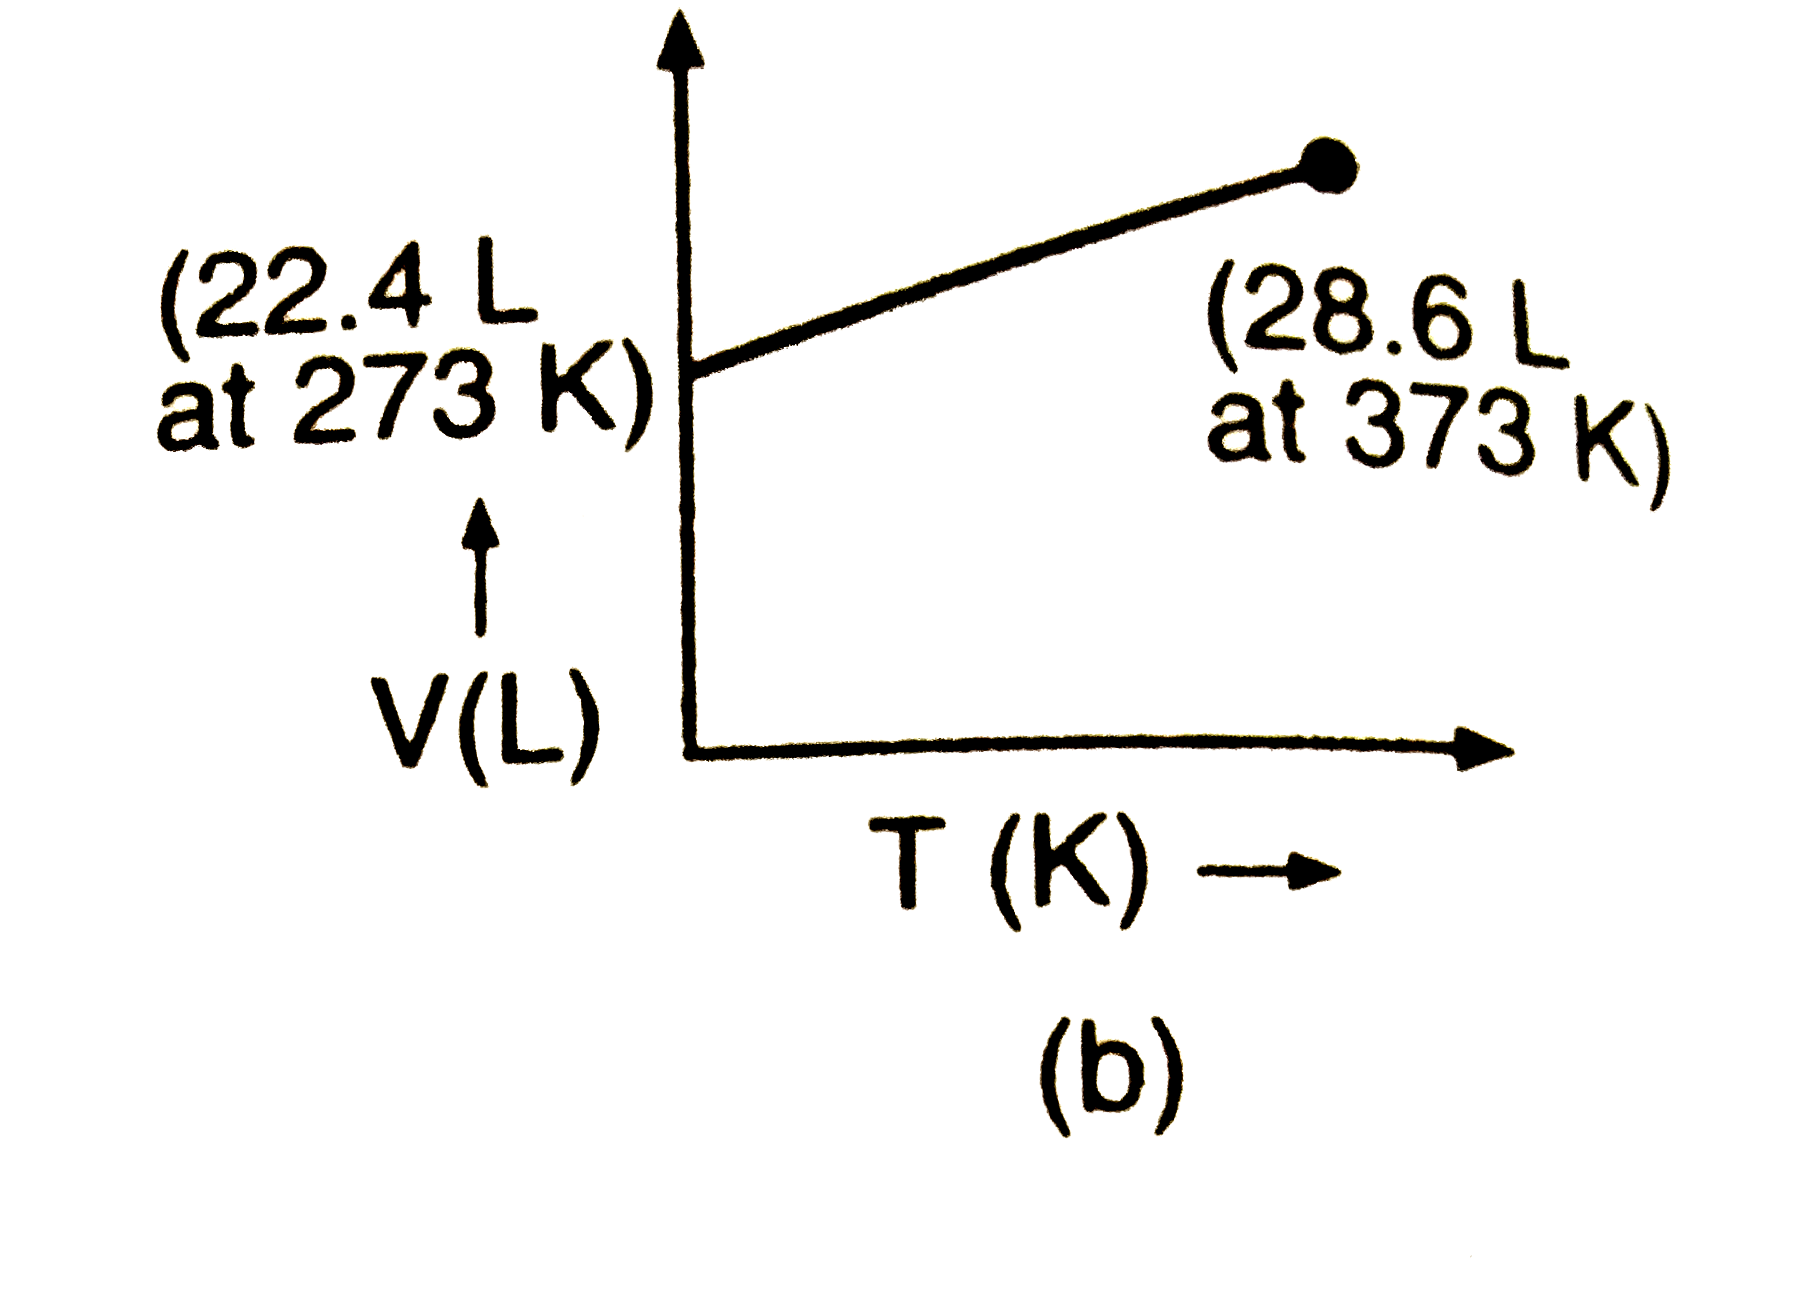
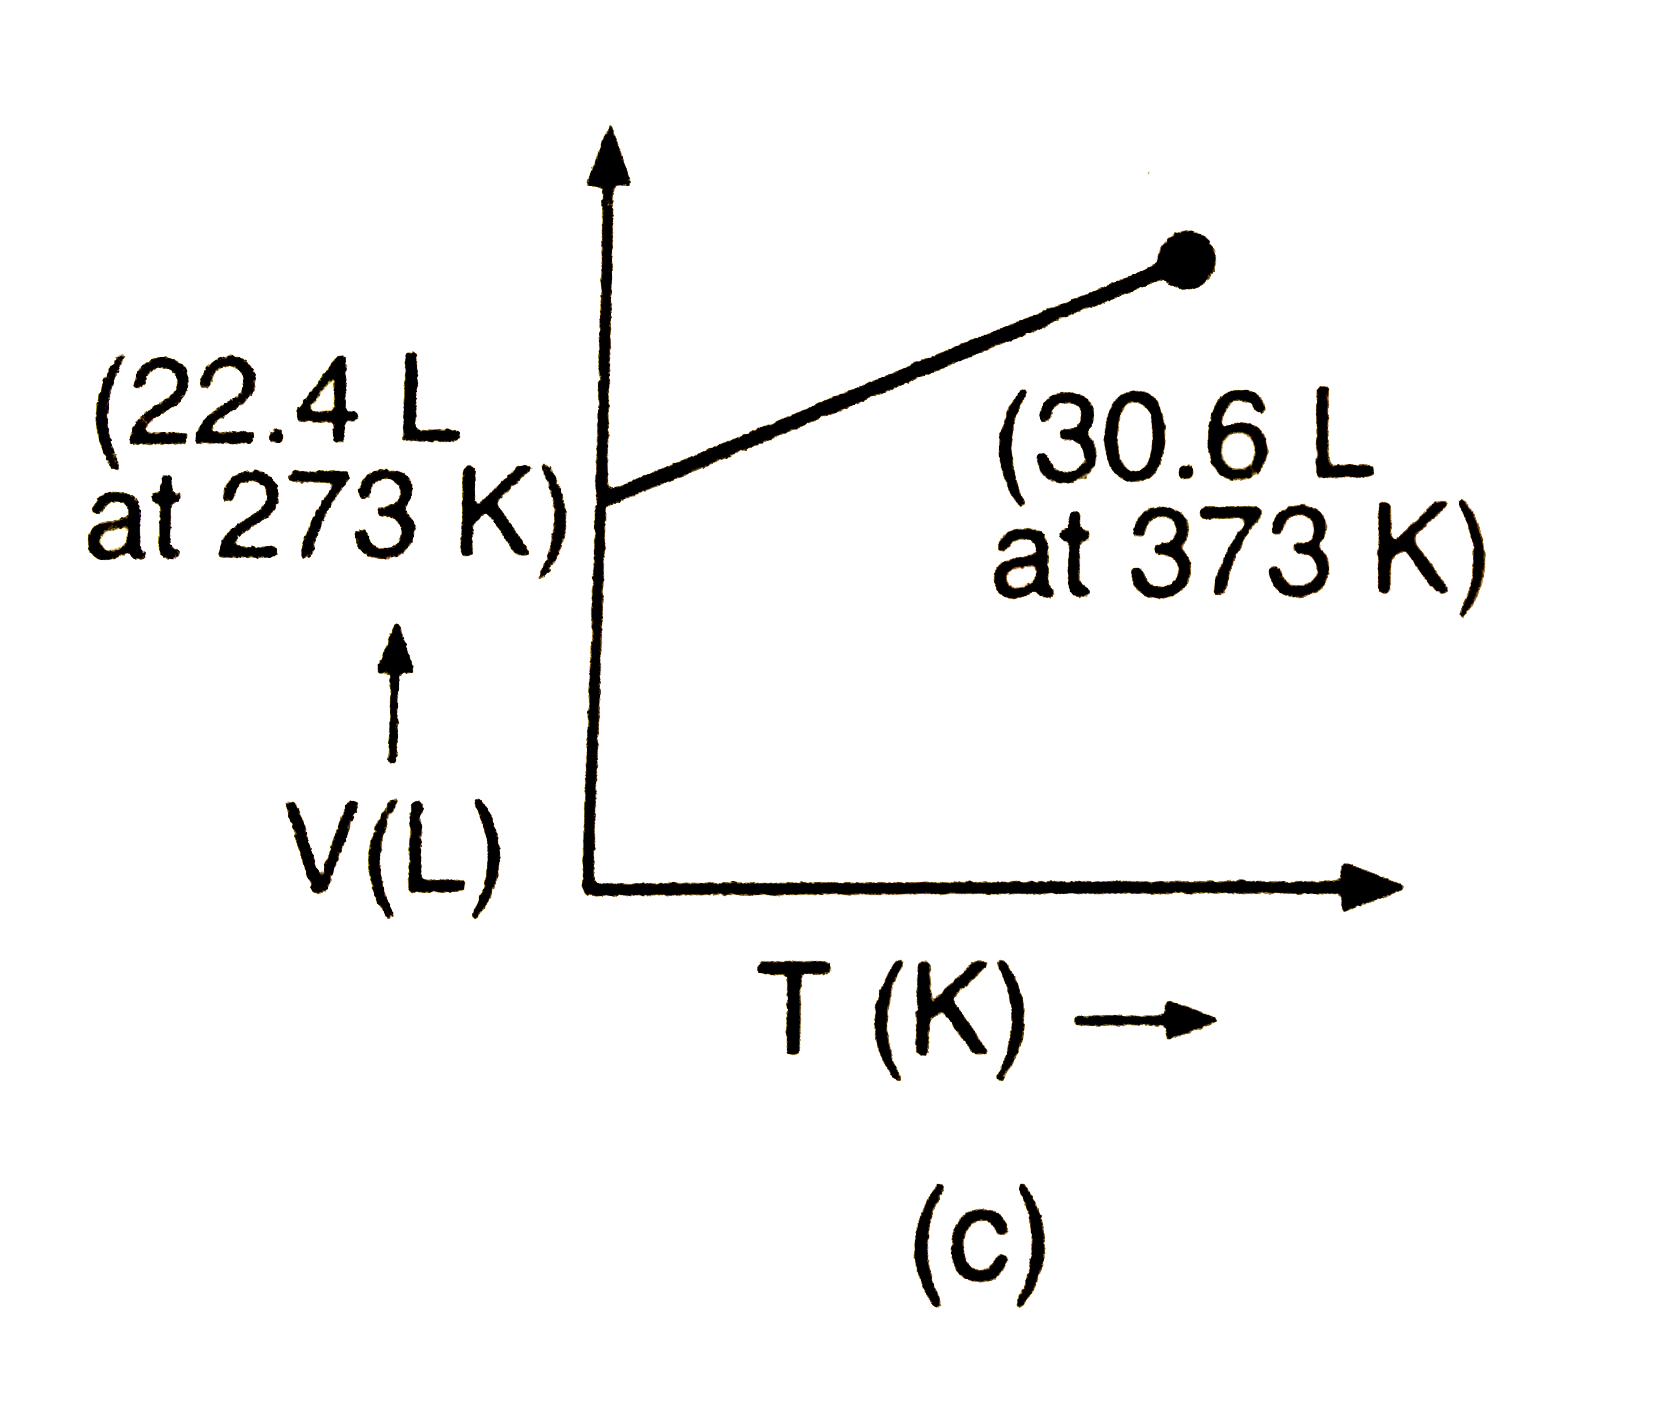
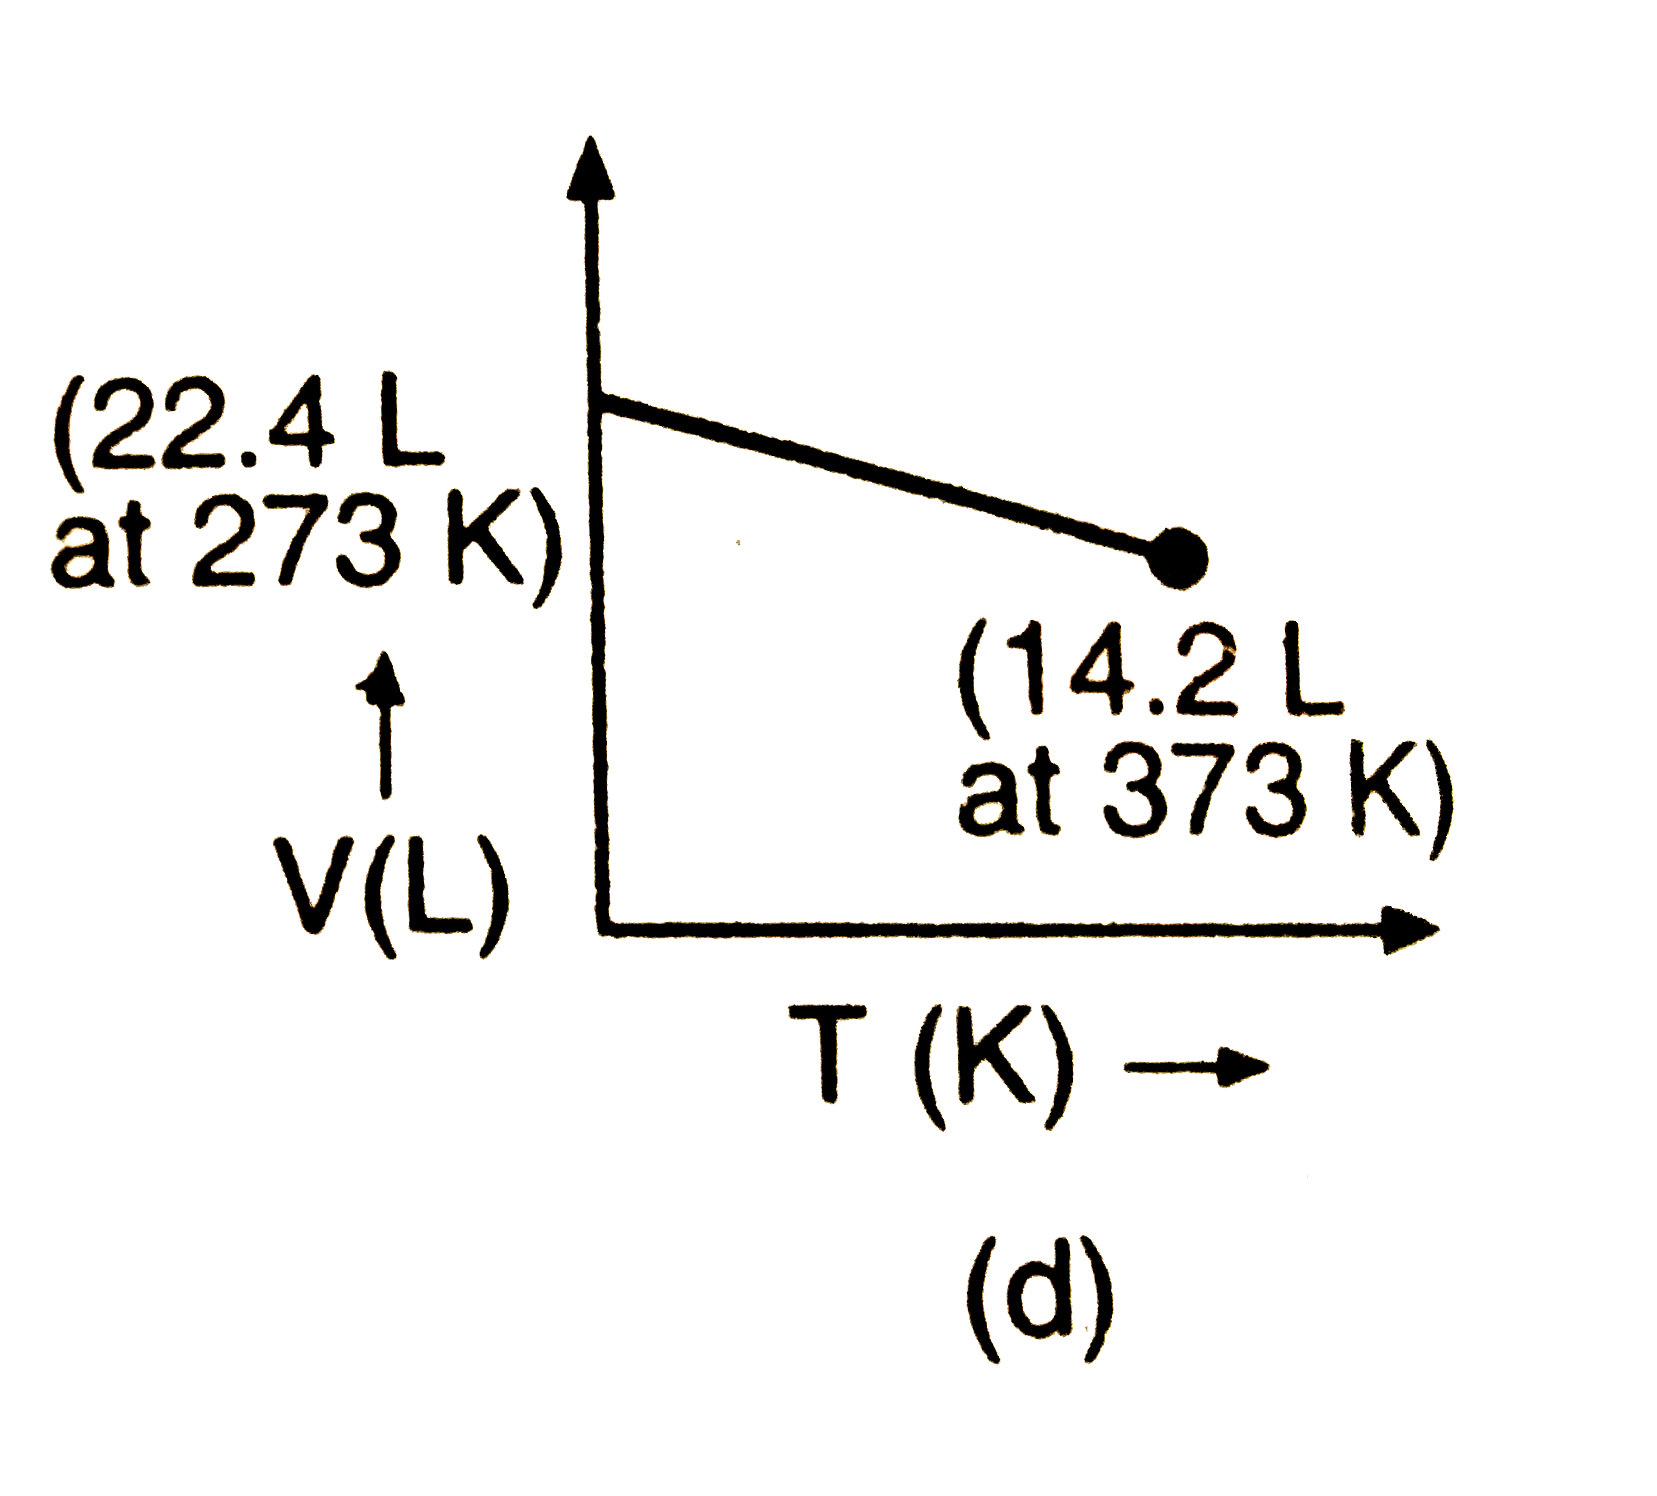
The correct Answer is:C
Step by step video, text & image solution for Which of the following volume-temperature (V-I) plots represents the behaviour of 1 "mole" of an ideal gas at the atmospheric pressure? by Chemistry experts to help you in doubts & scoring excellent marks in Class 11 exams.
Updated on:21/07/2023Topper's Solved these Questions
- STATES OF MATTER (GASES AND LIQUIDS)BOOK - OP TANDONCHAPTER - STATES OF MATTER (GASES AND LIQUIDS)EXERCISE - Set 2
40 Videos
- STATES OF MATTER (GASES AND LIQUIDS)BOOK - OP TANDONCHAPTER - STATES OF MATTER (GASES AND LIQUIDS)EXERCISE - Objective questions Level B
34 Videos
- STATES OF MATTER (GASES AND LIQUIDS)BOOK - OP TANDONCHAPTER - STATES OF MATTER (GASES AND LIQUIDS)EXERCISE - Practice Problems
53 Videos
- SOLUTIONS (GENERAL AND COLLIGATIVE PROPERTIES)BOOK - OP TANDONCHAPTER - SOLUTIONS (GENERAL AND COLLIGATIVE PROPERTIES)EXERCISE - Self Assessment
31 Videos
- STATES OF MATTER (SOLID STATE)BOOK - OP TANDONCHAPTER - STATES OF MATTER (SOLID STATE)EXERCISE - SELF ASSESSMENT Section VI
3 Videos
Similar Questions
Which of the following volume (V) - temperature (T) plots represents the behaviour of one mole of an ideal gas at one atmospheric pressure?
View SolutionWhich of the following volume (V)-temperature (T) plots represents the behaviour of one mole of an ideal gas at one atmoshperic pressure?
View Solution
Knowledge Check
Which of the following volume (V) - temperature (T) plots represents the behaviour of one mole of an ideal gas at one atmospheric pressure?
A B
B C
C D
D
Which one of the following volume (V)- temperature (T) plots represents the behaviour of one mole of an ideal gas at one atmosphere?
A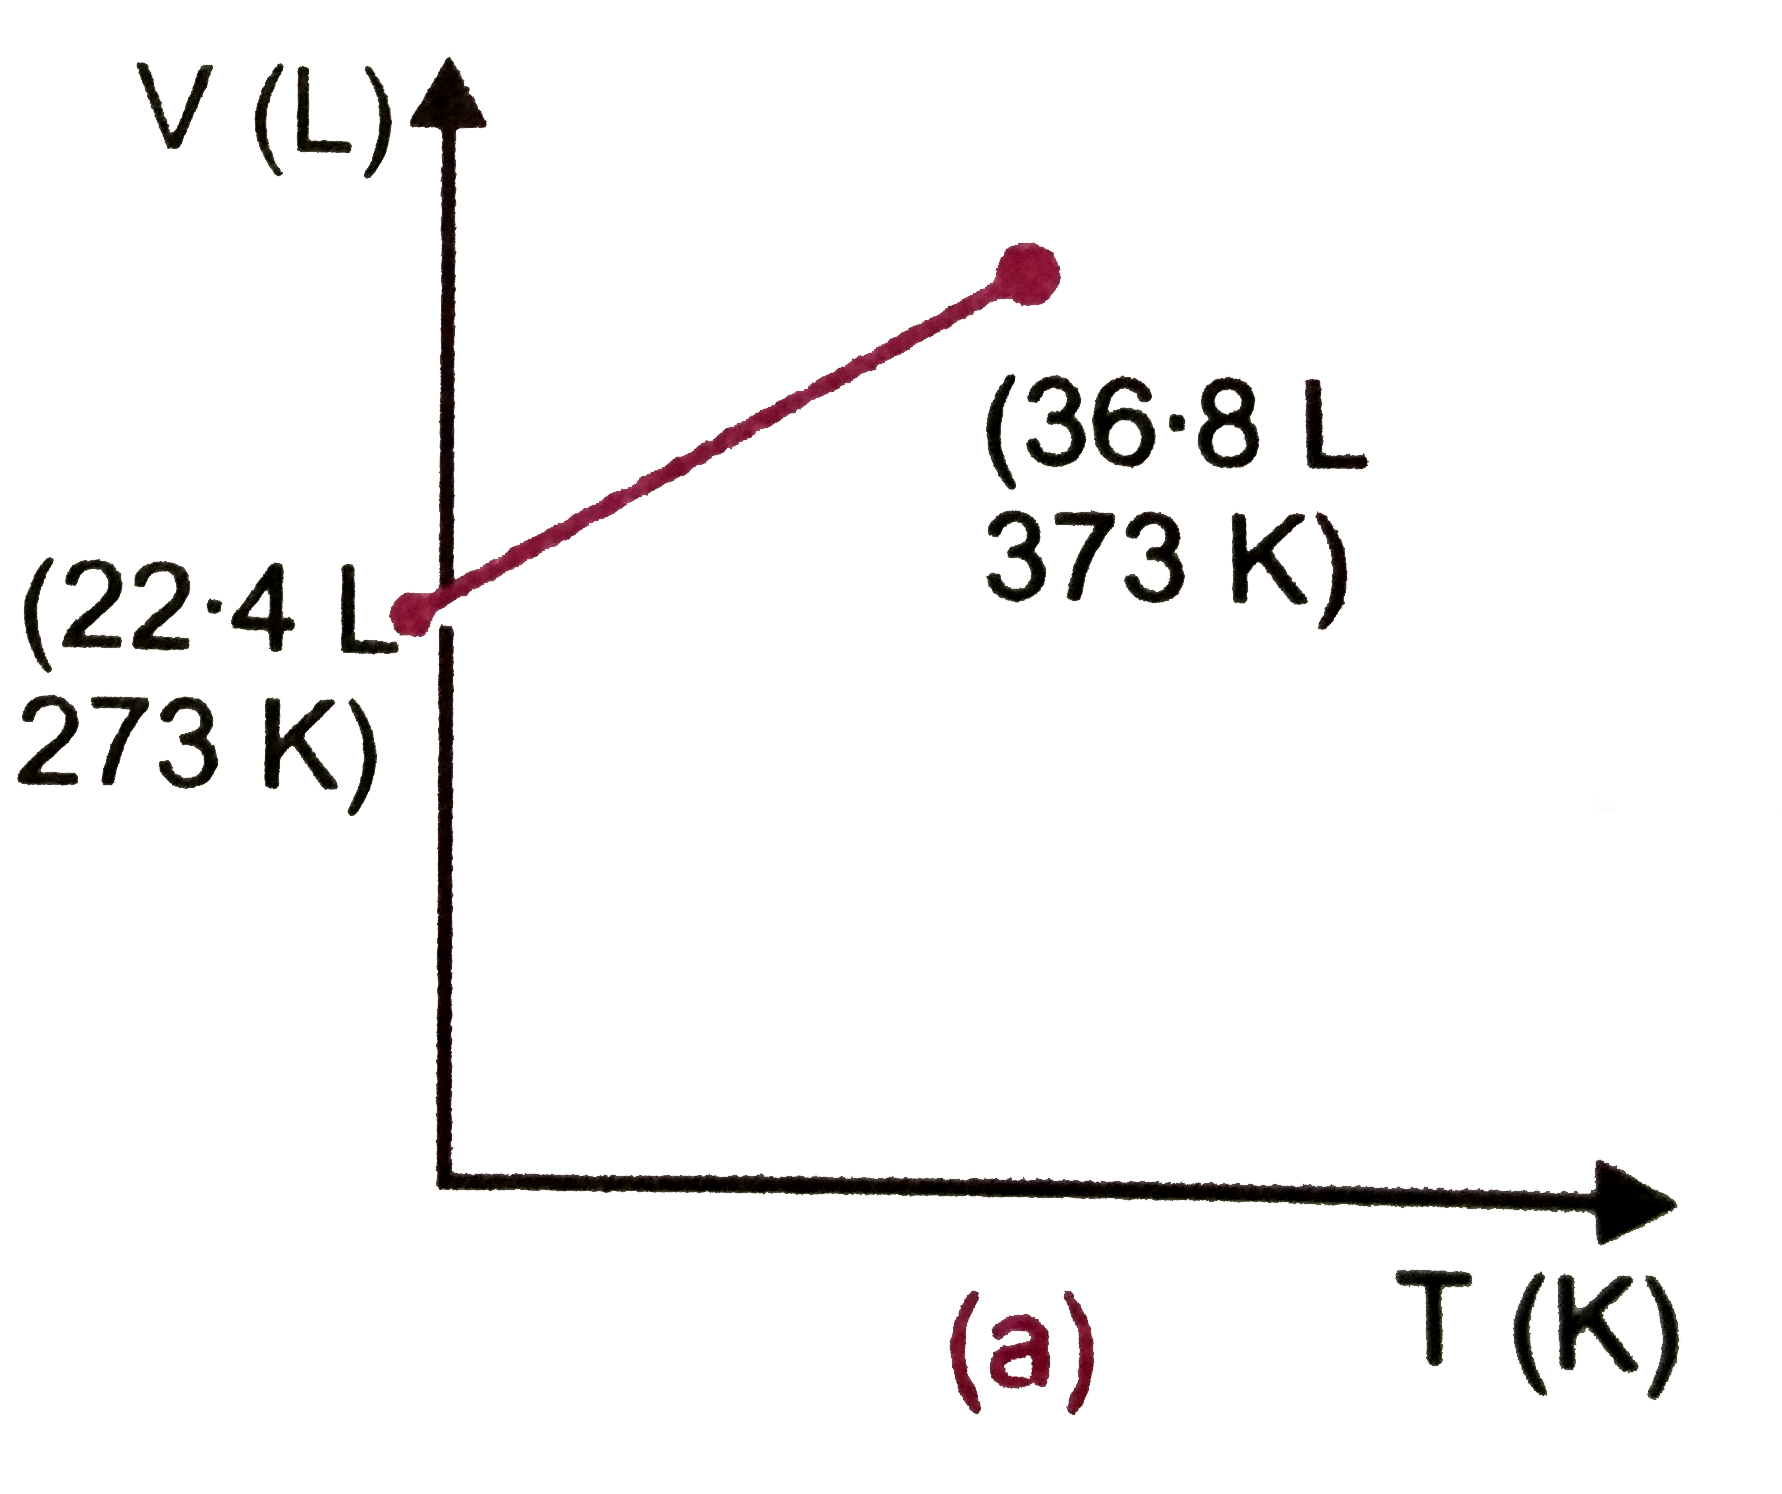 B
B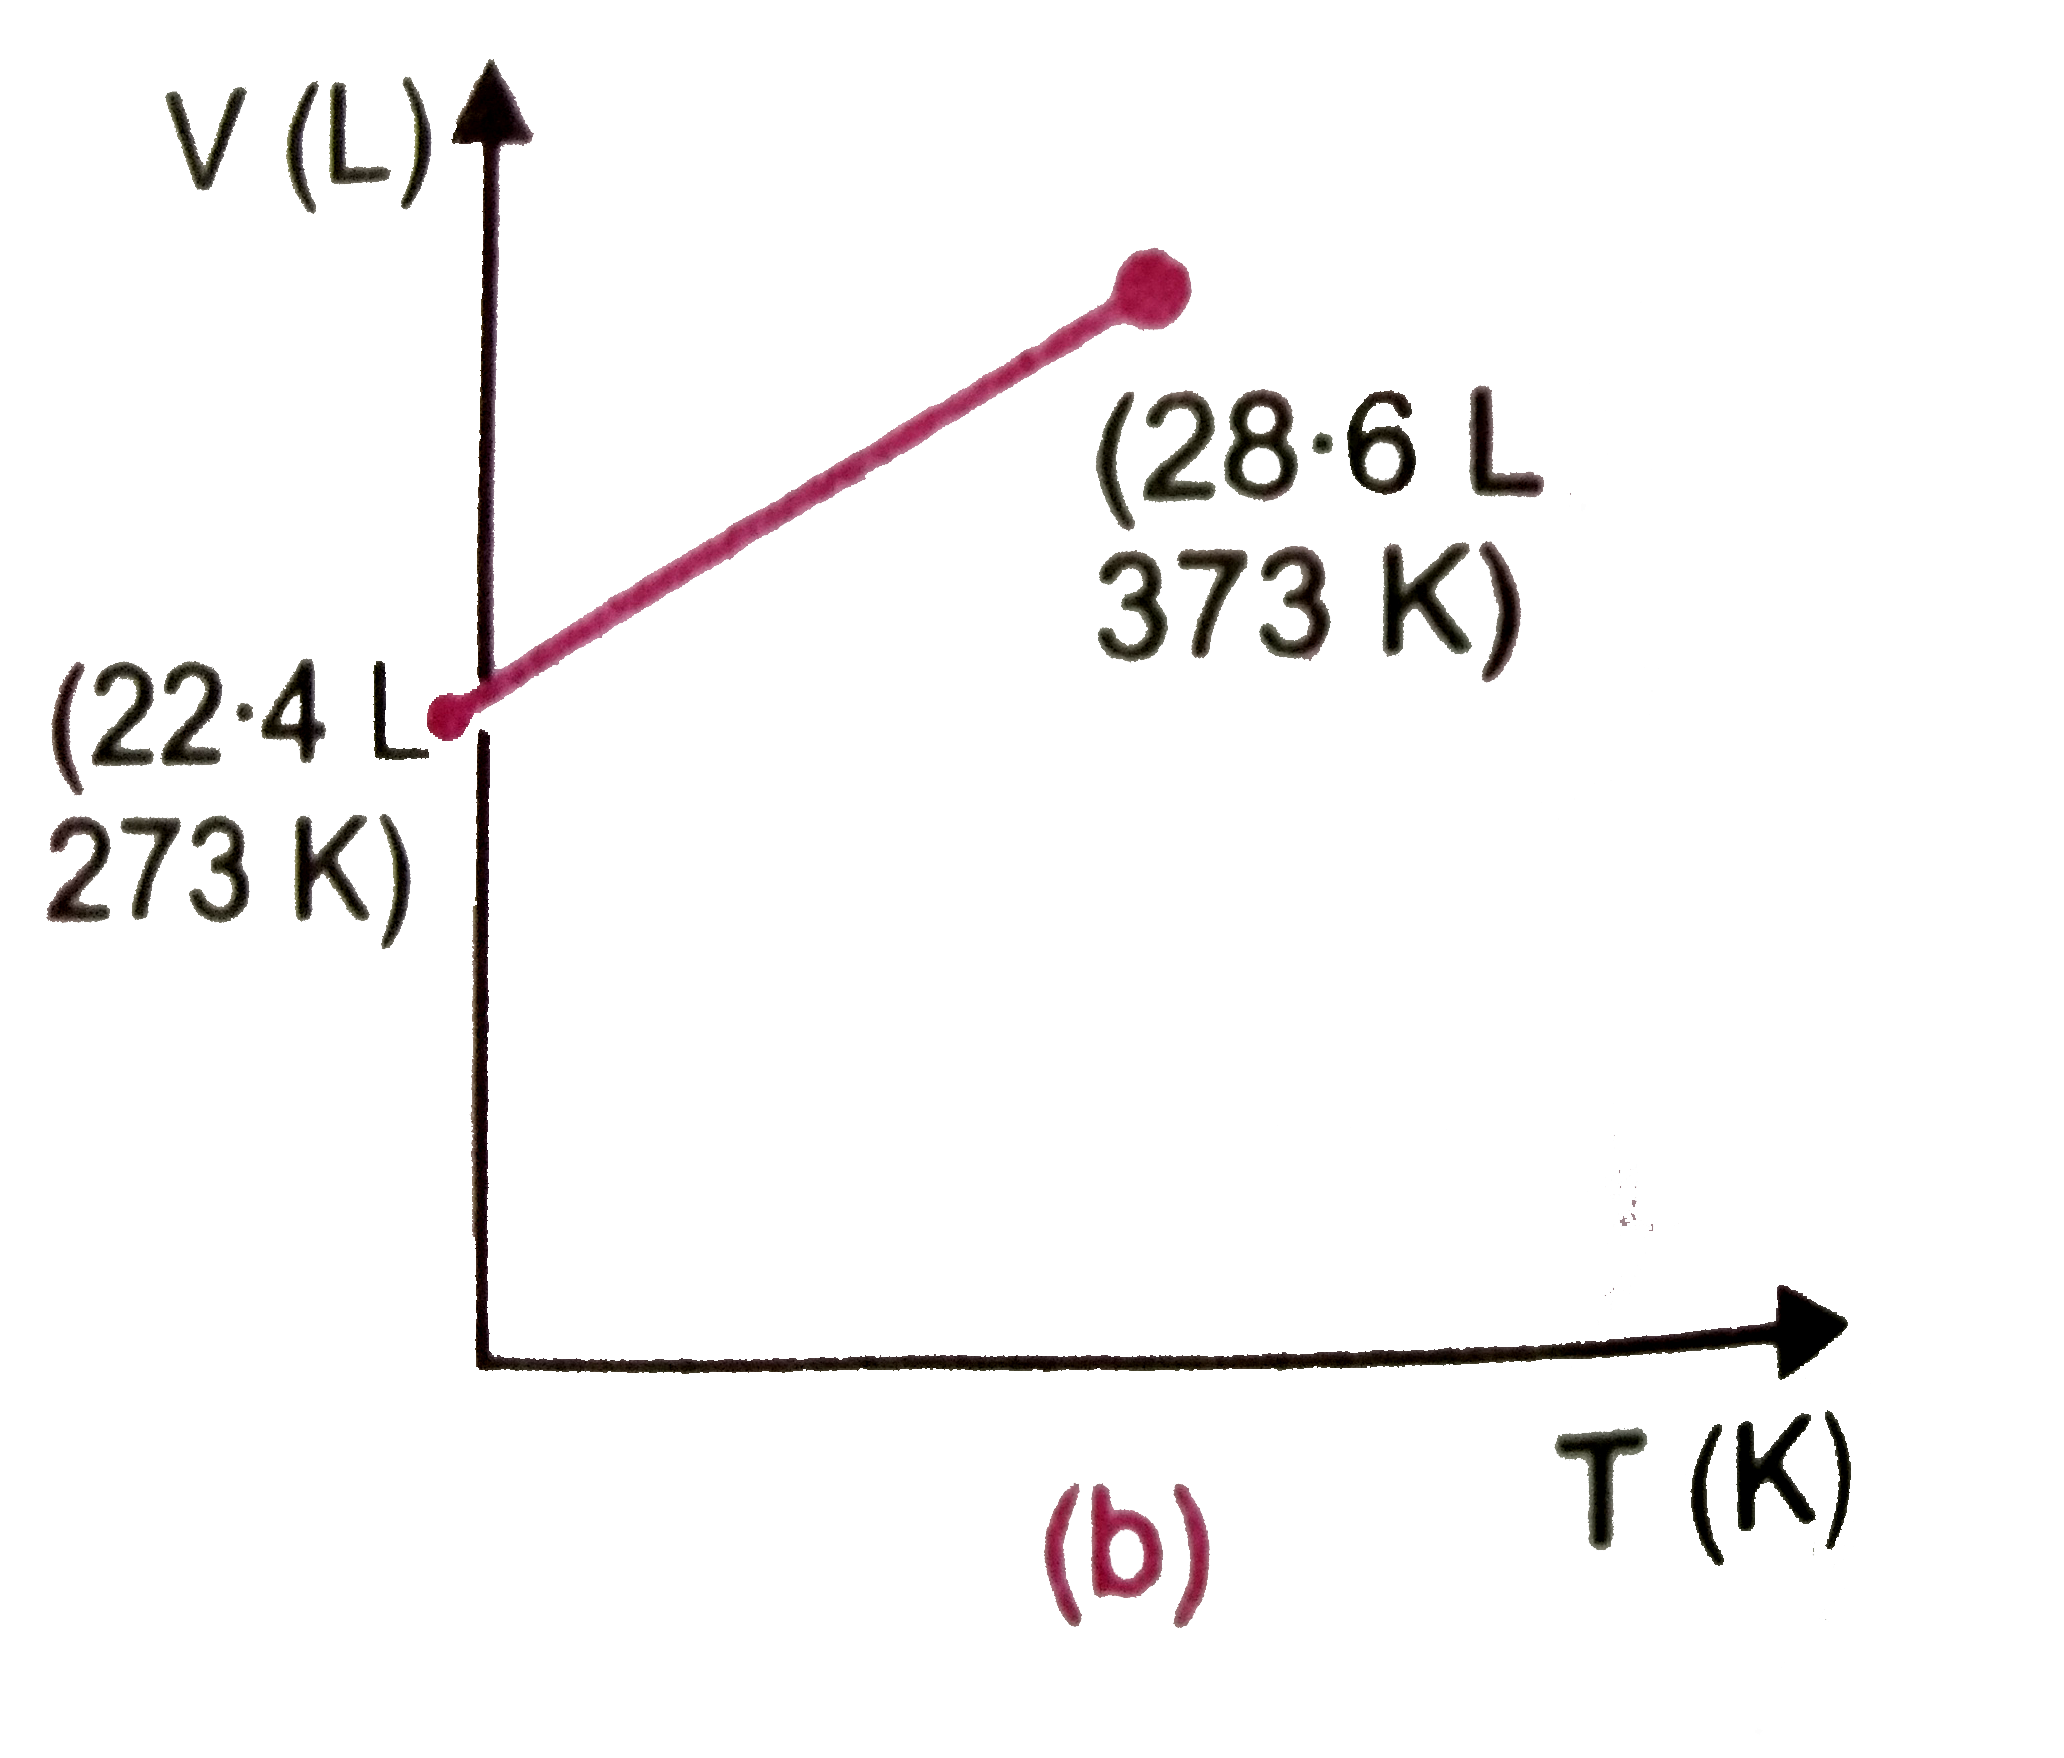 C
C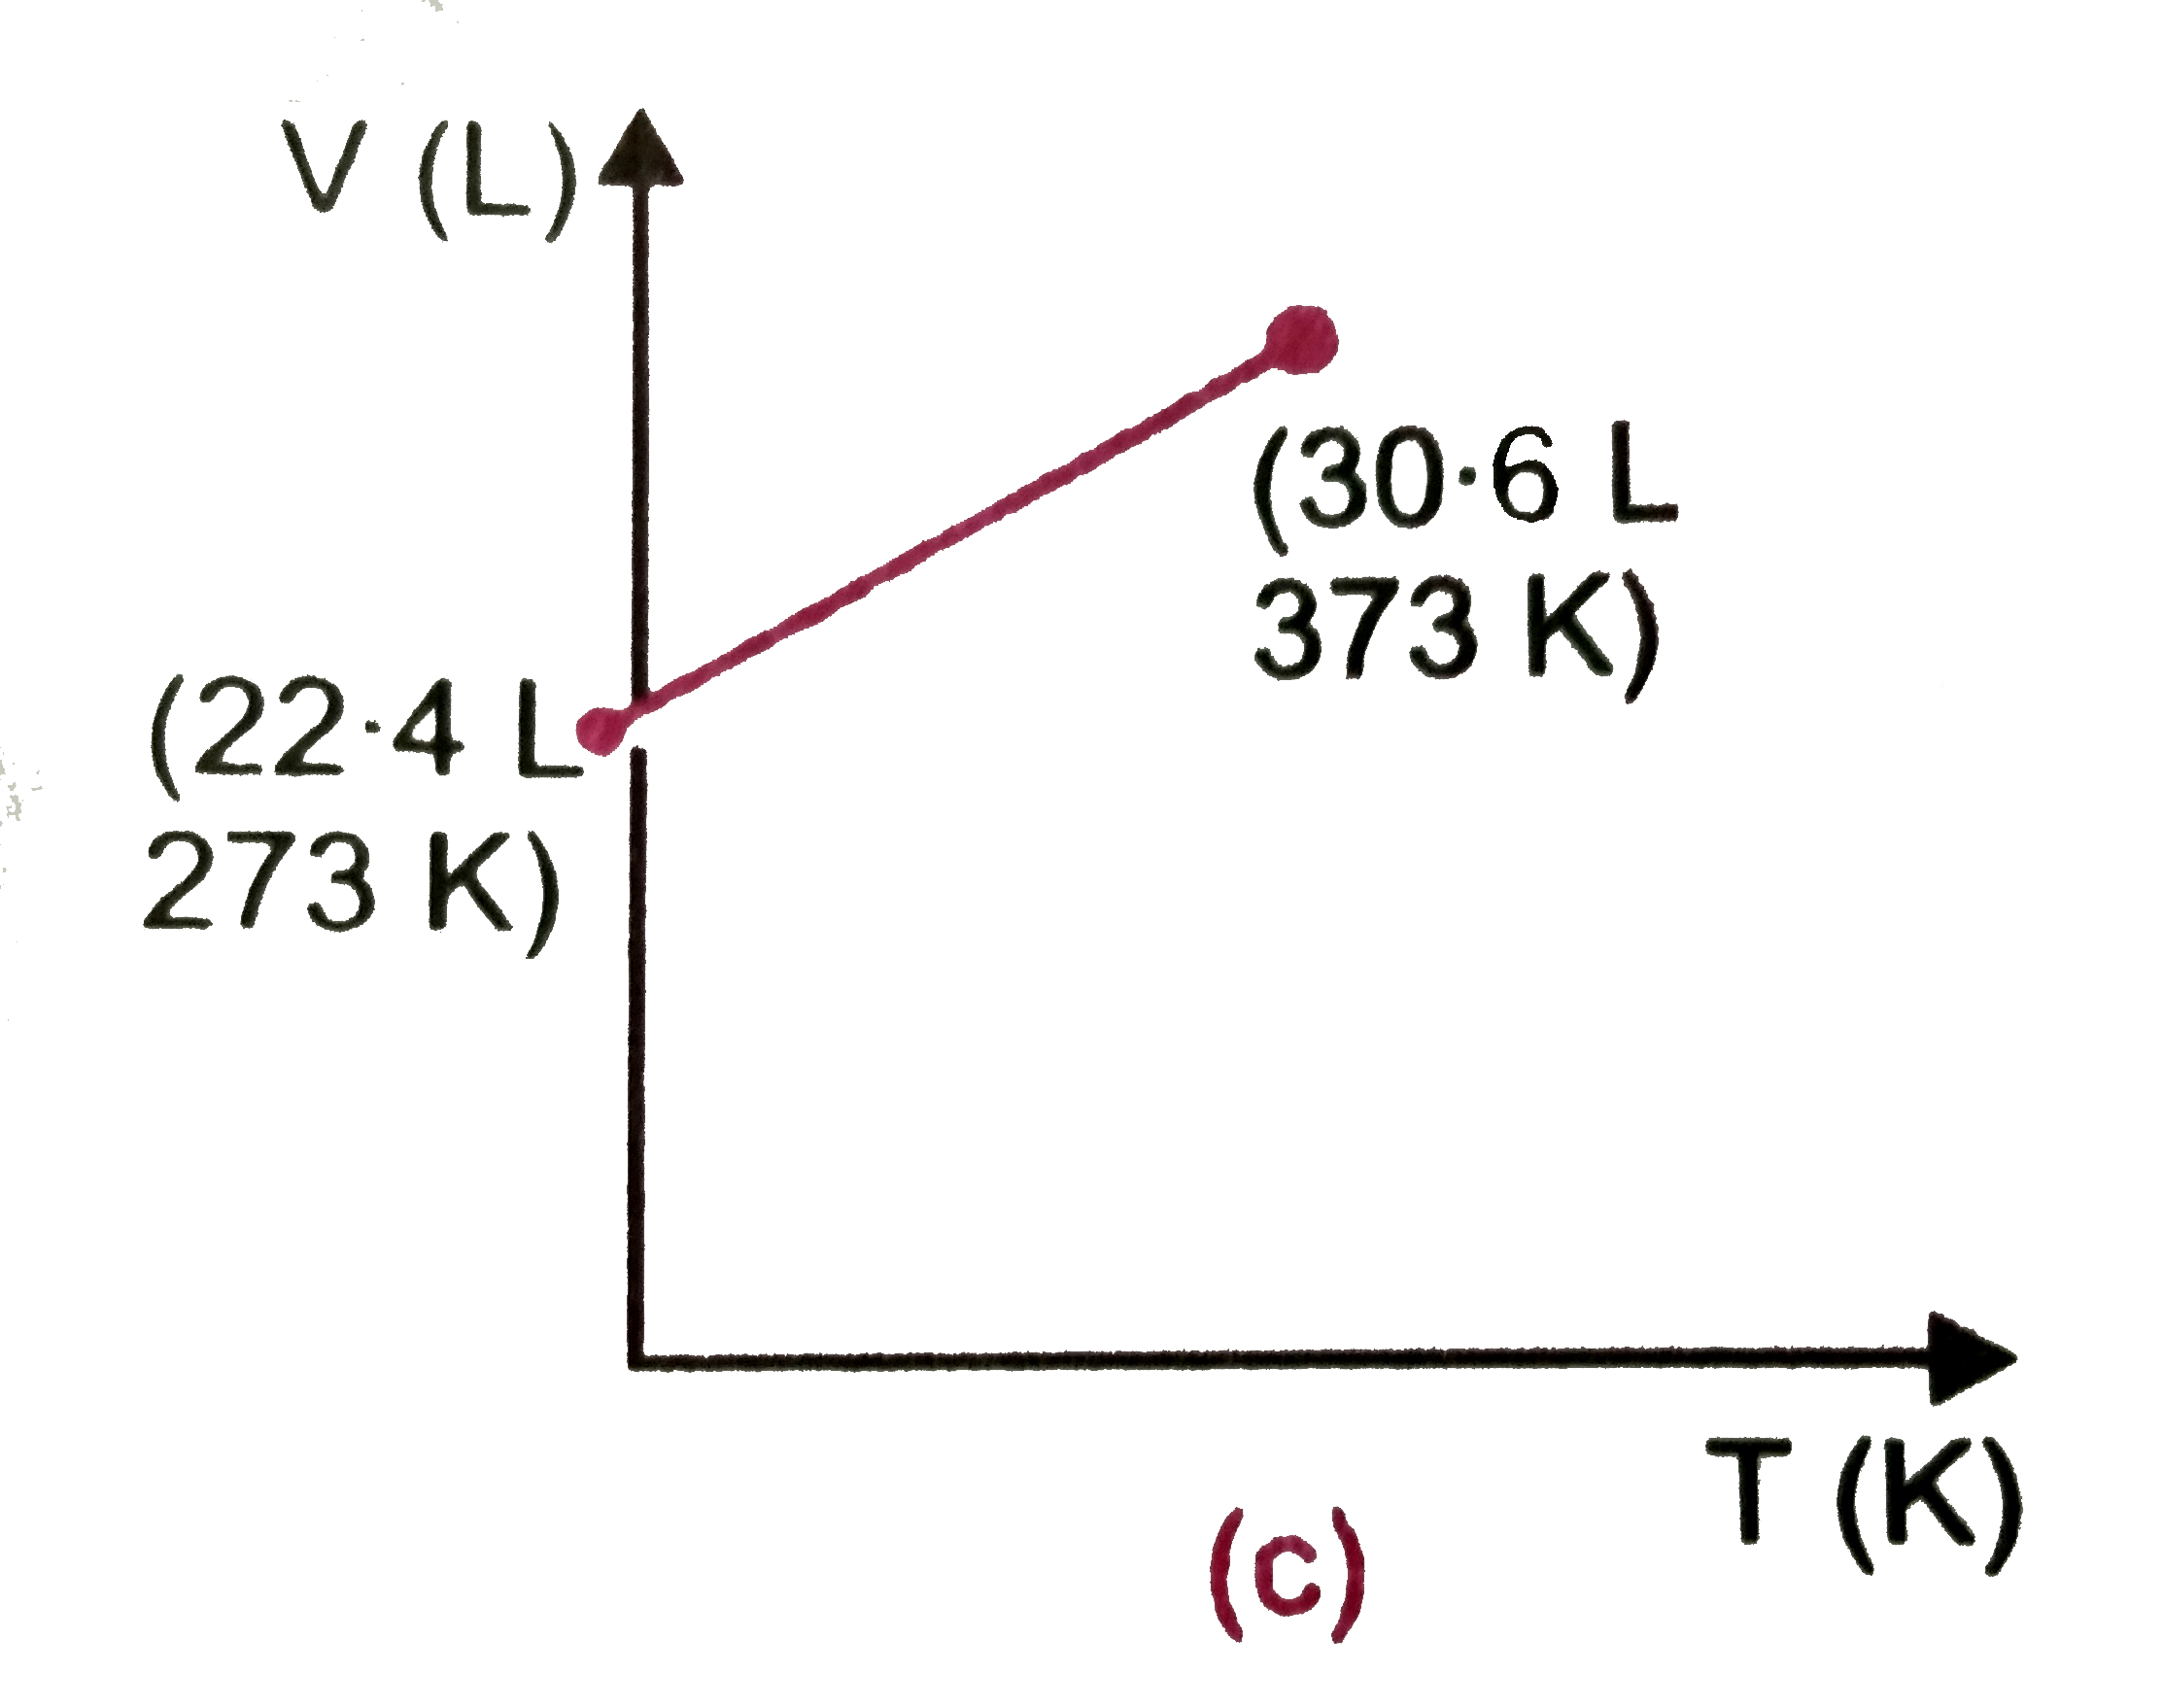 D
D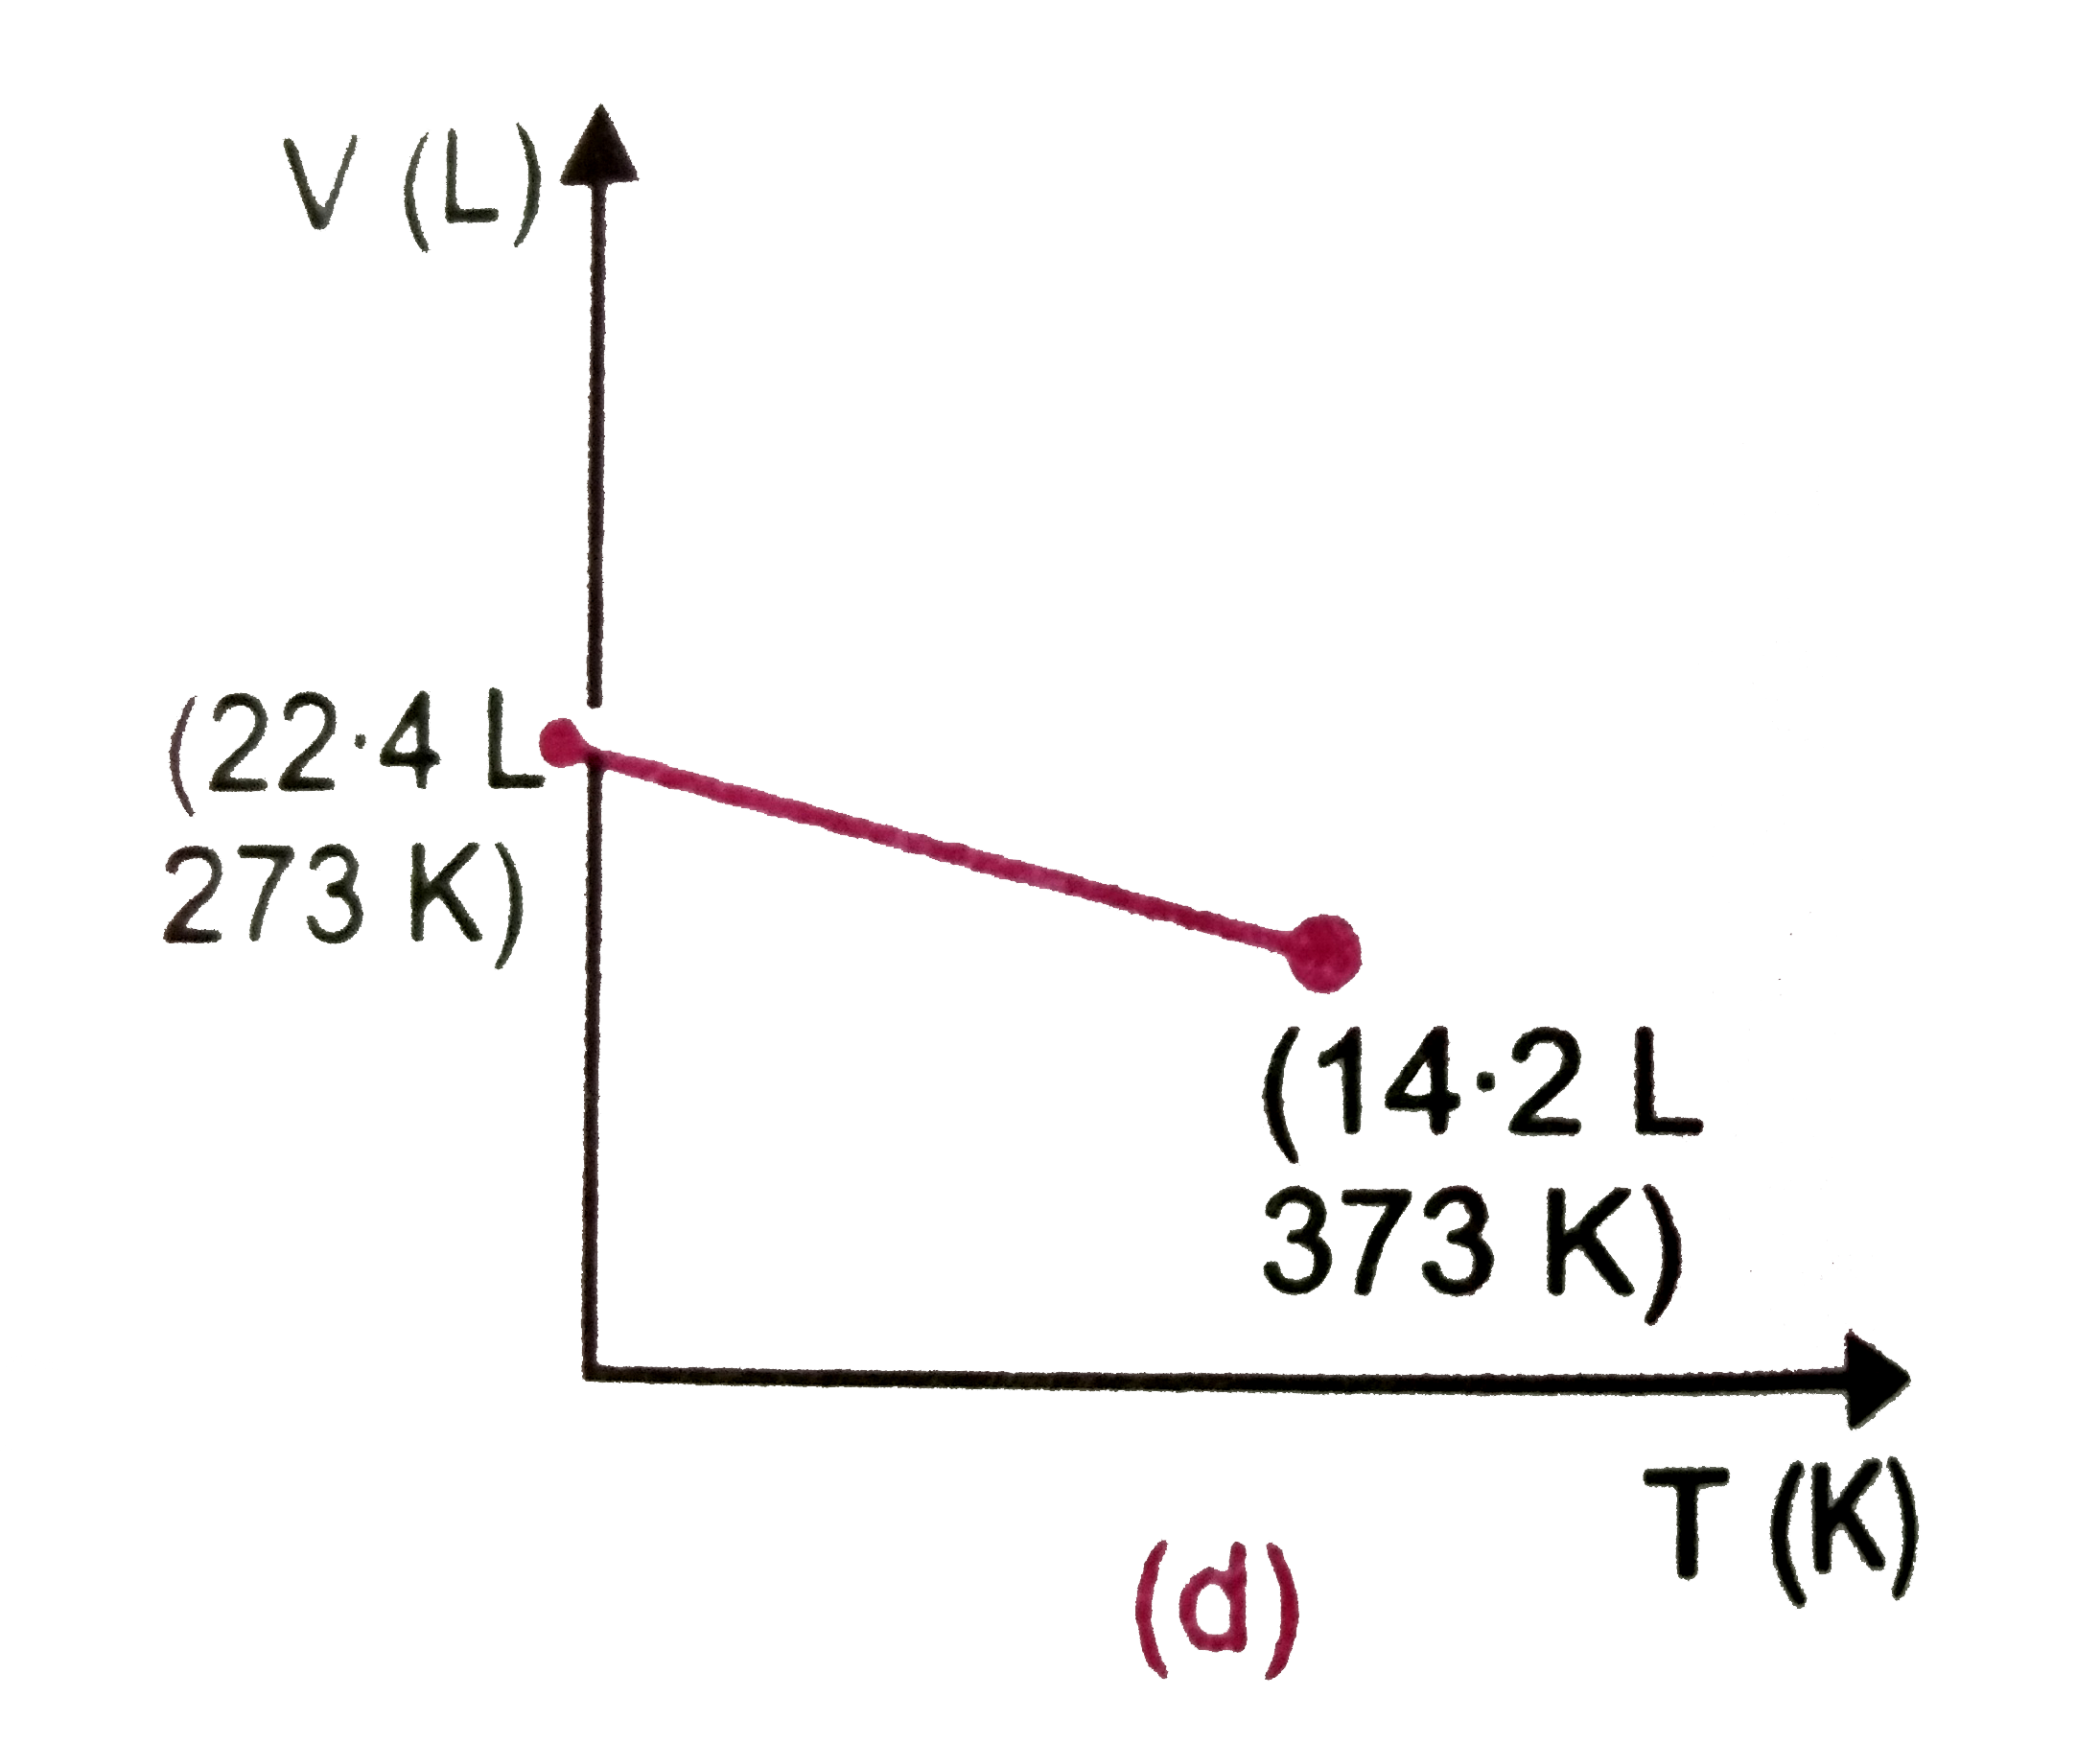
Which of the following volume (V) temperature (T) plots represents the behaviour of one mole of an ideal gas at one atmospheric pressure:
A B
B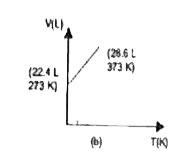 C
C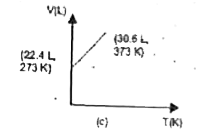 D
D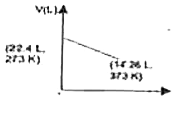
Which of the following volume-temperature (V−I) plots represents the behaviour of 1mole of an ideal gas at the atmospheric pressure?
View SolutionWhich one of the following volume (V)- temperature (T) plots represents the behaviour of one mole of an ideal gas at one atmosphere?
View SolutionThe graph that does represent the behaviour of an ideal gas is :
View SolutionWhich of the following graphs represent the behaviour of an ideal gas ?
View SolutionWhich of the following plots represents the behavior of an ideal binary liquid solution ?
View Solution
