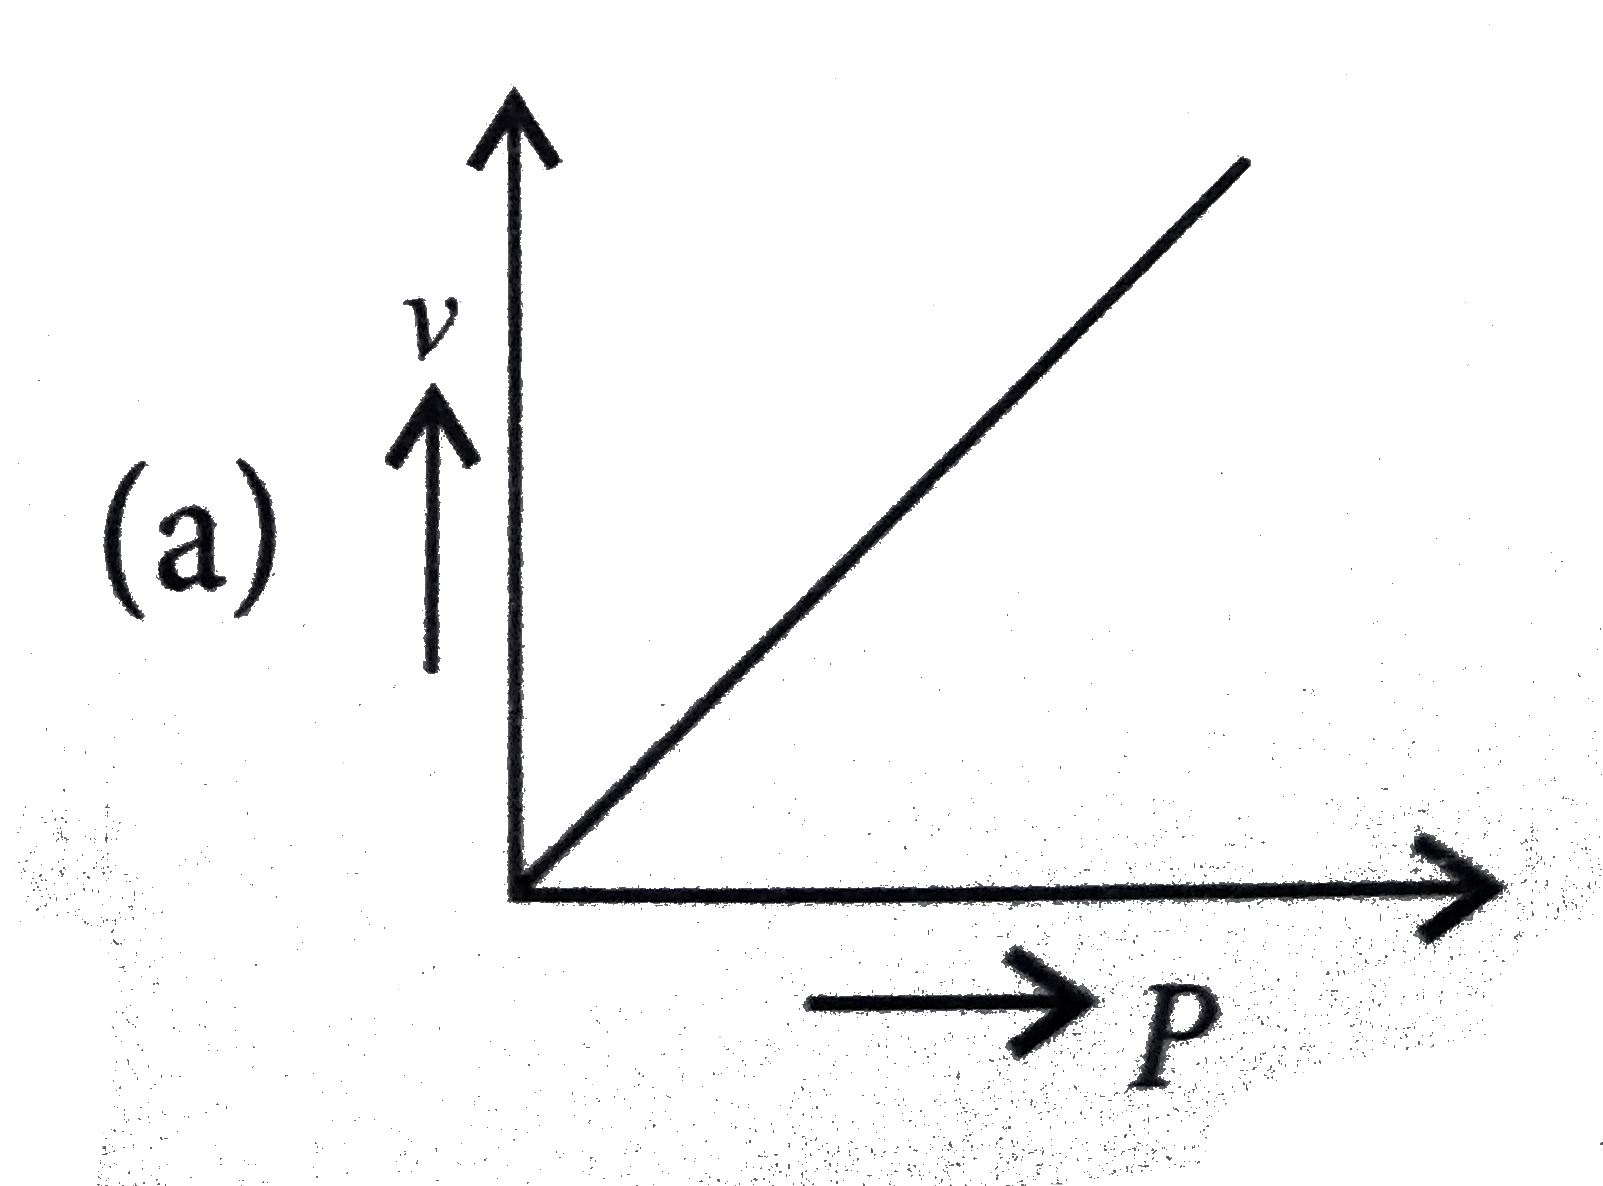
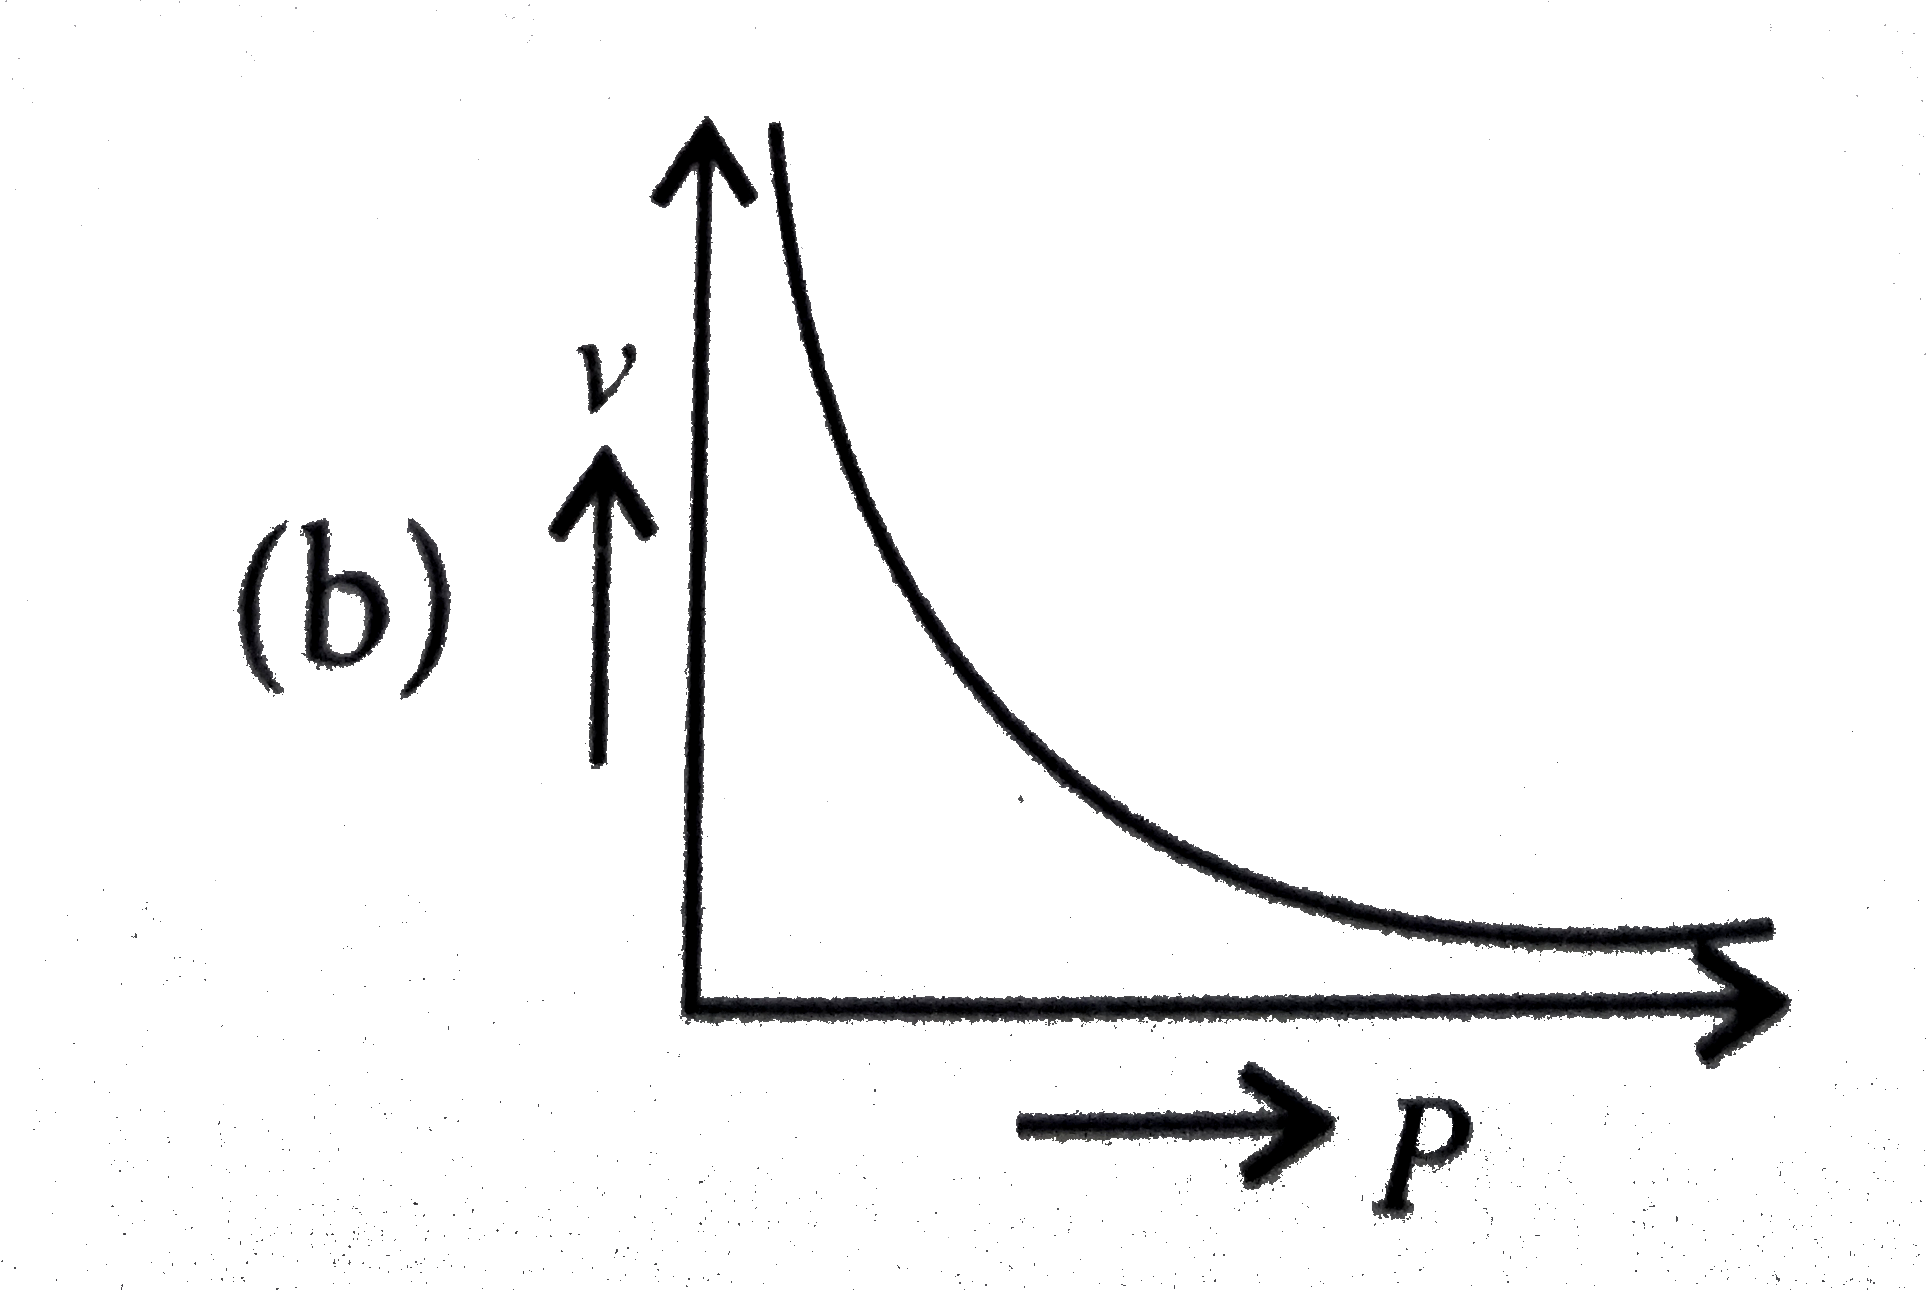
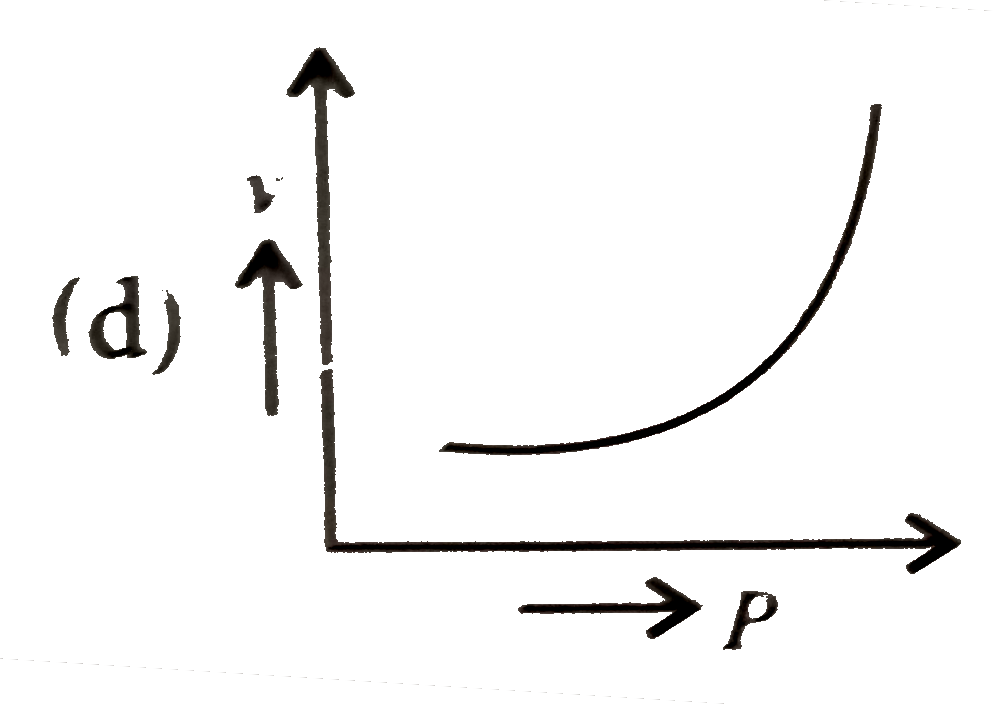
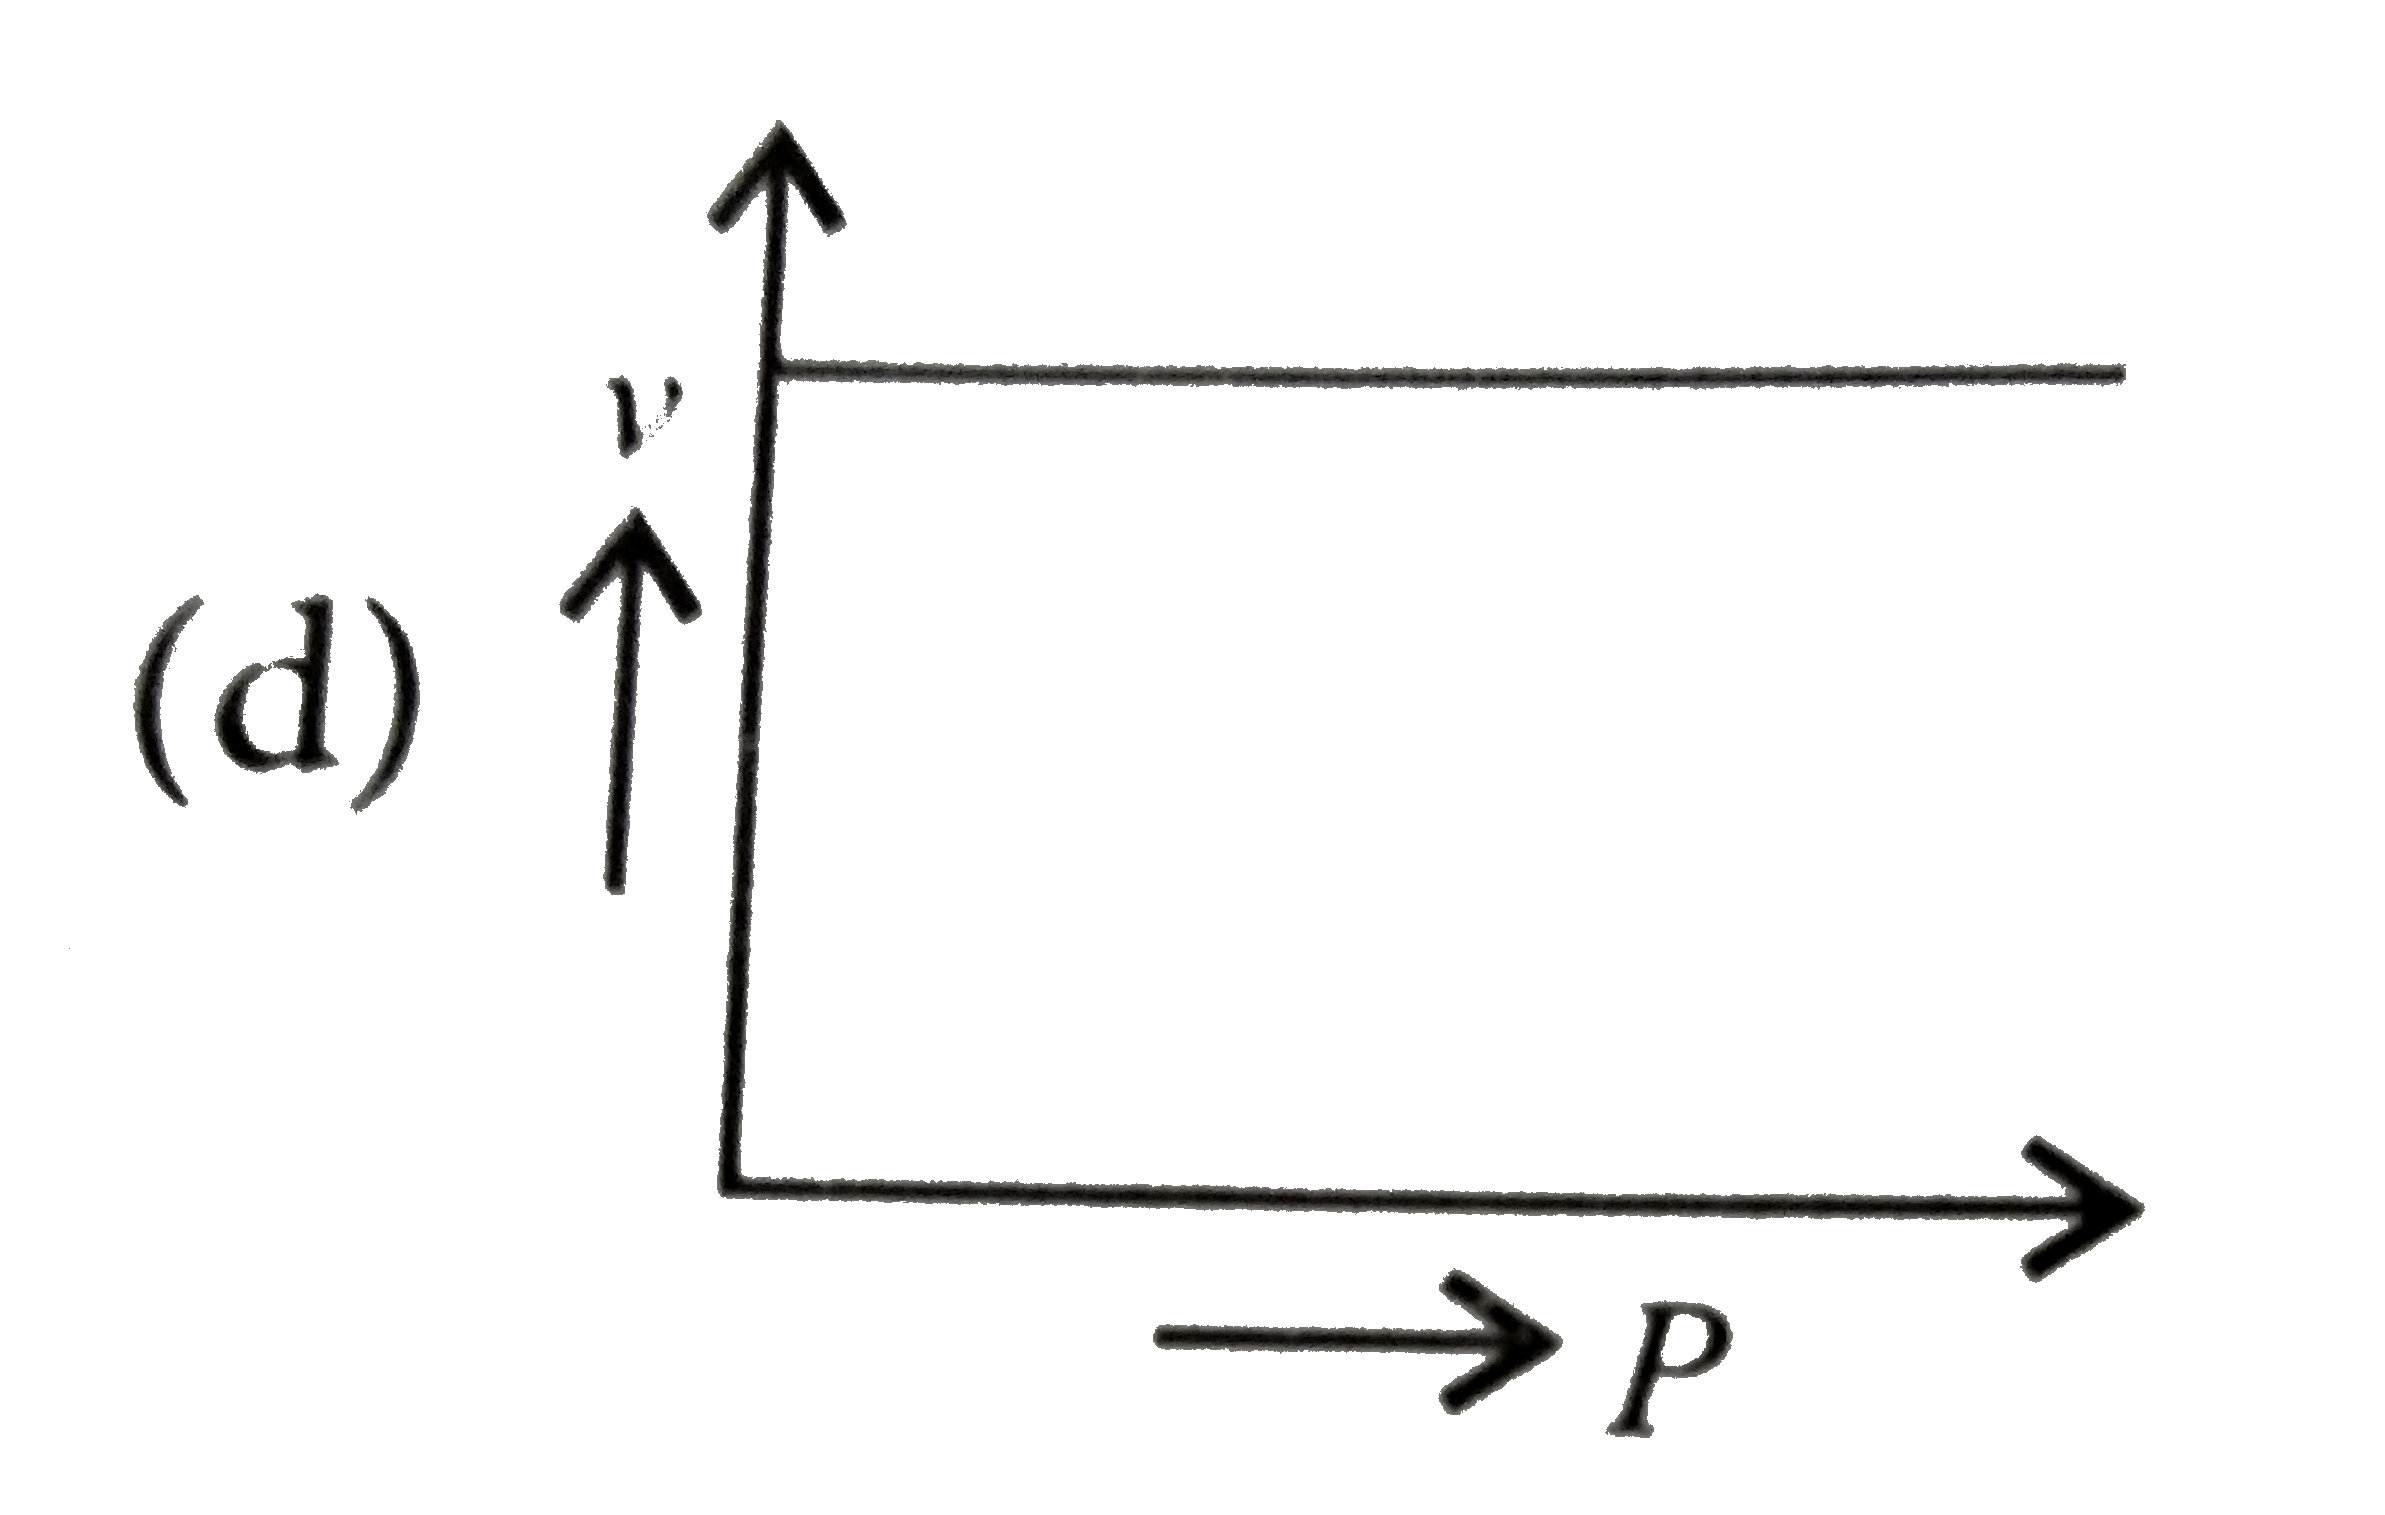
A student plotted the following four graphs representing the variation of velocity of sound in a gas with the pressure P. Which one is correct?


The correct Answer is:D
To determine the correct graph representing the variation of the velocity of sound in a gas with pressure, we need to analyze the relationship between these two variables based on the principles of physics.
1. Understanding the Variables:
- The velocity of sound in a gas is influenced by various factors, primarily temperature. The formula for the velocity of sound v in a gas is given by:
v=√γ⋅R⋅TM
where γ is the adiabatic index, R is the universal gas constant, T is the absolute temperature, and M is the molar mass of the gas.
2. Identifying the Effect of Pressure:
- When considering the effect of pressure on the velocity of sound, it is important to note that if the temperature is held constant, the pressure does not directly affect the velocity of sound. This is because, at constant temperature, the density of the gas changes with pressure, but the effect on the speed of sound is negligible.
3. Analyzing the Graphs:
- The question provides four graphs that depict the relationship between the velocity of sound and pressure. We need to identify which graph shows that the velocity remains constant regardless of changes in pressure.
4. Selecting the Correct Graph:
- The correct graph should show a horizontal line, indicating that the velocity of sound does not change with pressure when the temperature is constant. This corresponds to the idea that pressure is independent of the velocity of sound under these conditions.
5. Conclusion:
- Based on the analysis, the correct graph is the one that shows a constant velocity of sound regardless of changes in pressure. This is represented by option 4, which indicates that the velocity of sound remains uniform as pressure varies.
Final Answer:
- The correct graph representing the variation of velocity of sound in a gas with pressure is Option 4.
- The velocity of sound in a gas is influenced by various factors, primarily temperature. The formula for the velocity of sound v in a gas is given by:
v=√γ⋅R⋅TM
where γ is the adiabatic index, R is the universal gas constant, T is the absolute temperature, and M is the molar mass of the gas.
- When considering the effect of pressure on the velocity of sound, it is important to note that if the temperature is held constant, the pressure does not directly affect the velocity of sound. This is because, at constant temperature, the density of the gas changes with pressure, but the effect on the speed of sound is negligible.
- The question provides four graphs that depict the relationship between the velocity of sound and pressure. We need to identify which graph shows that the velocity remains constant regardless of changes in pressure.
- The correct graph should show a horizontal line, indicating that the velocity of sound does not change with pressure when the temperature is constant. This corresponds to the idea that pressure is independent of the velocity of sound under these conditions.
- Based on the analysis, the correct graph is the one that shows a constant velocity of sound regardless of changes in pressure. This is represented by option 4, which indicates that the velocity of sound remains uniform as pressure varies.
- The correct graph representing the variation of velocity of sound in a gas with pressure is Option 4.
Topper's Solved these Questions
- BOOK - NCERT FINGERTIPSCHAPTER - WAVESEXERCISE - The Principle Of Superposition Of Waves2videos
WAVES
- BOOK - NCERT FINGERTIPSCHAPTER - WAVESEXERCISE - Reflection Of Waves31videos
WAVES
- BOOK - NCERT FINGERTIPSCHAPTER - WAVESEXERCISE - Displacement Relation In A Progressive Wave15videos
WAVES
- BOOK - NCERT FINGERTIPSCHAPTER - UNITS AND MEASUREMENTSEXERCISE - Assertion And Reason15videos
UNITS AND MEASUREMENTS
- BOOK - NCERT FINGERTIPSCHAPTER - WORK , ENERGY AND POWEREXERCISE - Assertion And Reason15videos
WORK , ENERGY AND POWER
Similar Questions
Knowledge Check
- Question 1 - Select One
A student plotted the following four graphs representing the variation of velocity of sound in a gas with the pressure P. Which one is correct?
A B
B C
C D
D
- Question 2 - Select One
The velocity of sound in a gas at pressure P and density P
AV=√YpρBV=√PYρCV=y√pρDV=√2Pρ - Question 3 - Select One
Velocity of sound in a gas….. With increase of pressure
AincreaseBdoes not varyCdecreaseDeither 'a' or 'c' depending on the gas
Which of the following graphs represents the variation of activity (A) of a radioactive substance with time (t).
View SolutionWhich of the following graphs represent the behaviour of an ideal gas ?
View SolutionWhich of the following graph represents the variation of amount of chemisorption of a gas by a solid with temperature under constant pressure?
View SolutionWhich of the following graphs best represents the variation of acceleration 'a' with displacement x?
View SolutionAt a constant pressure, of the following graphs that one which represents the variation of the density of an ideal gas with the absolute temperature T, is
View Solution

