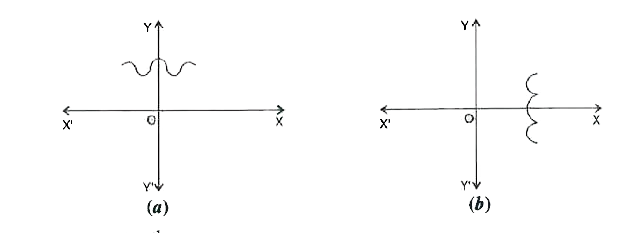
Which of the following graphs best represents the variation of acceleration 'a' with displacement x?
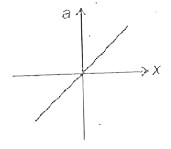

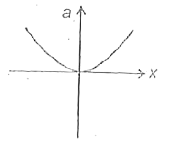

The correct Answer is:B
Step by step video, text & image solution for Which of the following graphs best represents the variation of acceleration 'a' with displacement x? by Physics experts to help you in doubts & scoring excellent marks in Class 12 exams.
Topper's Solved these Questions
- BOOK - AAKASH INSTITUTECHAPTER - OSCILLATIONSEXERCISE - Assignment (Section - B) (OBJECTIVE TYPE QUESTIONS)30videos
OSCILLATIONS
- BOOK - AAKASH INSTITUTECHAPTER - OSCILLATIONSEXERCISE - Assignment (Section C) (PREVIOUS YEARS QUESTIONS)43videos
OSCILLATIONS
- BOOK - AAKASH INSTITUTECHAPTER - OSCILLATIONSEXERCISE - Exercise20videos
OSCILLATIONS
- BOOK - AAKASH INSTITUTECHAPTER - NUCLEIEXERCISE - ASSIGNMENT (SECTION-D)10videos
NUCLEI
- BOOK - AAKASH INSTITUTECHAPTER - PHYSICAL WORLDEXERCISE - ASSIGNMENT (Section-B)5videos
PHYSICAL WORLD
Similar Questions
Knowledge Check
- Question 1 - Select One
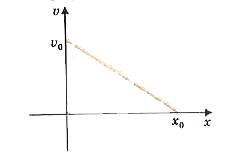
The velocity -displacement graph of a particle is as shown in the figure. Which of the following graphs correctly represents the variation of acceleration with displacement?
 A
A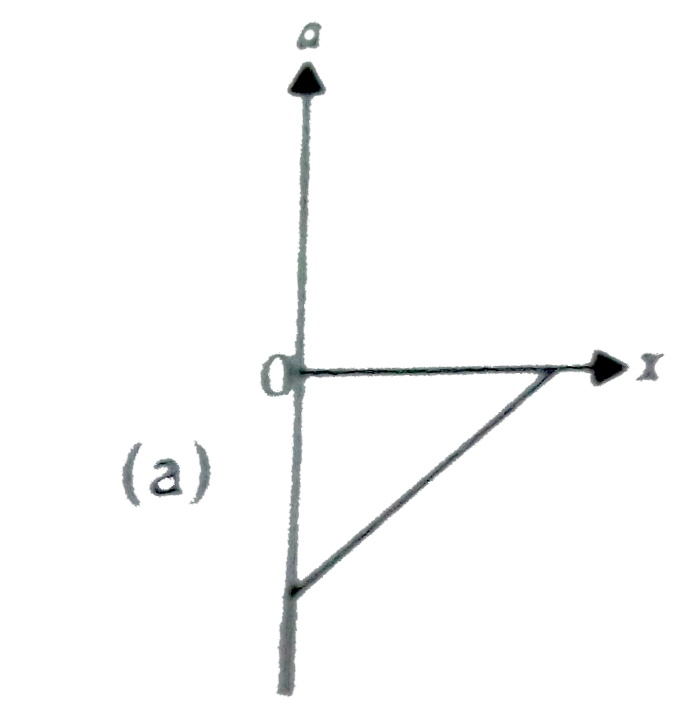 B
B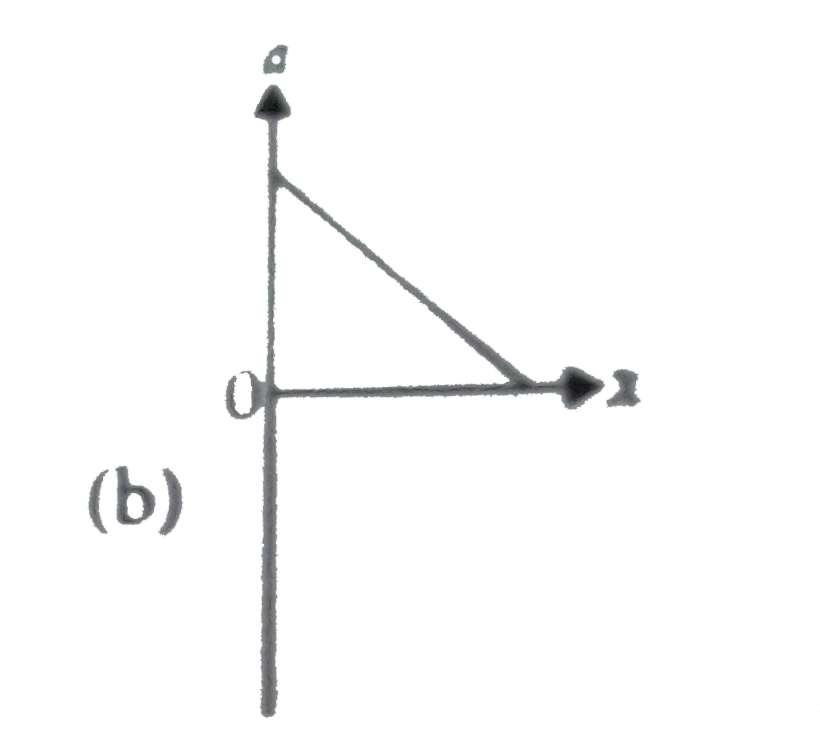 C
C D
D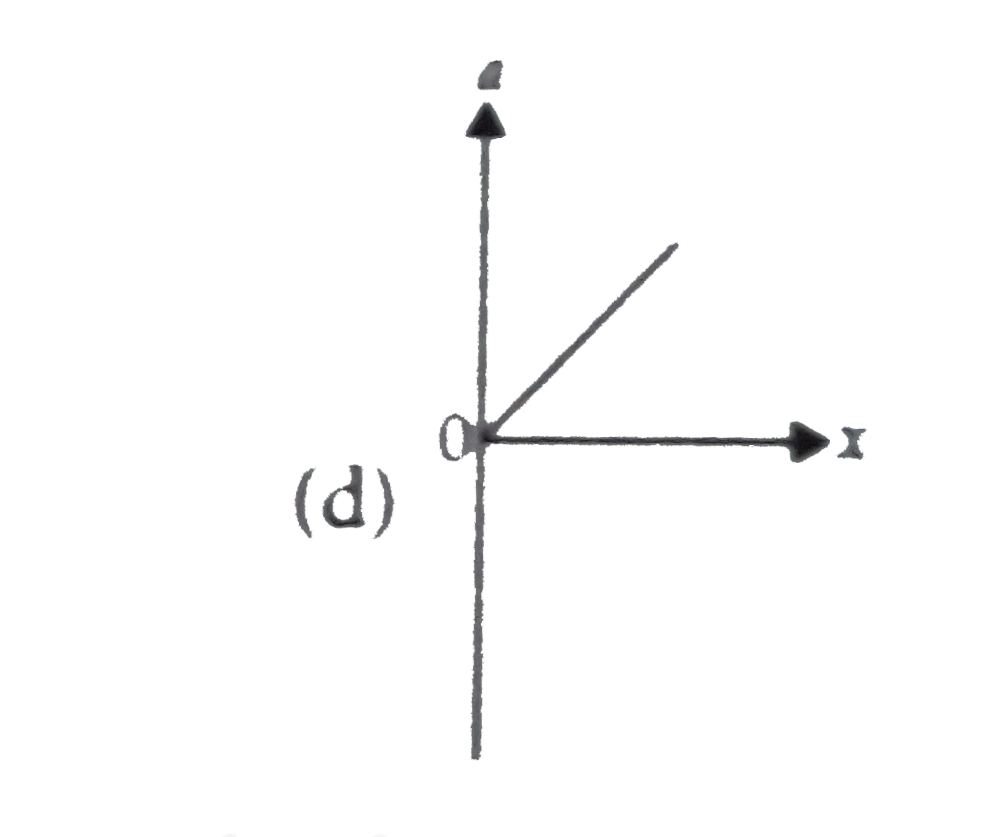
- Question 2 - Select One
Graph between velocity and displacement is shown in the following figure:
Which of the following graphes represents the correct variation of acceleration with displacementA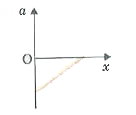 B
B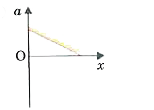 C
C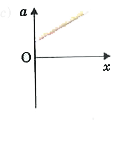 Dnone
Dnone - Question 3 - Select One
Which of the following graph represents e−x?
A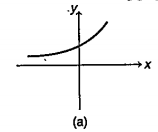 B
B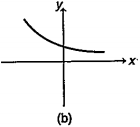 C
C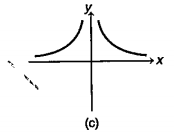 D
D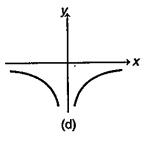
The velocity v of a particle moving along x - axis varies with ist position (x) as v=α√x, where α is a constant. Which of the following graph represents the variation of its acceleration (a) with time (t)?
View SolutionThe graph shown the variation with times t of the velocity v of an object . Which one of the following graphs best represents the variation of acceleration a of the object with time t?
 View Solution
Which of the following graph represents e−x?
View SolutionThe oscillationof a body on a smooth horizontal surface is represented by the equation
x=Acosωt
where x= displacement at time t, ω= frequency of oscillation. Which one of the following graphs shows correctly the variation of acceleration a with time t ?View SolutionWhich of the following graph represents e−x?
View Solution


