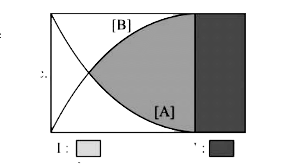
In the graphical representation for the reaction:
A→B there are two types of regions. What do these regions specify?

Text Solution
the region (I) represent the kinetic region indicating the progress of the reaction I the forward and also in the backward directions. The region (ii) depicts the equilibrium region.
|
Topper's Solved these Questions
- CHEMICAL KINETICSBOOK - DINESH PUBLICATIONCHAPTER - CHEMICAL KINETICSEXERCISE - Multiple Choice Questions
32 Videos
- CHEMICAL KINETICSBOOK - DINESH PUBLICATIONCHAPTER - CHEMICAL KINETICSEXERCISE - Multiple type questions
4 Videos
- CHEMICAL KINETICSBOOK - DINESH PUBLICATIONCHAPTER - CHEMICAL KINETICSEXERCISE - Qestions from board examinations
97 Videos
- CHEMICAL BONDING AND MOLECULAR STRUCTUREBOOK - DINESH PUBLICATIONCHAPTER - CHEMICAL BONDING AND MOLECULAR STRUCTUREEXERCISE - Unit Test - 1
20 Videos
- CHEMICAL THERMODYNAMICS AND CHEMICAL ENERGETICS BOOK - DINESH PUBLICATIONCHAPTER - CHEMICAL THERMODYNAMICS AND CHEMICAL ENERGETICS EXERCISE - Exercise
507 Videos
Similar Questions
Knowledge Check
In the following graphical representation for the reaction A→B there are two types of regions :
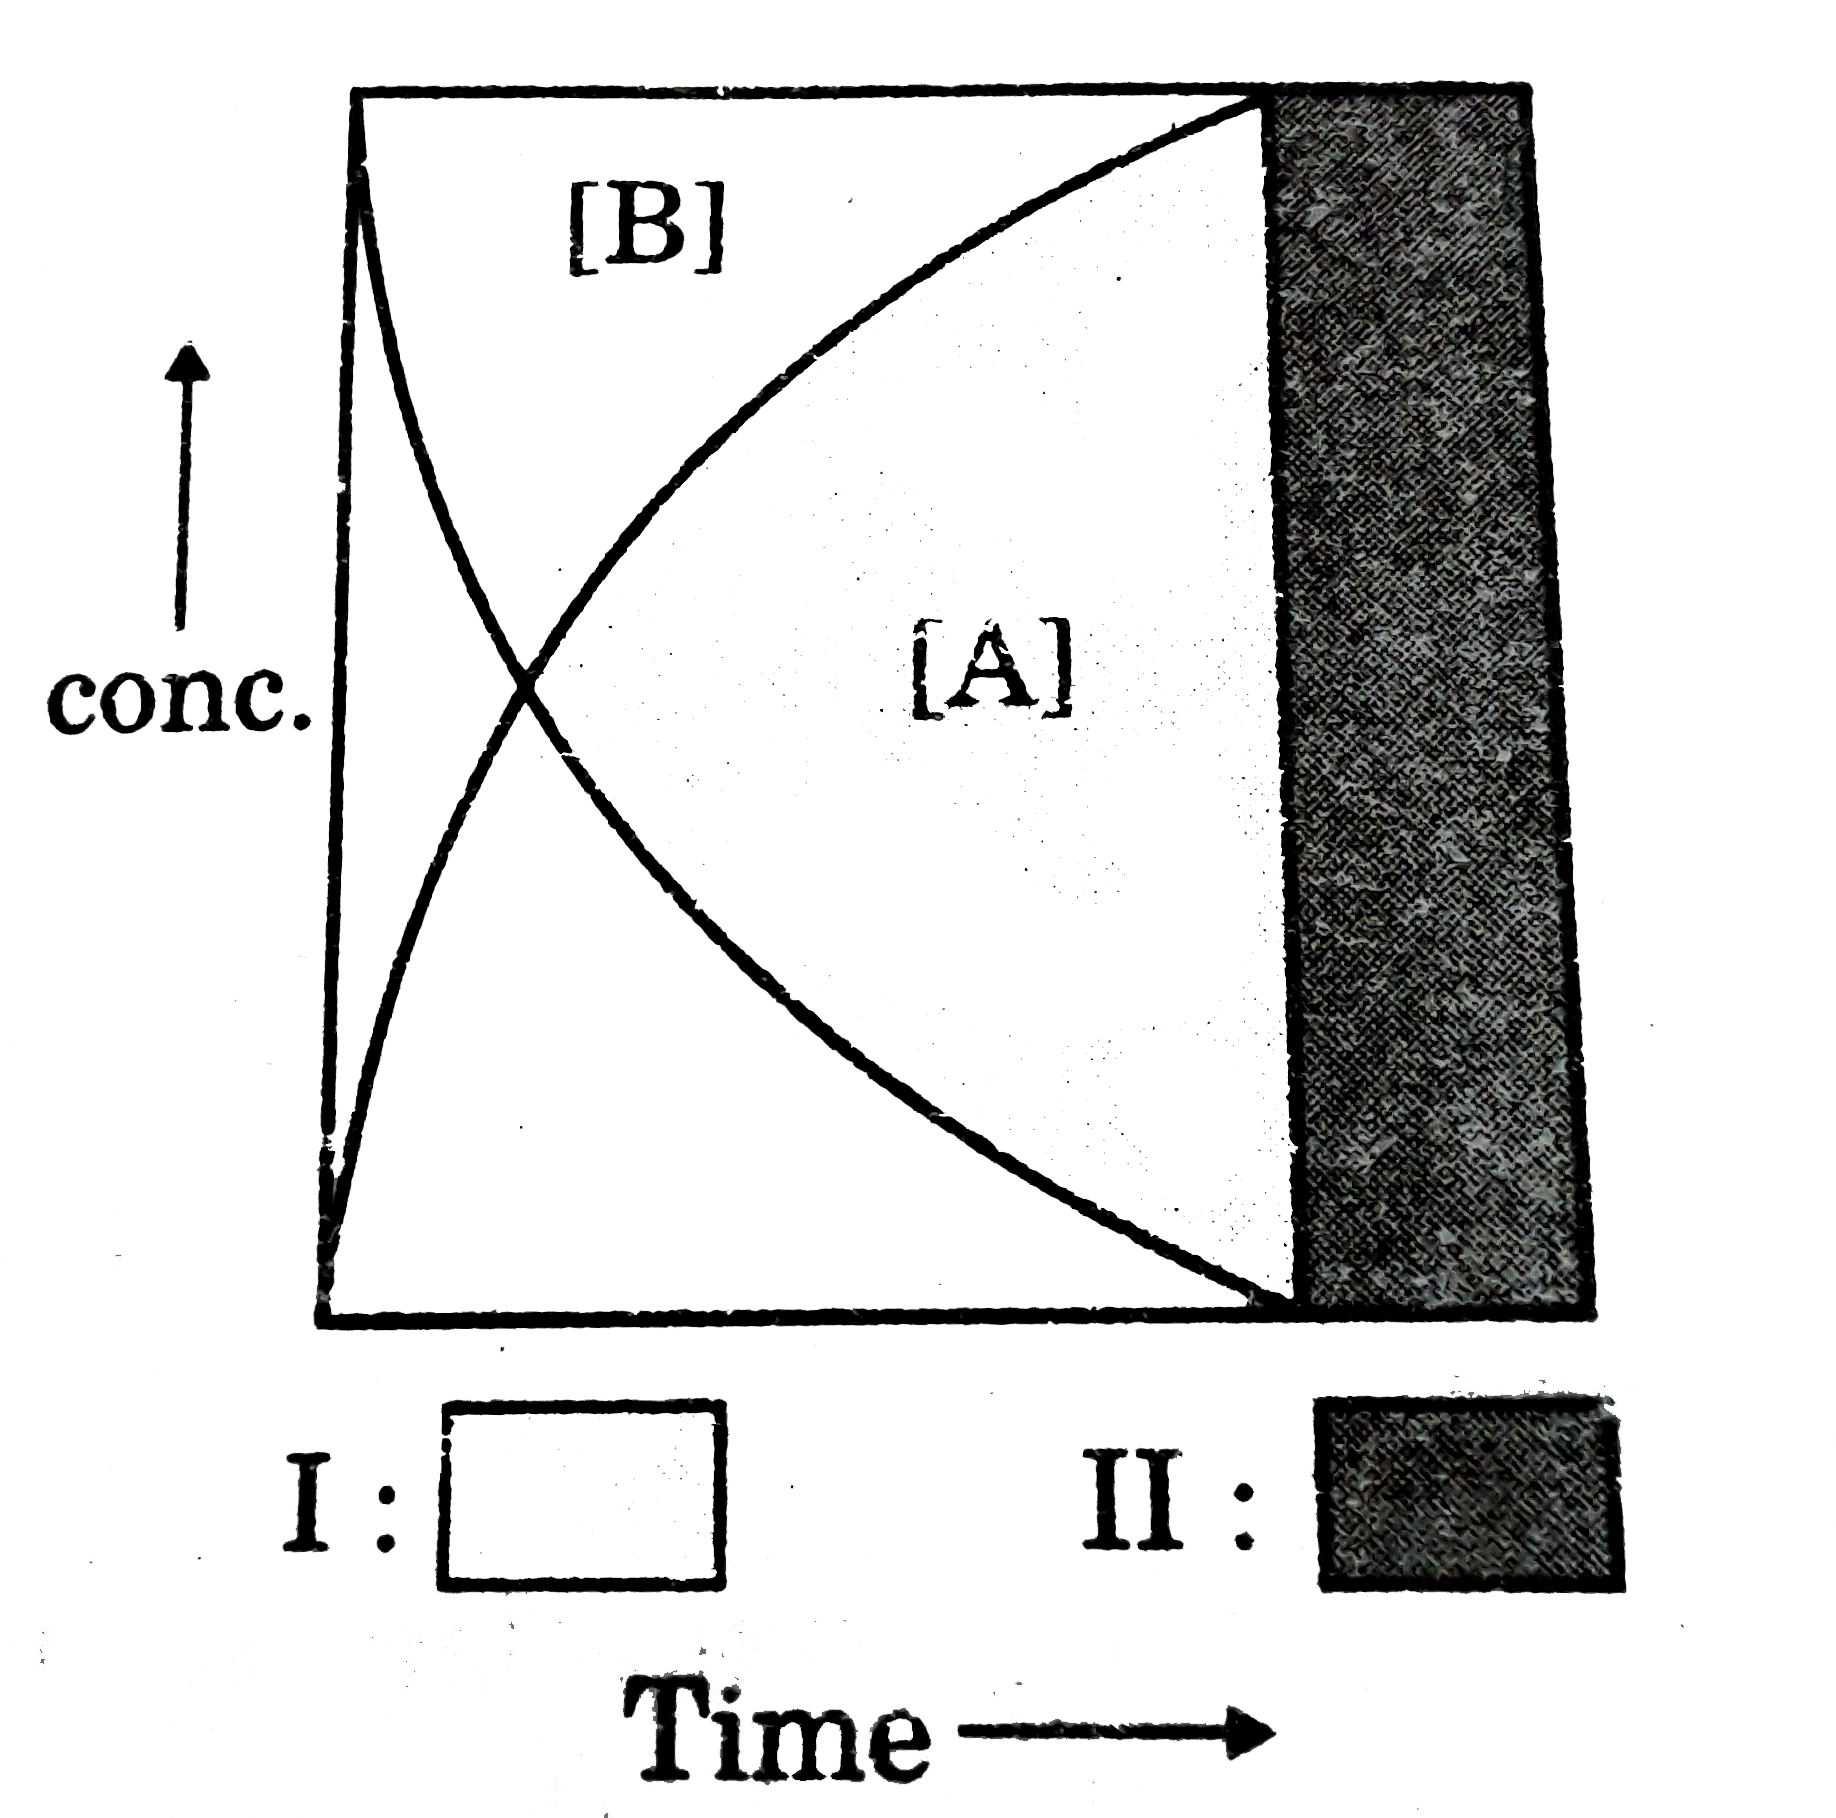 AI and II both represents kinetic region at different intervalBI and II both represents equilibrium regions at different time intervalCI represents kinetic while II represents equilibrium regionDI represents equilibrium while II represents kinetic regions
Which is not the graphical representation for the zeroth order reaction ?
A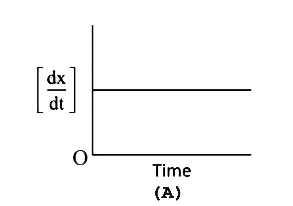 B
B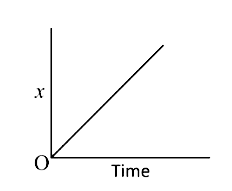 C
C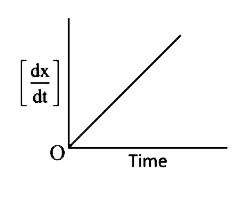 D
D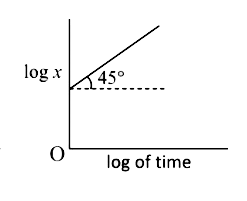
Telangana region represents one of the following types of vegetation ?
ATropical deciduousBThornCTropical ever greenDSub-tropical decidual
Which is not the graphical representation for the zeroth order reaction ?
View SolutionExplain graphical representations of the first order reaction.
View SolutionName two types of vegetation found in the region east of easting 93.
View SolutionWhat are the two regions of the solar system?
View Solution[A]: Growth curve is the graphic representation of the total growth against time.
[R]: Population growth curves are of two types-J shaped and S shaped
View Solution

