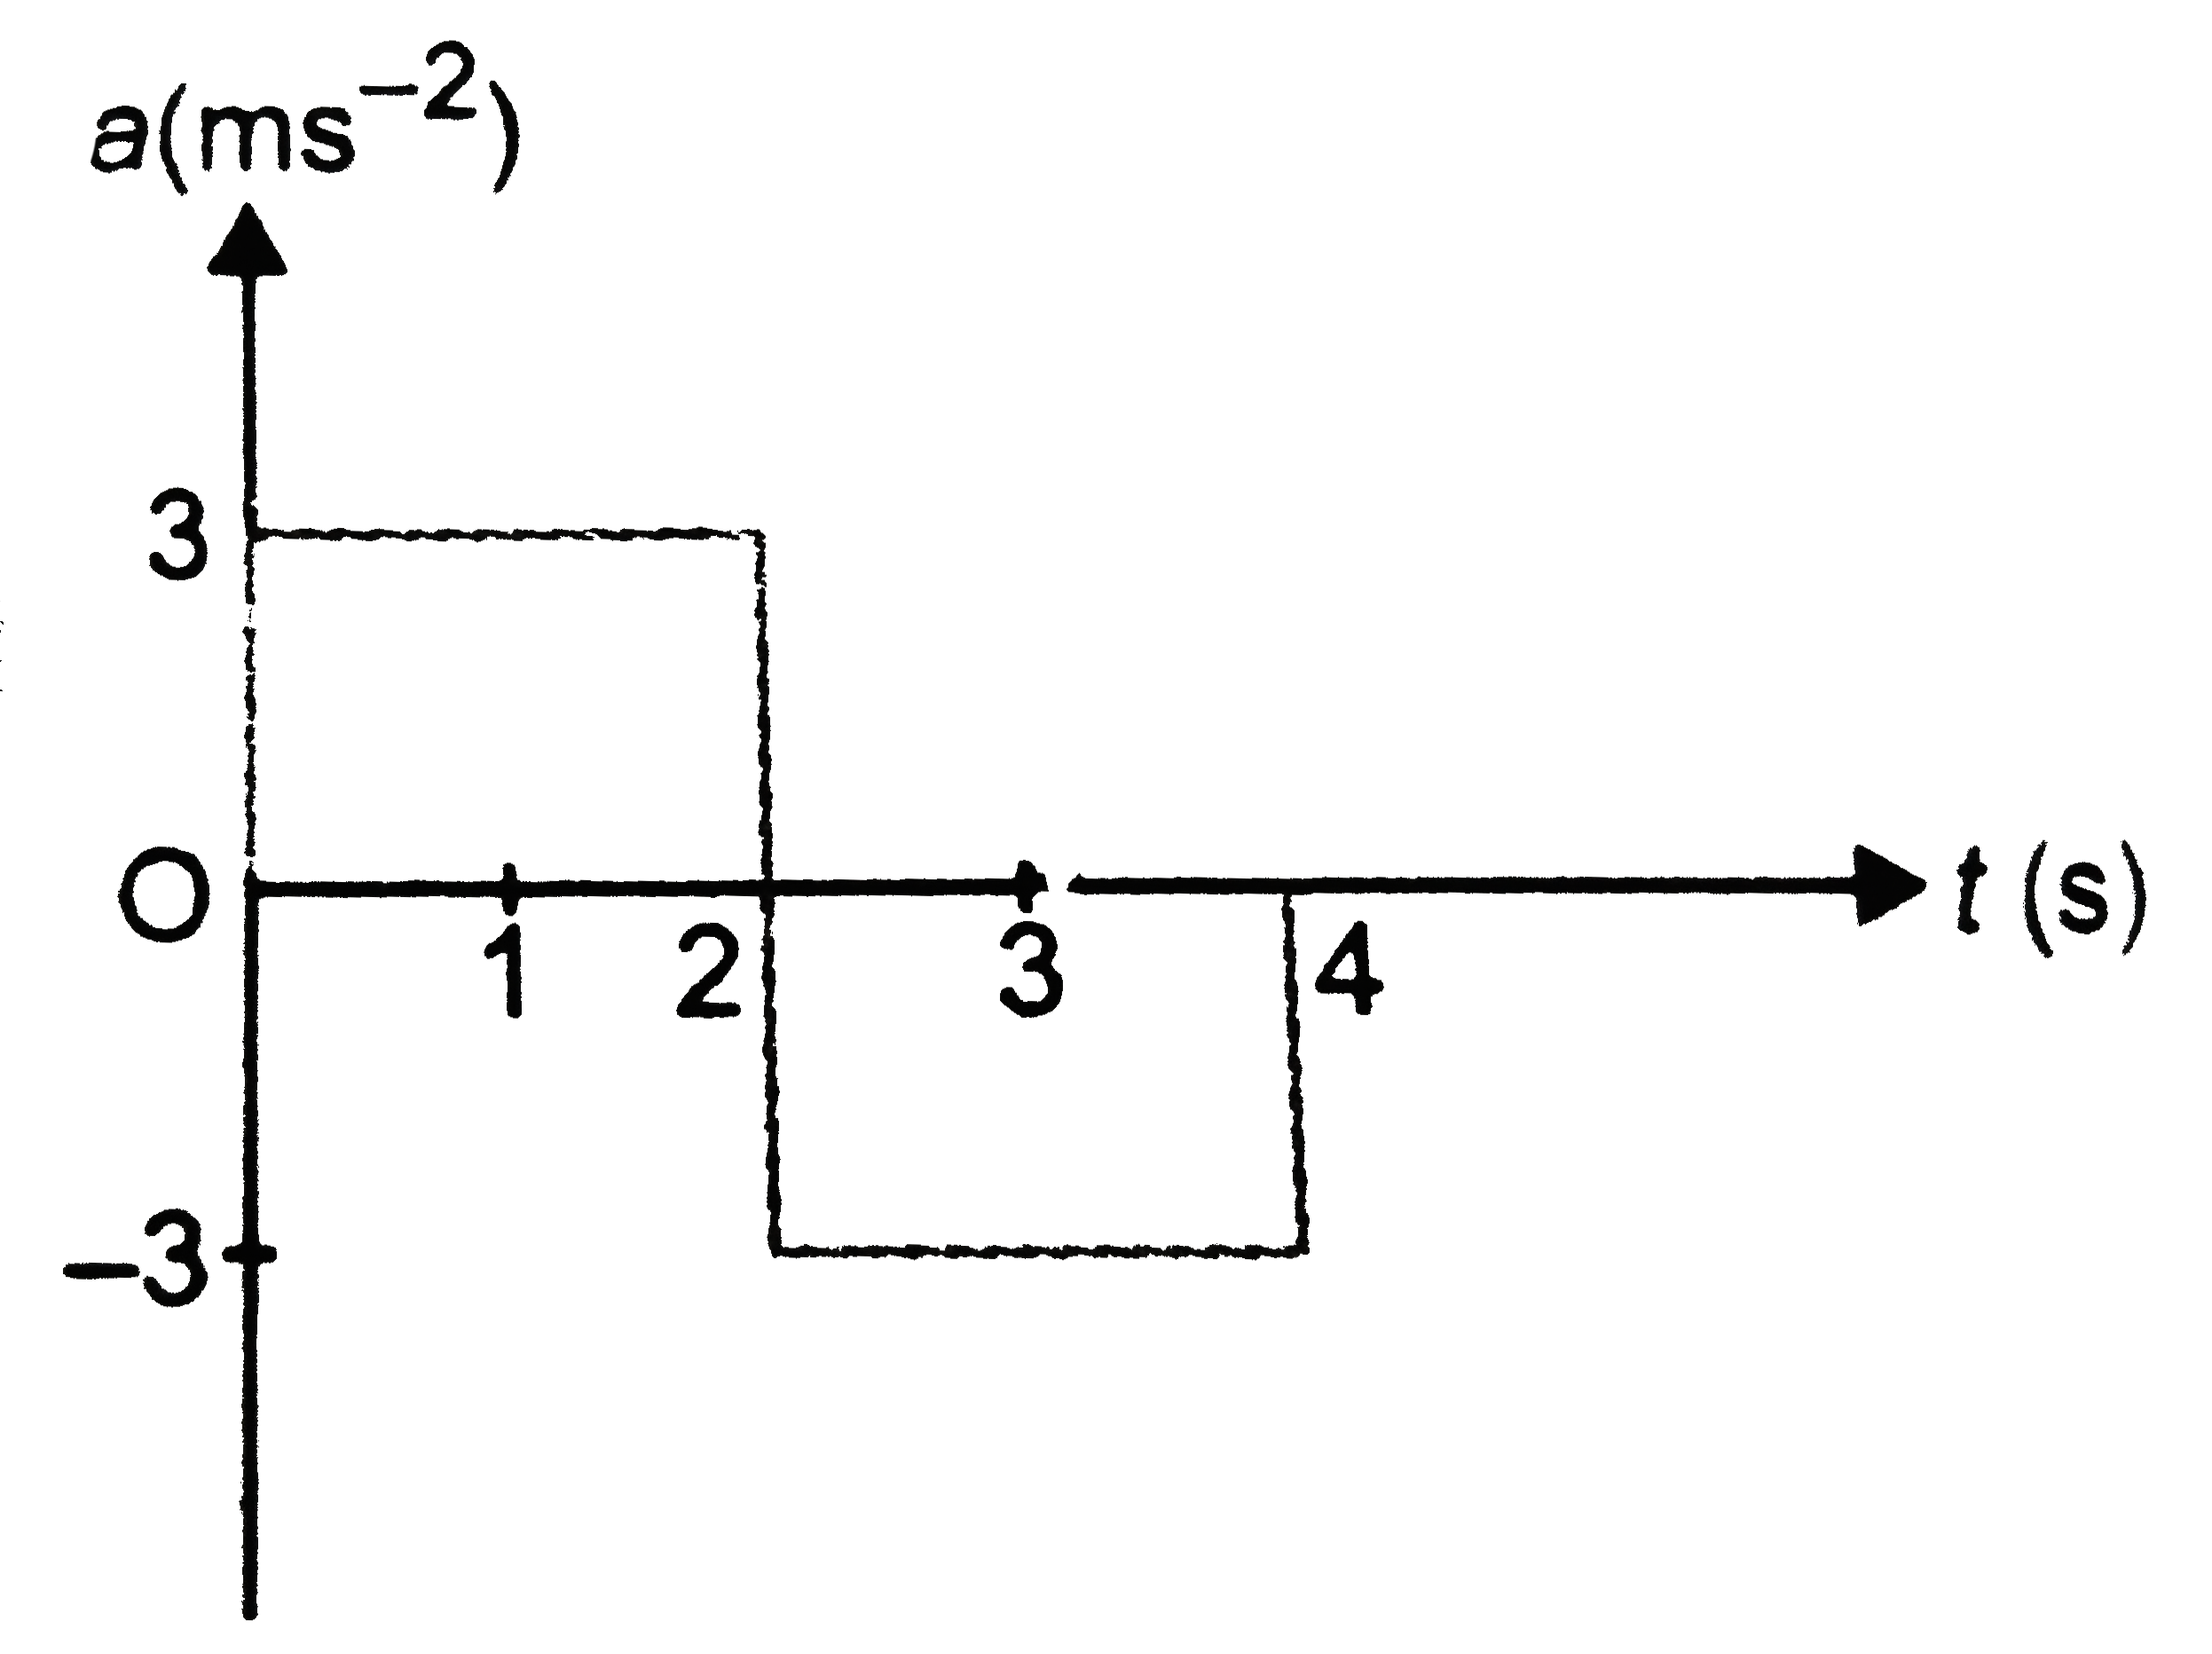
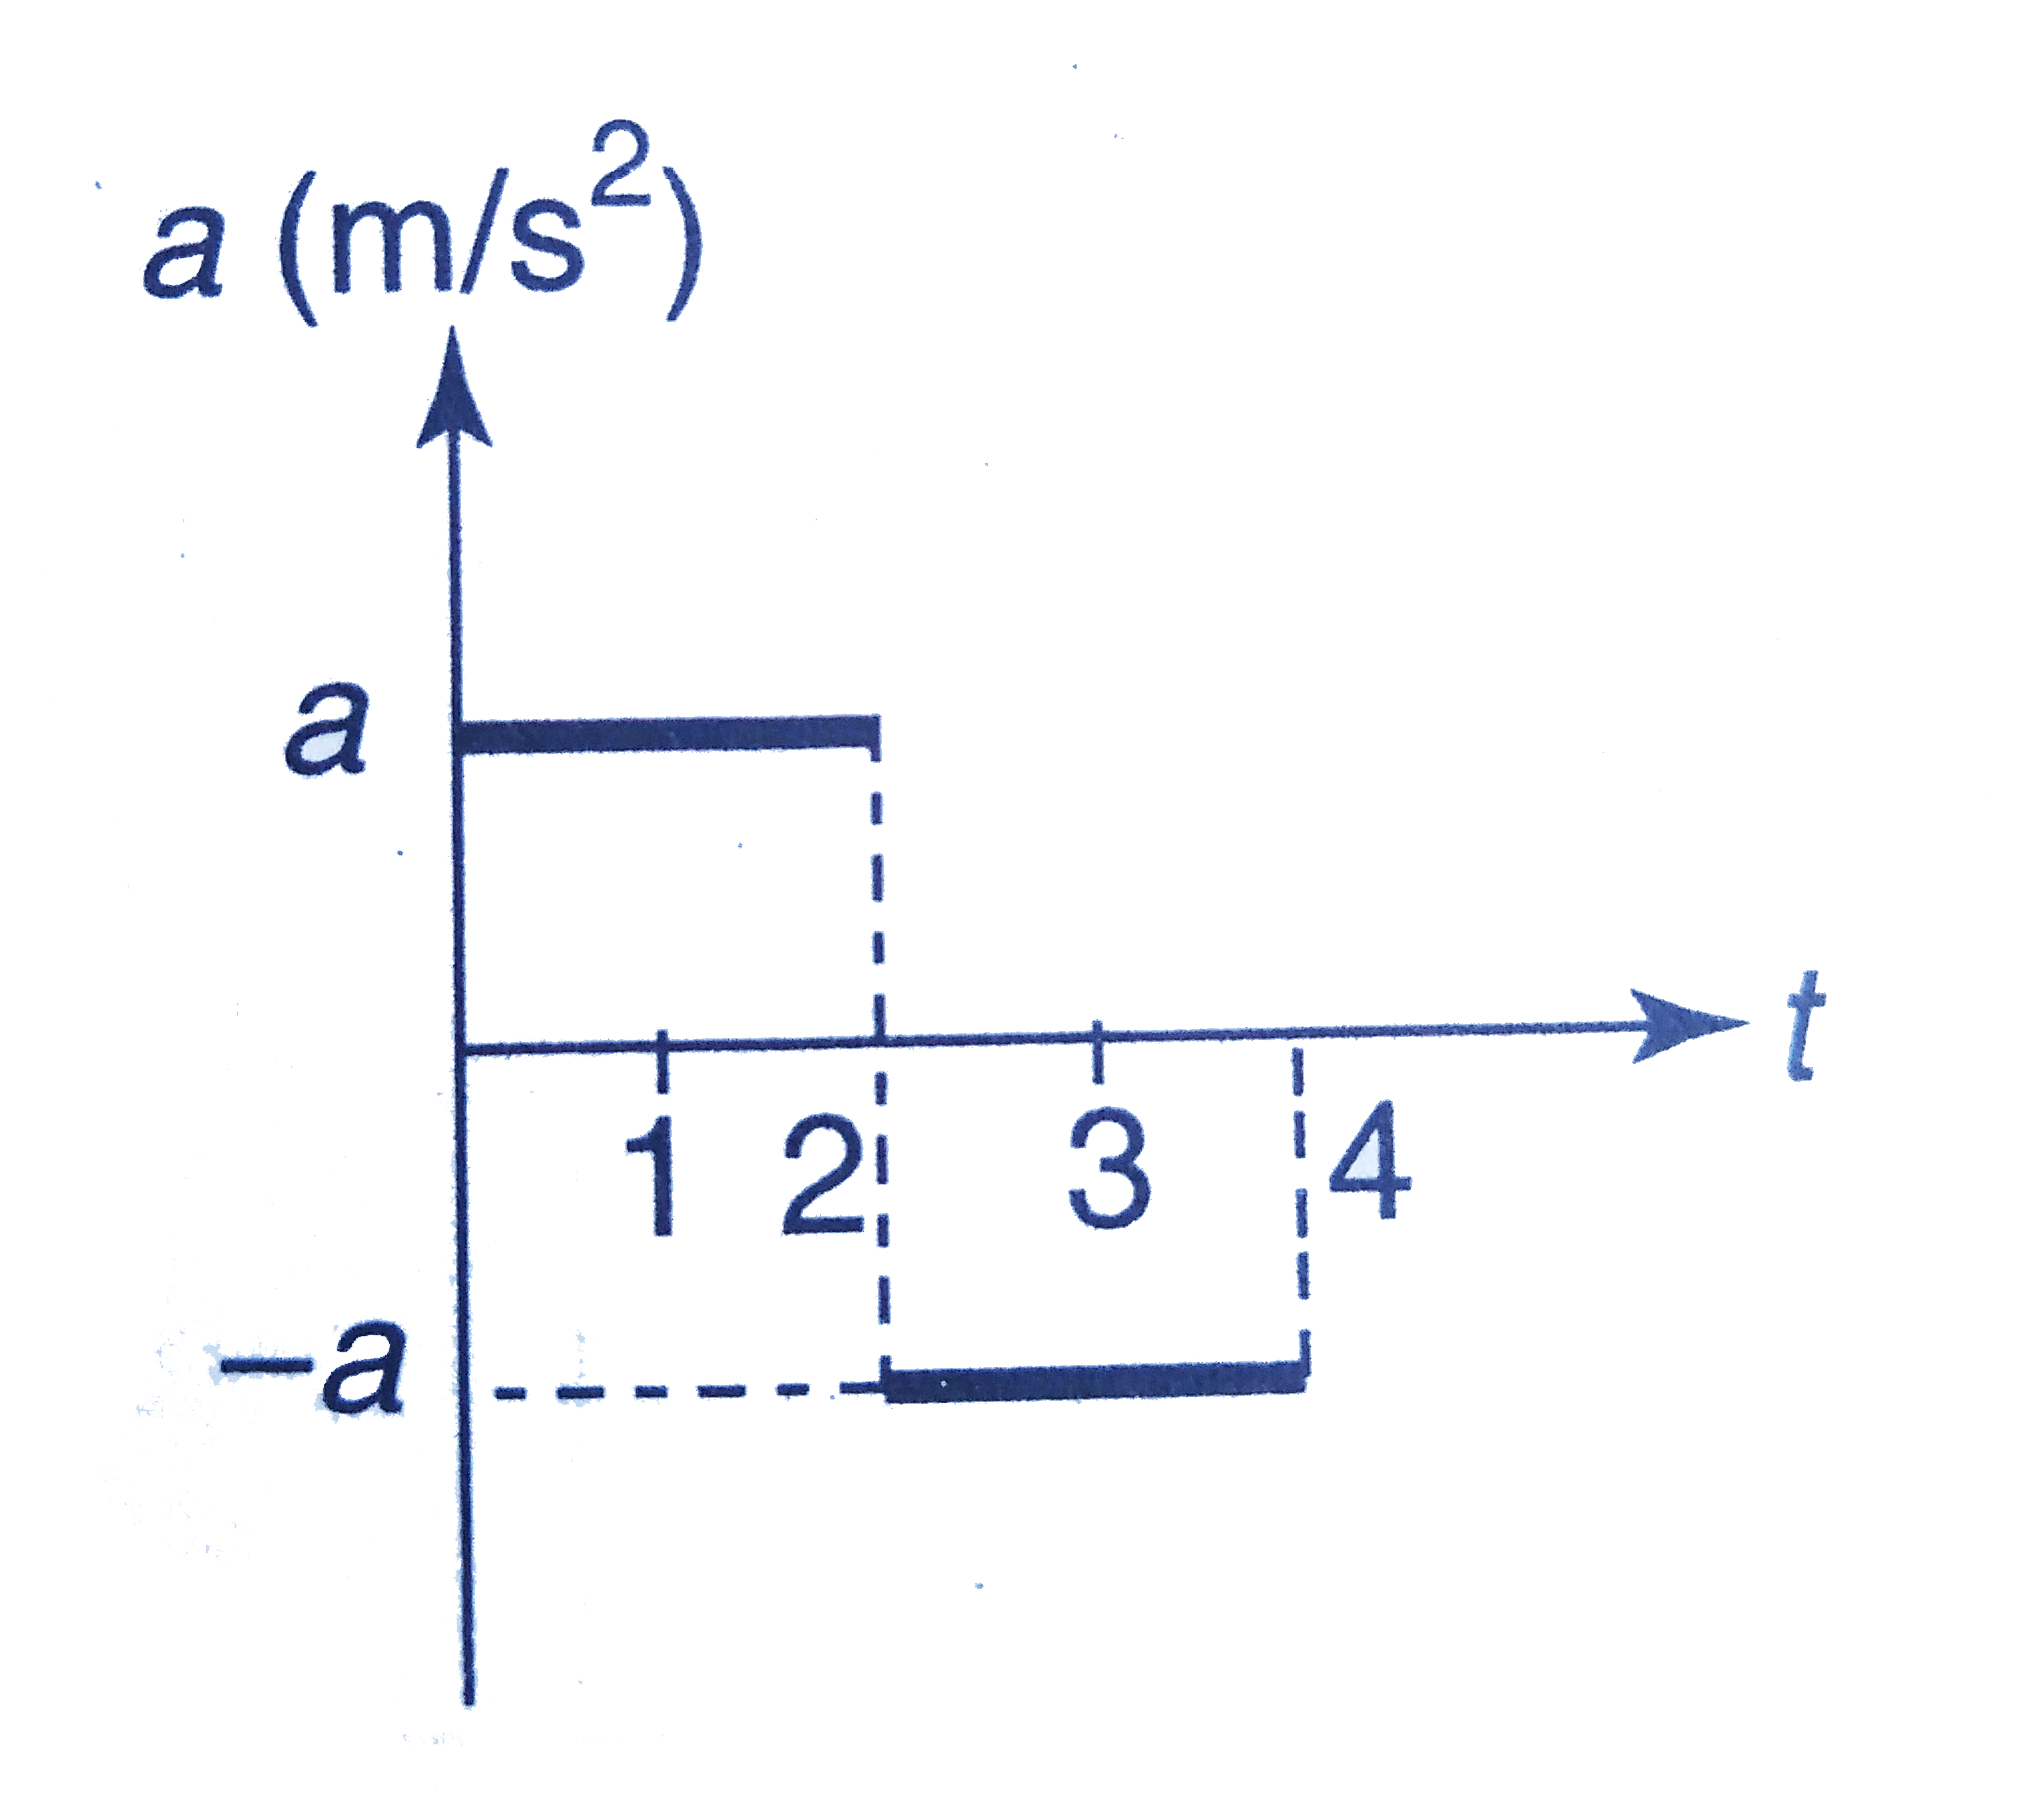
A particle starts from rest at t=0 and undergoes and acceleration (a) in ms−2 with time (t) in seconds which is shown in Fig. 2 (DF) .16 . Which one of the following plot represents velocity (v) (in ms−1) verses time (in seconds ) ?
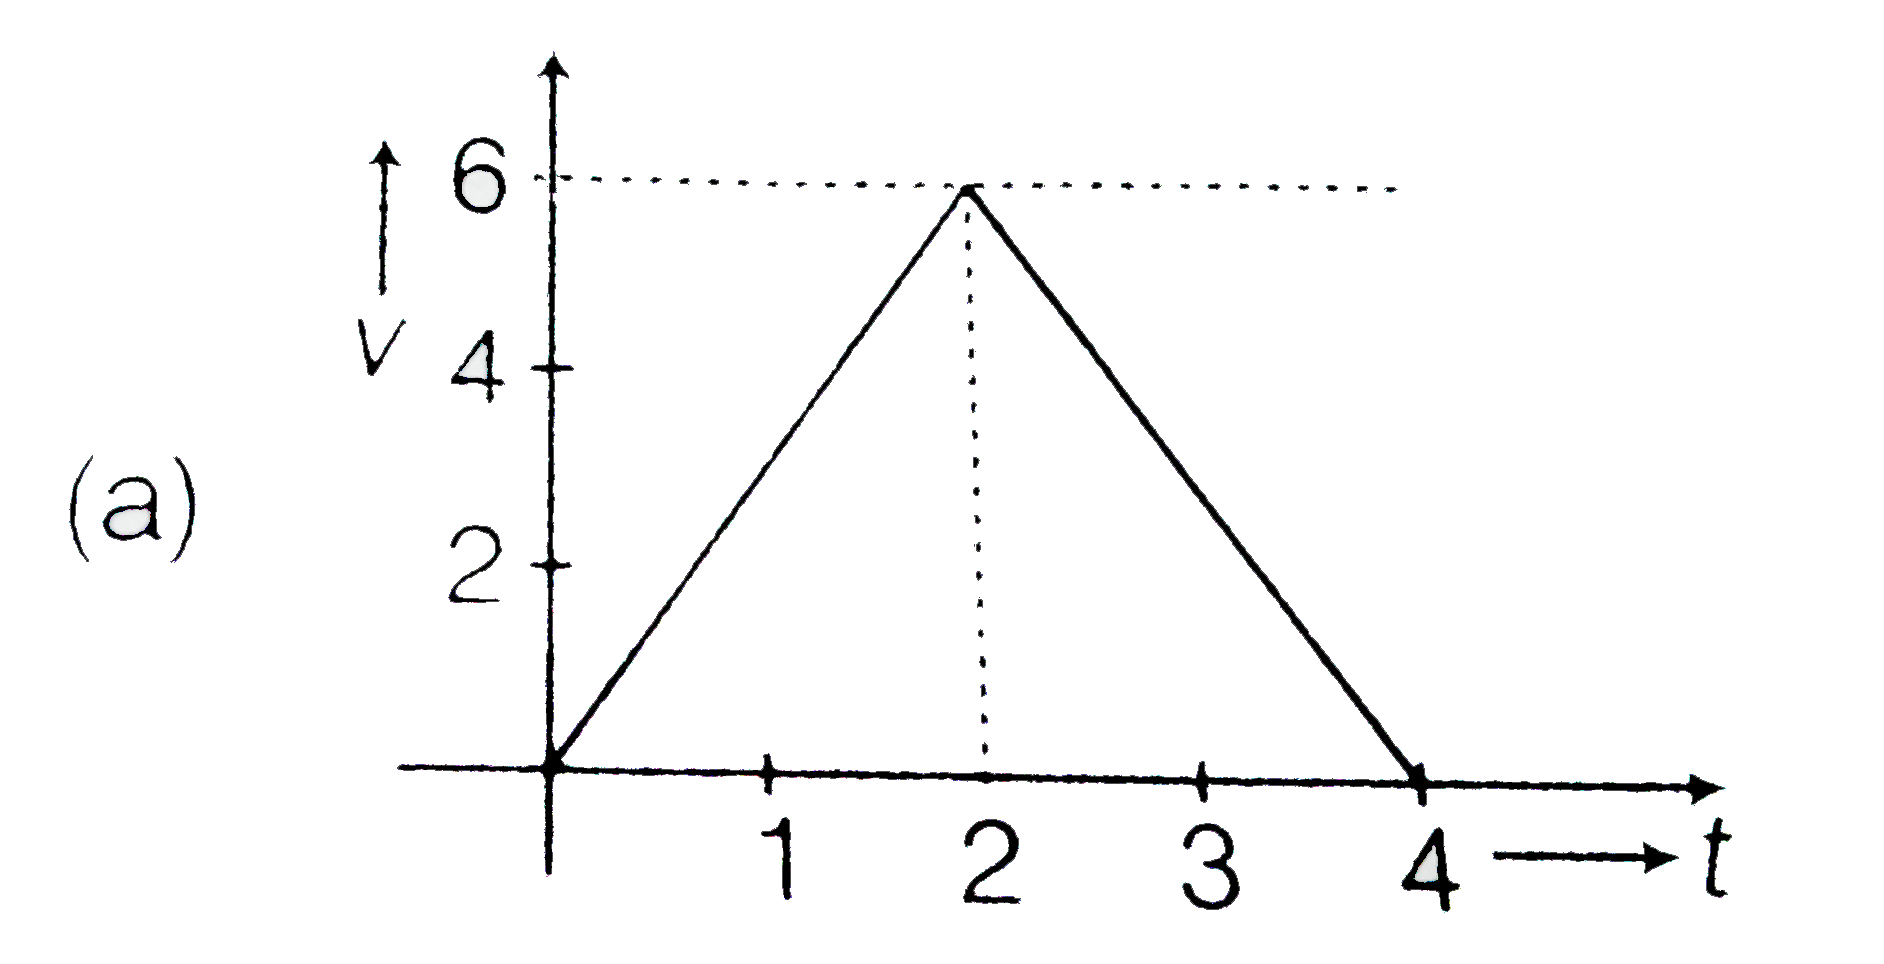
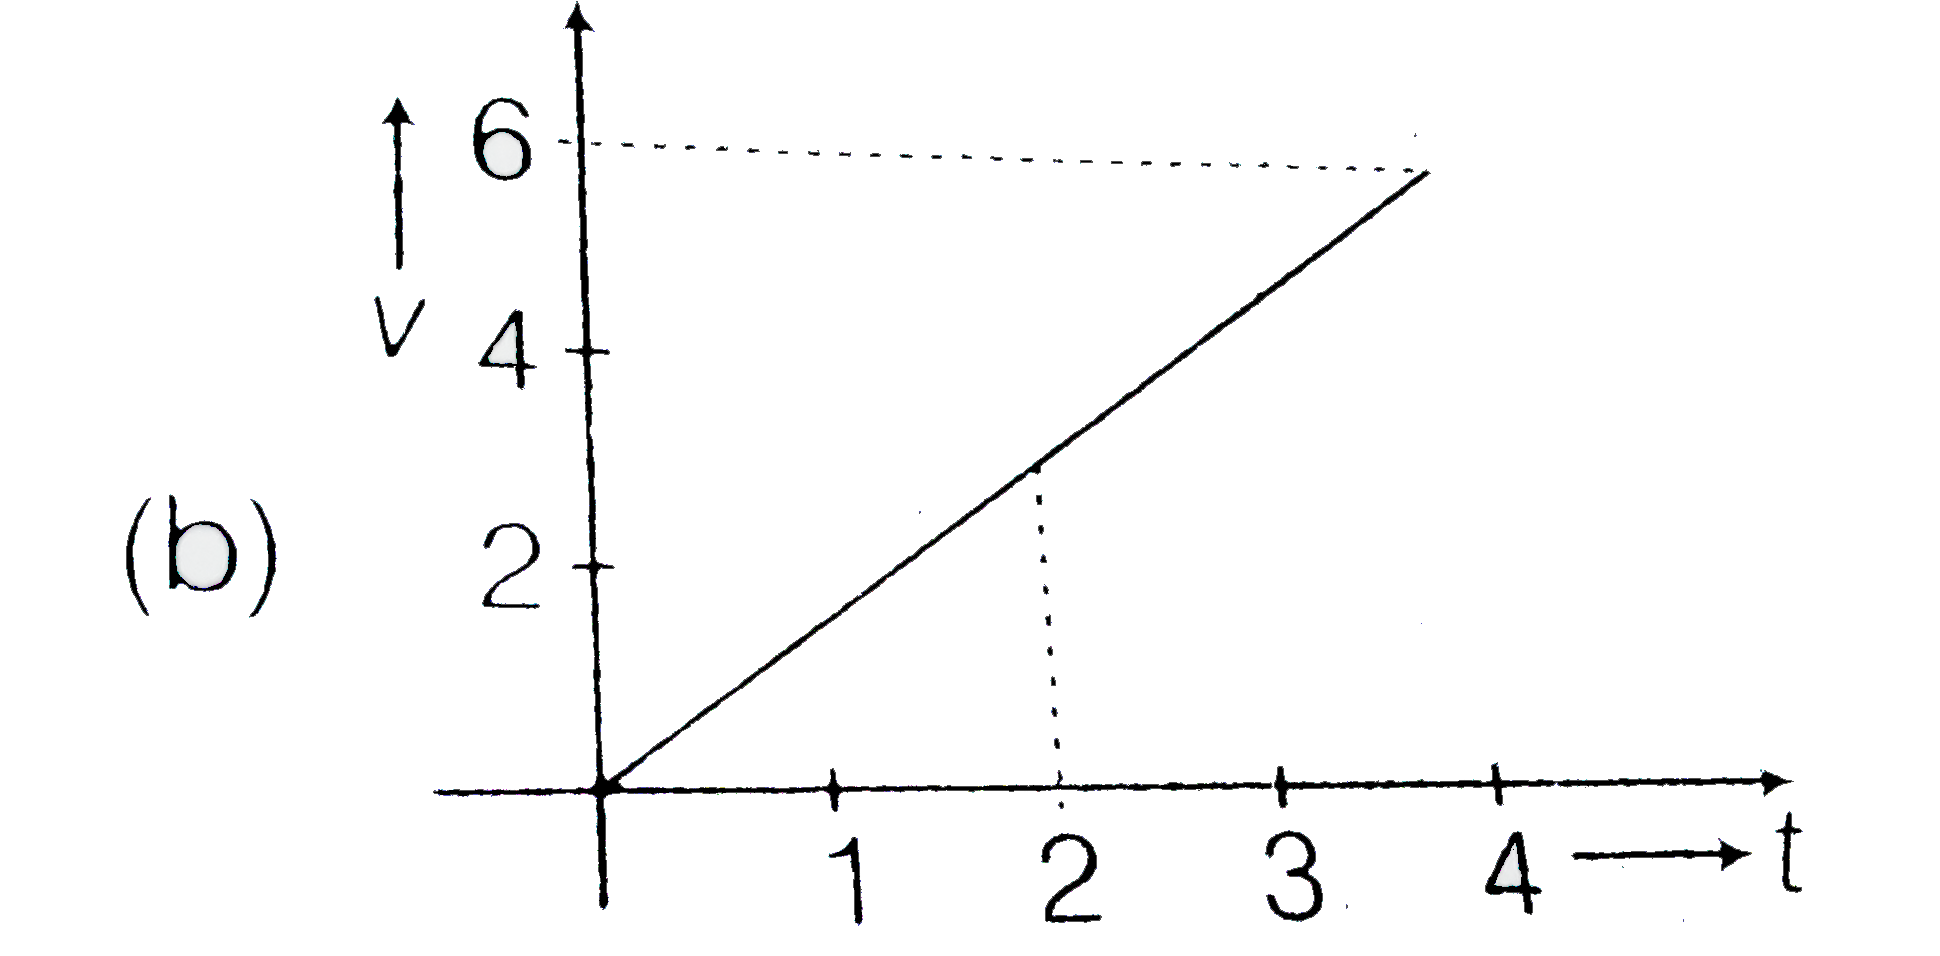
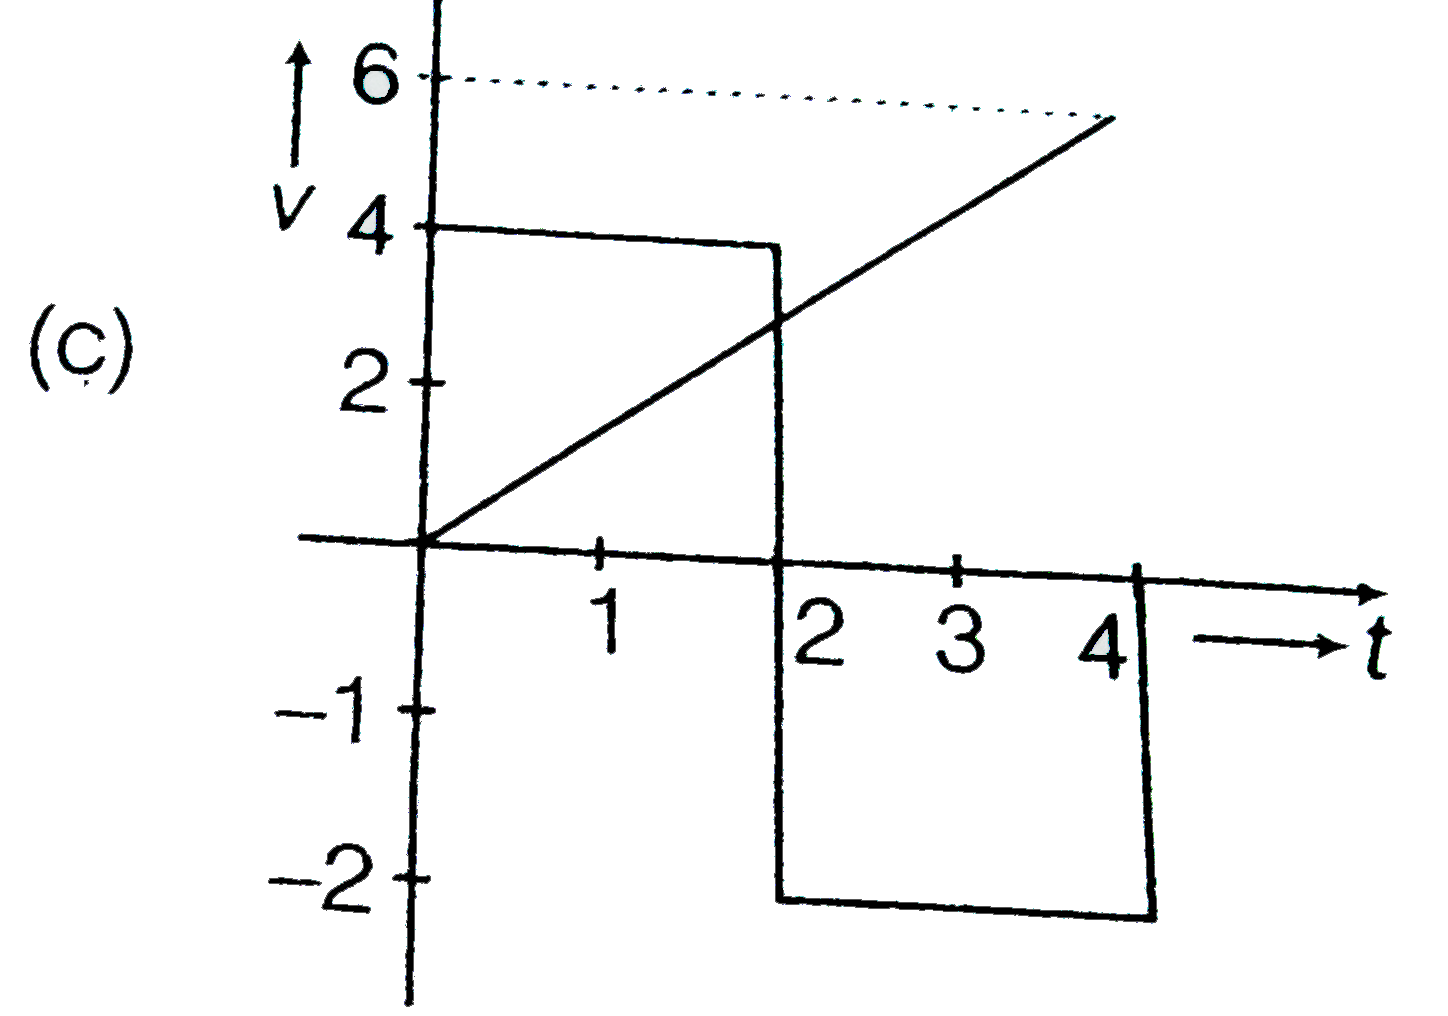
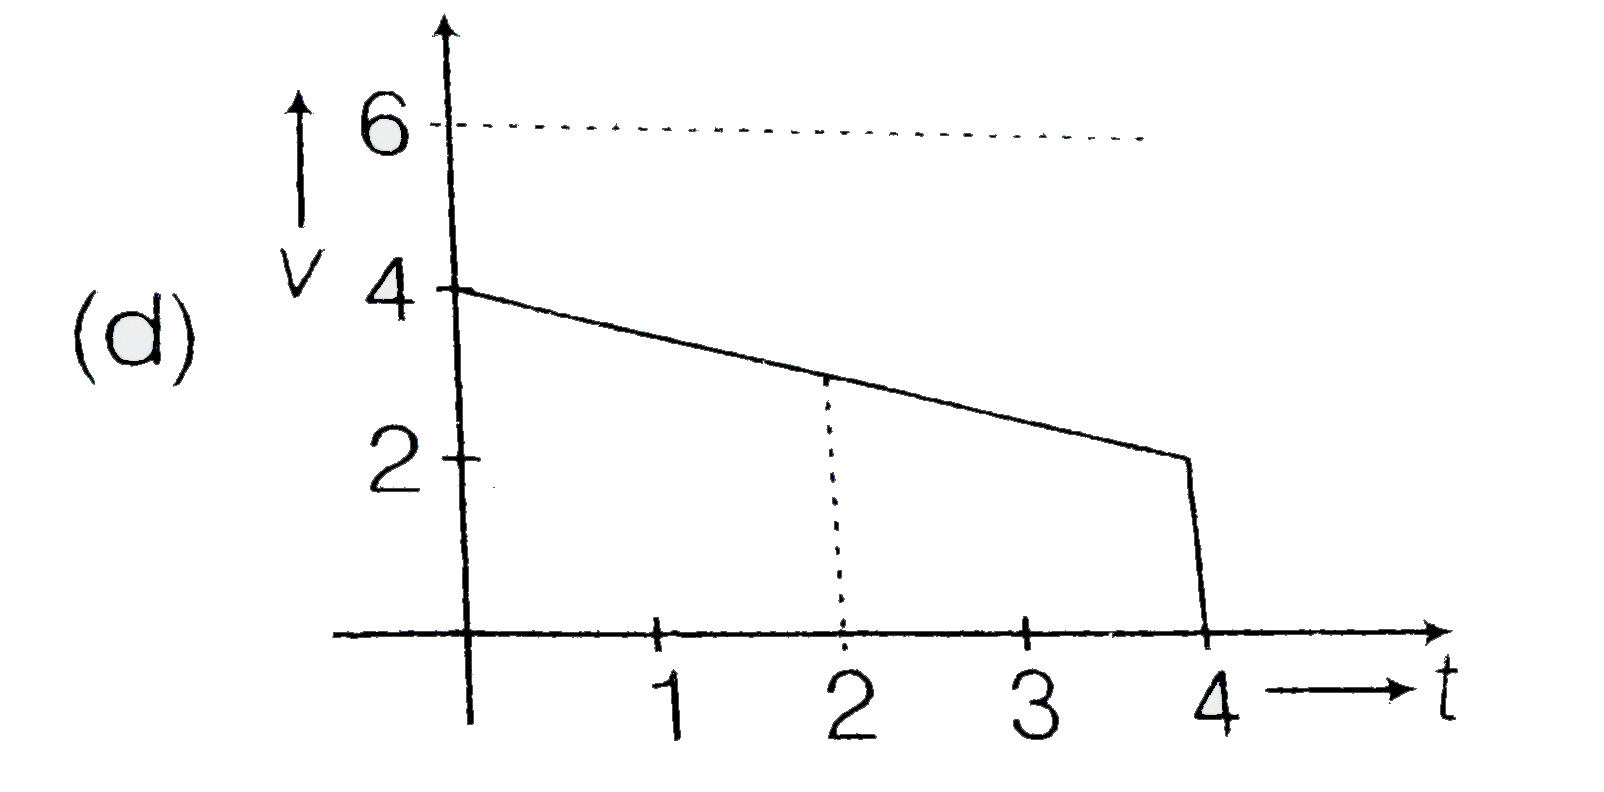
The correct Answer is:A
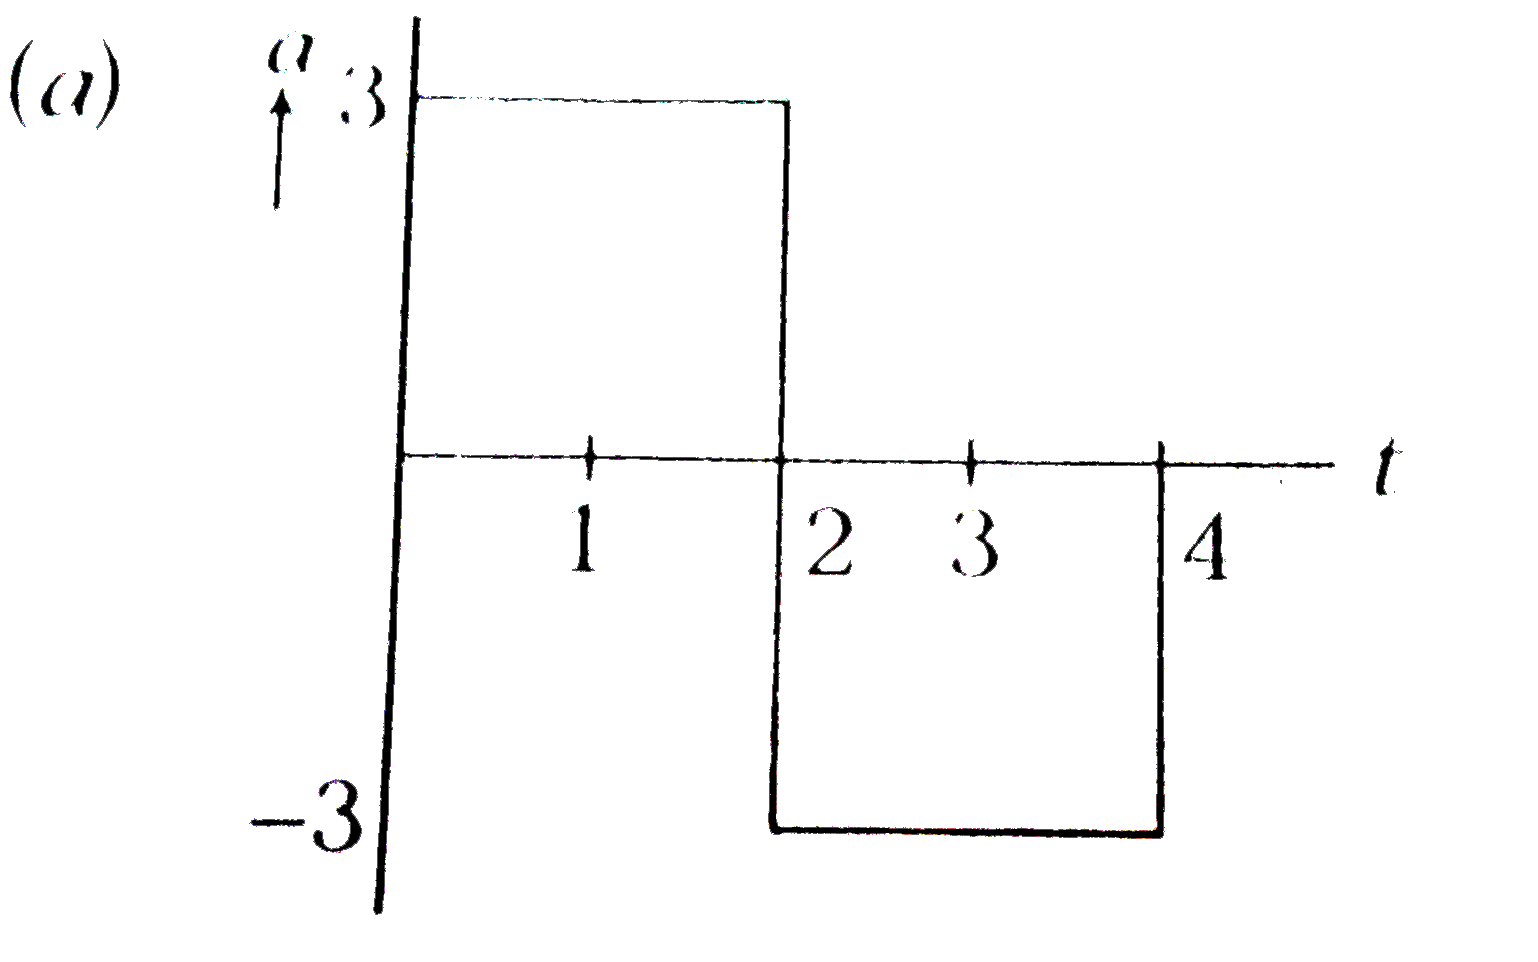
Taking the motion from 0 to 2 s
u=0,a=3ms−2,t=2s,υ=?
υ=u+at=0+3×2=6ms−1
Taking the motion from 2s to 4s
υ=6+(−3)(2)=0ms−1
Topper's Solved these Questions
- BOOK - DC PANDEYCHAPTER - MOTION IN A PLANEEXERCISE - Check point 3.715videos
MOTION IN A PLANE
- BOOK - DC PANDEYCHAPTER - MOTION IN A PLANEEXERCISE - (A) Taking it together75videos
MOTION IN A PLANE
- BOOK - DC PANDEYCHAPTER - MOTION IN A PLANEEXERCISE - Check point 3.525videos
MOTION IN A PLANE
- BOOK - DC PANDEYCHAPTER - MOTIONEXERCISE - Medical entrances gallery19videos
MOTION
- BOOK - DC PANDEYCHAPTER - PROJECTILE MOTIONEXERCISE - Level - 2 Subjective10videos
PROJECTILE MOTION
Similar Questions
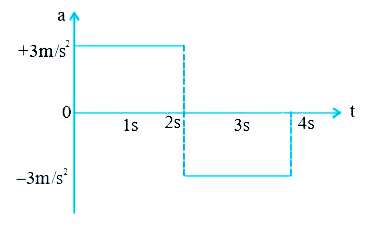
A particle starts from rest at t=0 and undergoes an acceleration as shown in figure.
Draw the velocity-time graph of the motion of the particle during the interval from zero to 4 second.
 View Solution
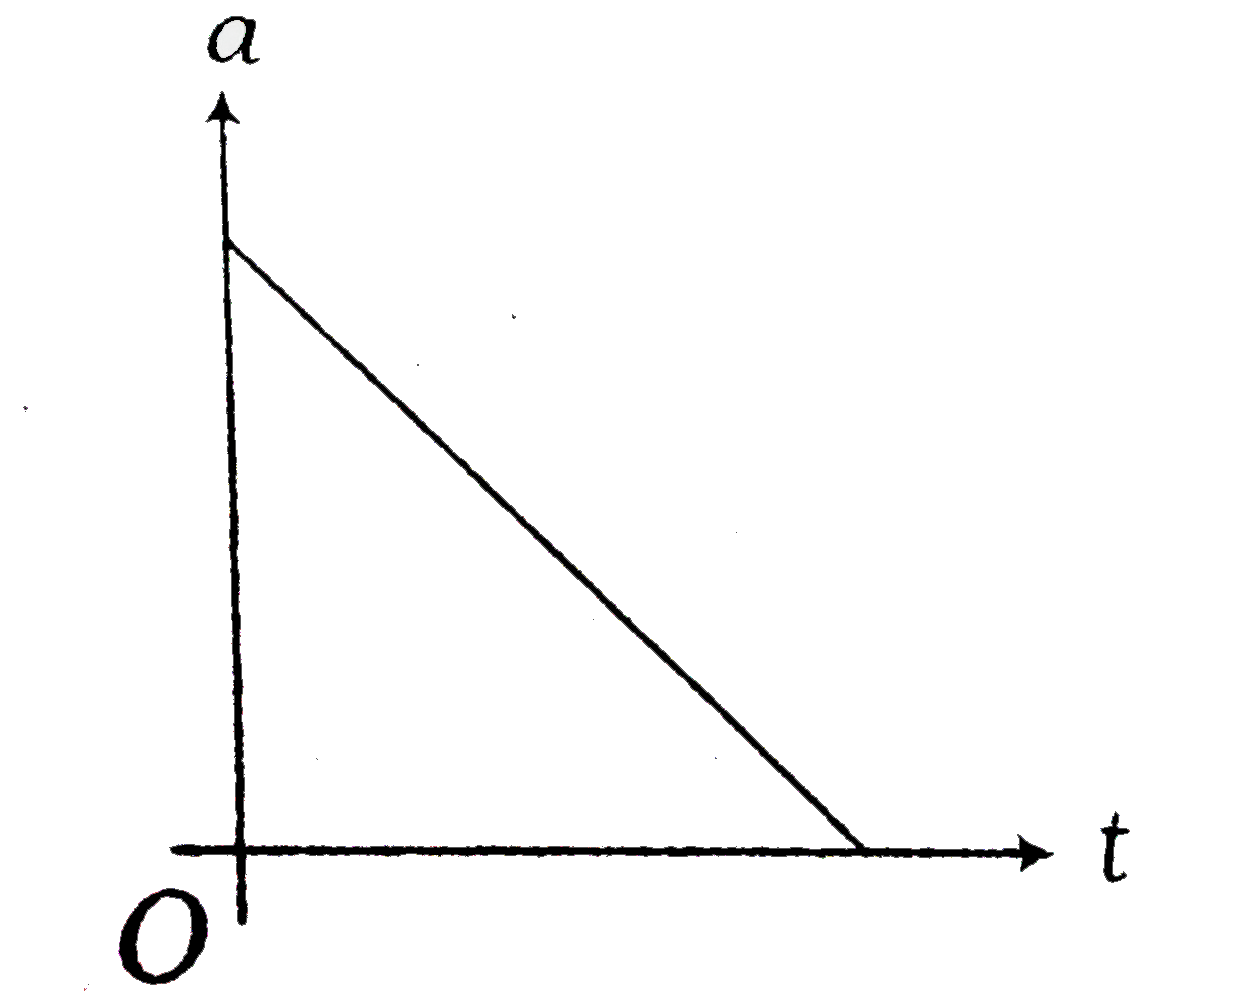
The acceleration (a)-time(t) graph for a particle moving along a straight from rest is shown in figur. Which of the following graph is the best representation of its velocity (v) with time (t) ?
 View Solution
Knowledge Check
- Question 1 - Select One
A particle starts from rst at t=0 and undergoes and acceleration (a) in ms^(-2) with tiem (t) in seconds which is shown in Fig. 2 (DF) .16 . Which one of the following plot repesents velocity (v) (in ms_1) versis time (in seconds ) ?
 A
A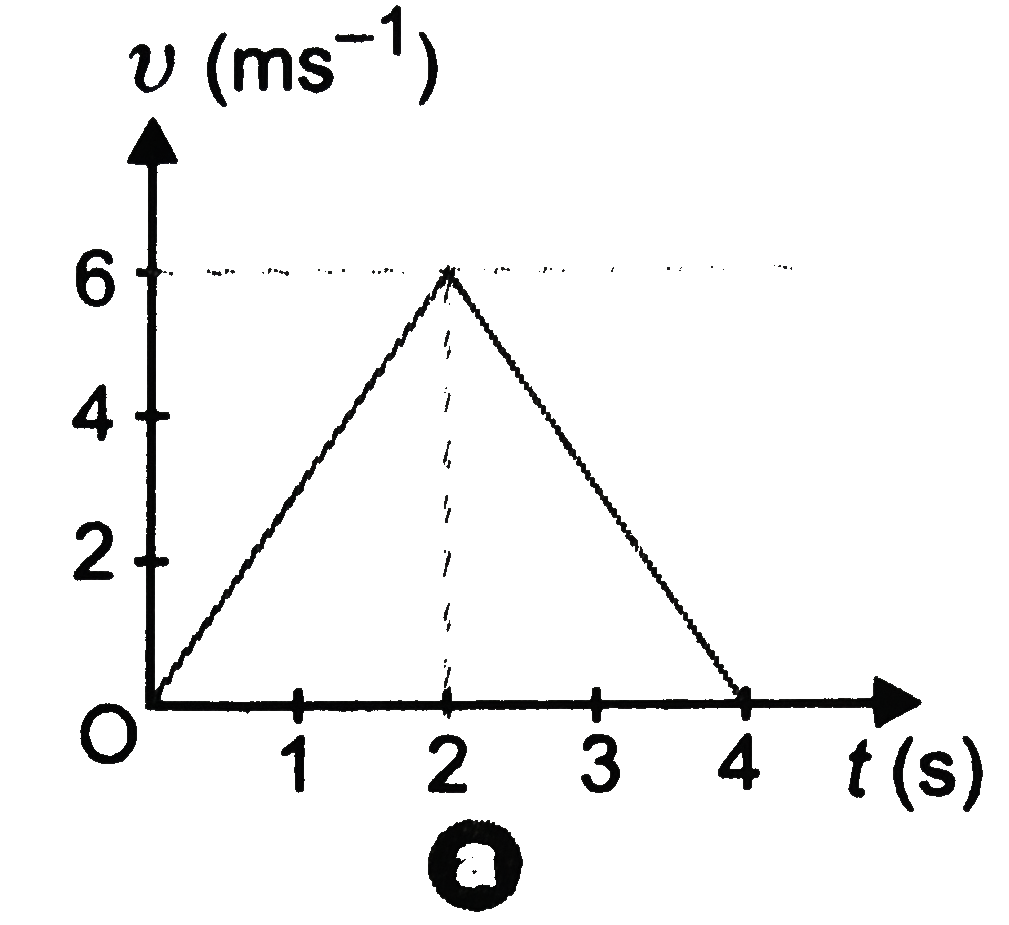 B
B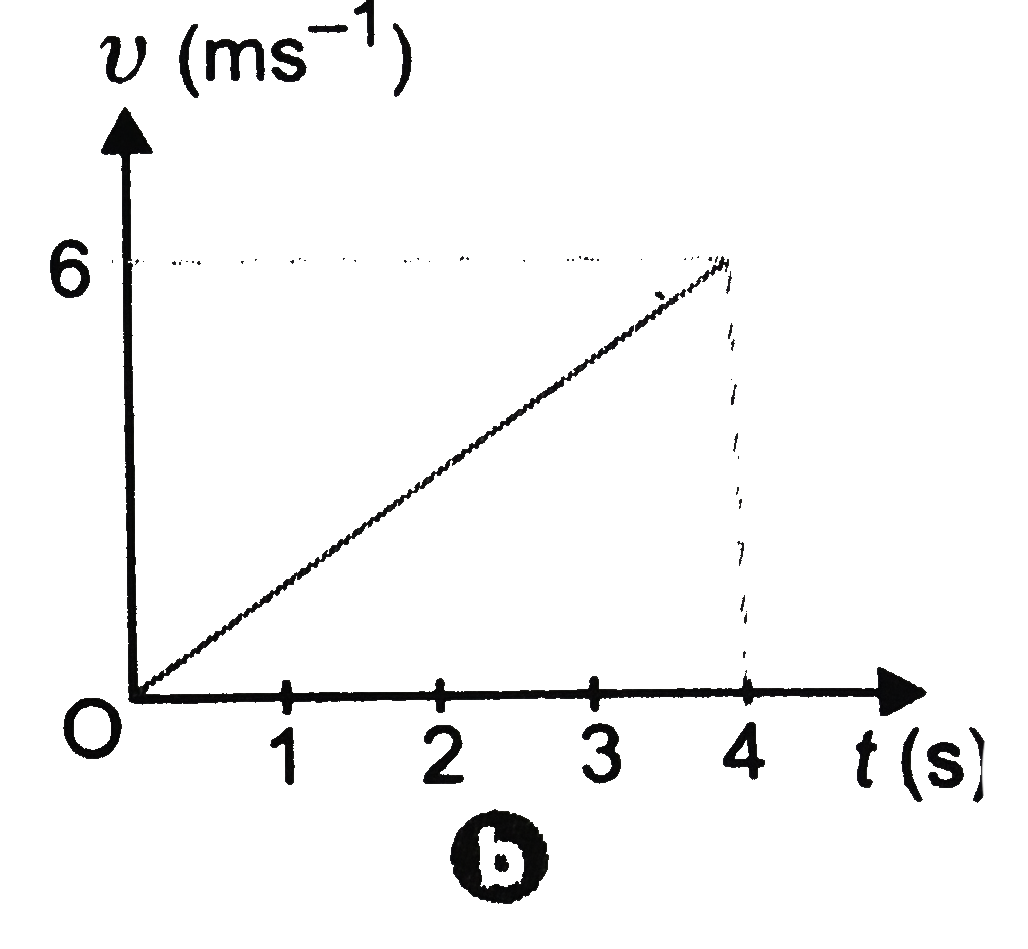 C
C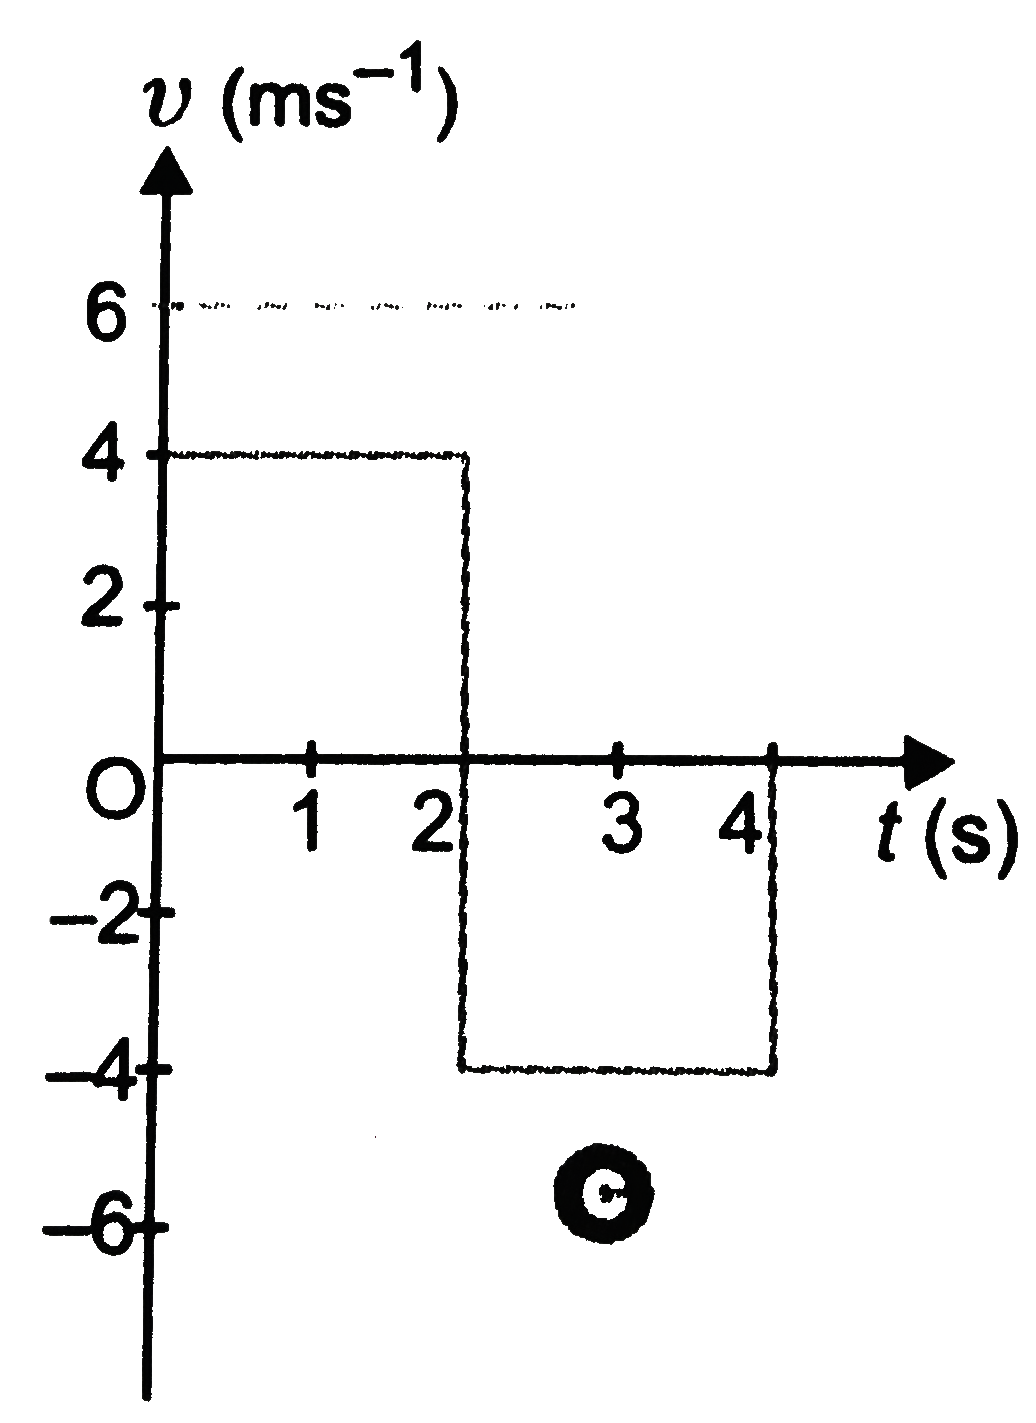 D
D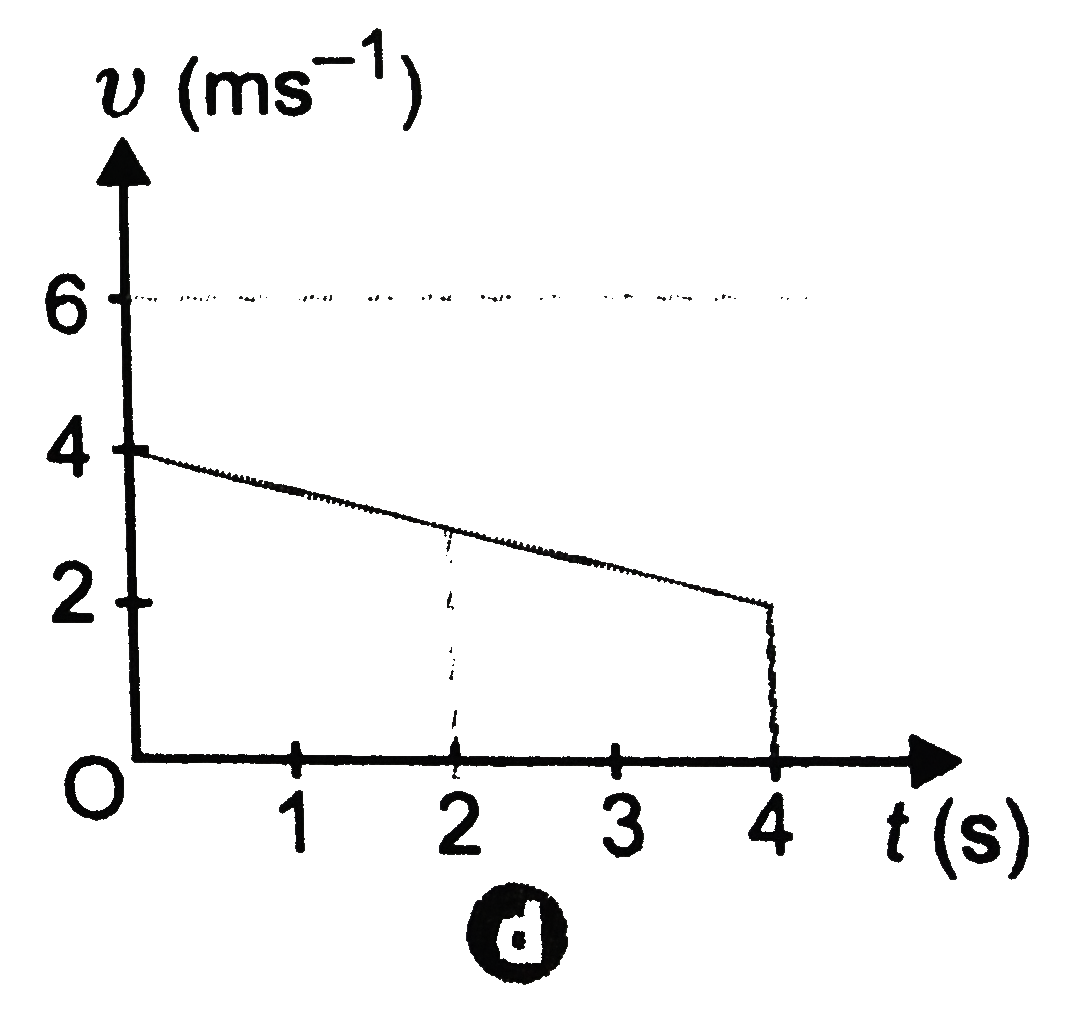
- Question 2 - Select One
A particle starts from rest and undergoes an acceleration as shown in figure. The velocity-time graph from figure will have a shape.
 A
A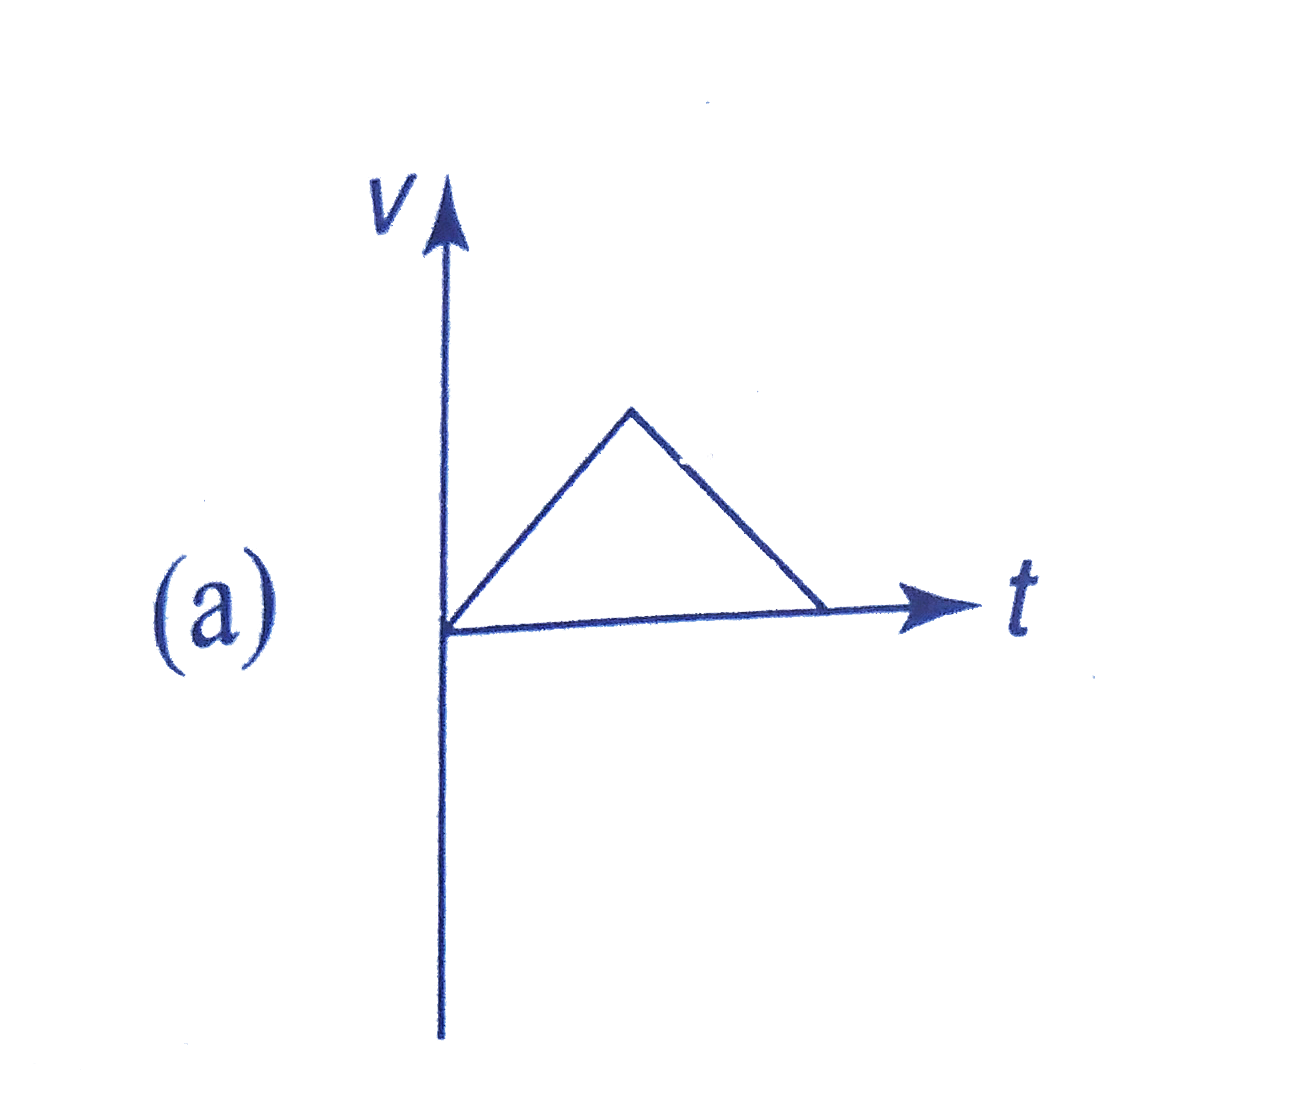 .B
.B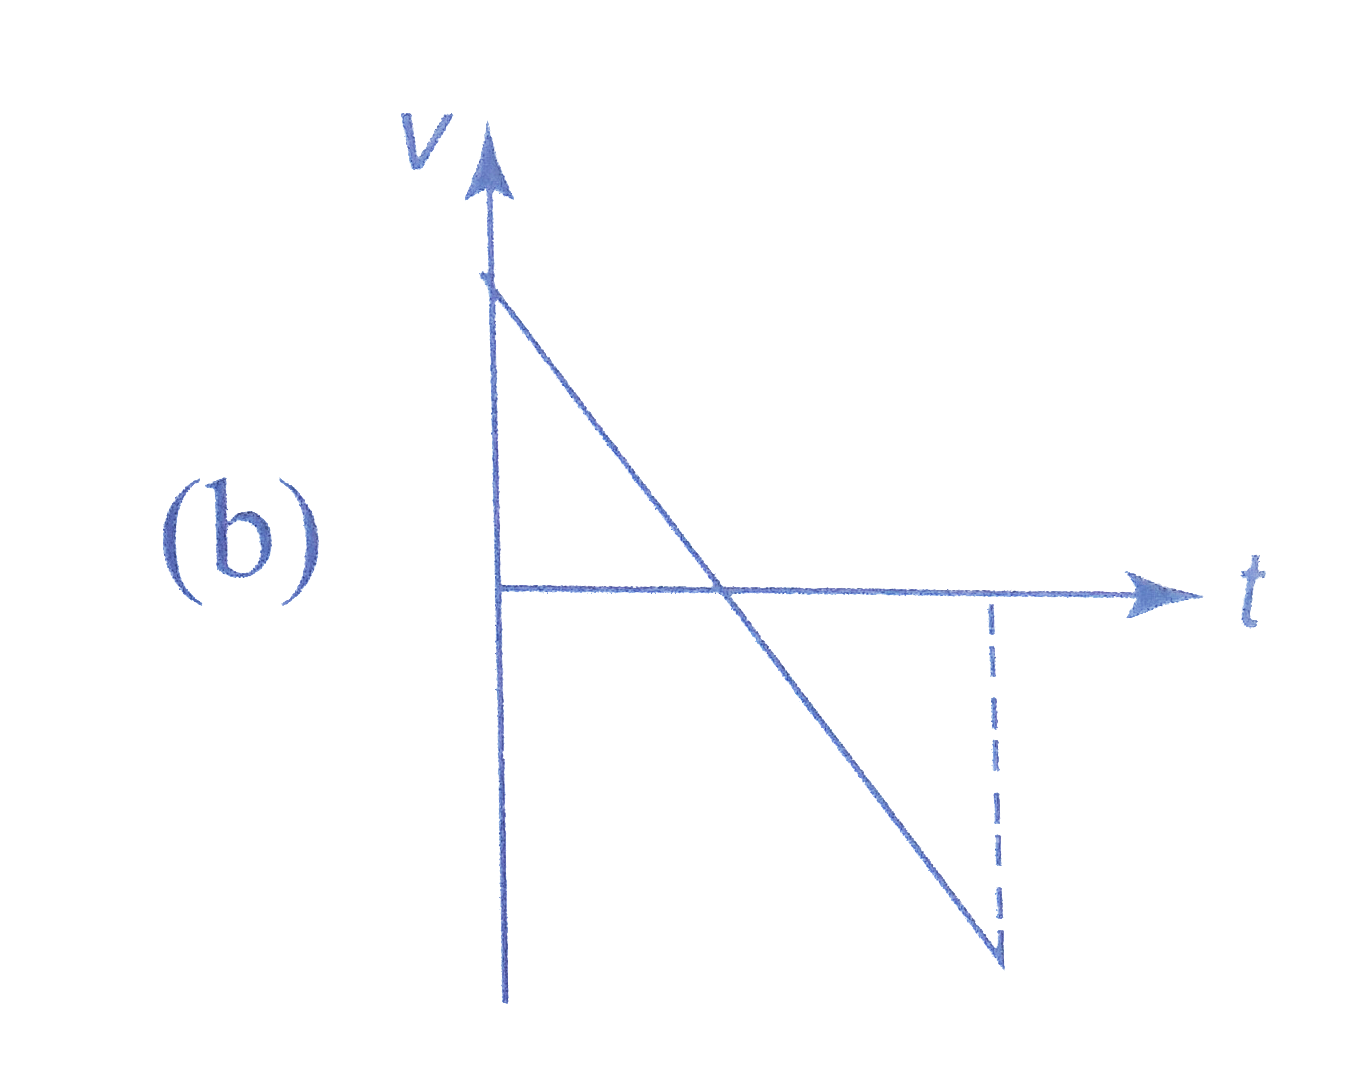 .C
.C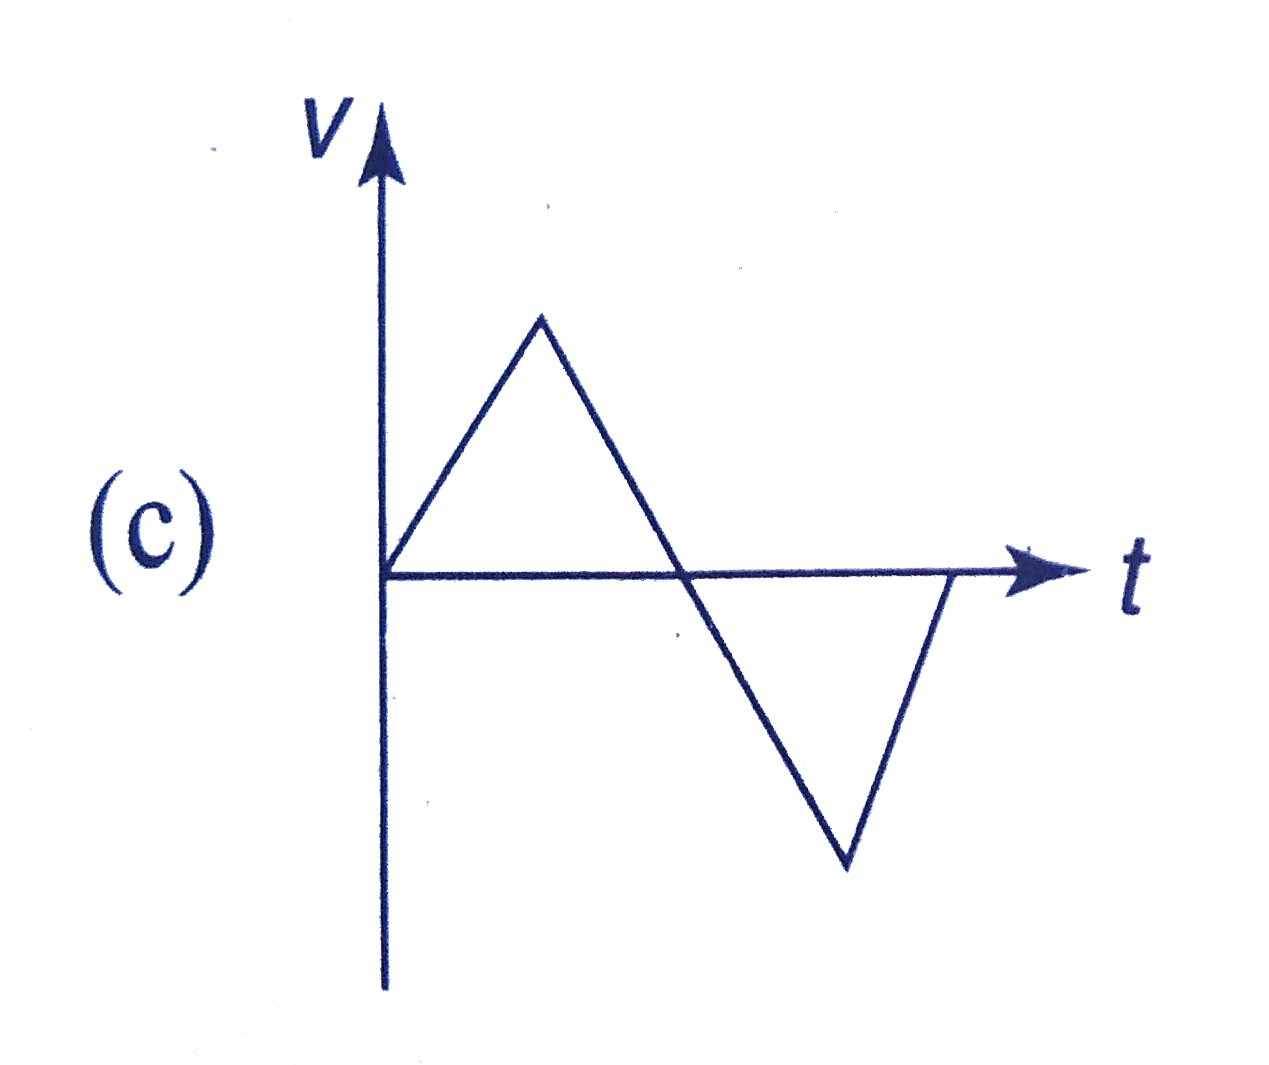 .D
.D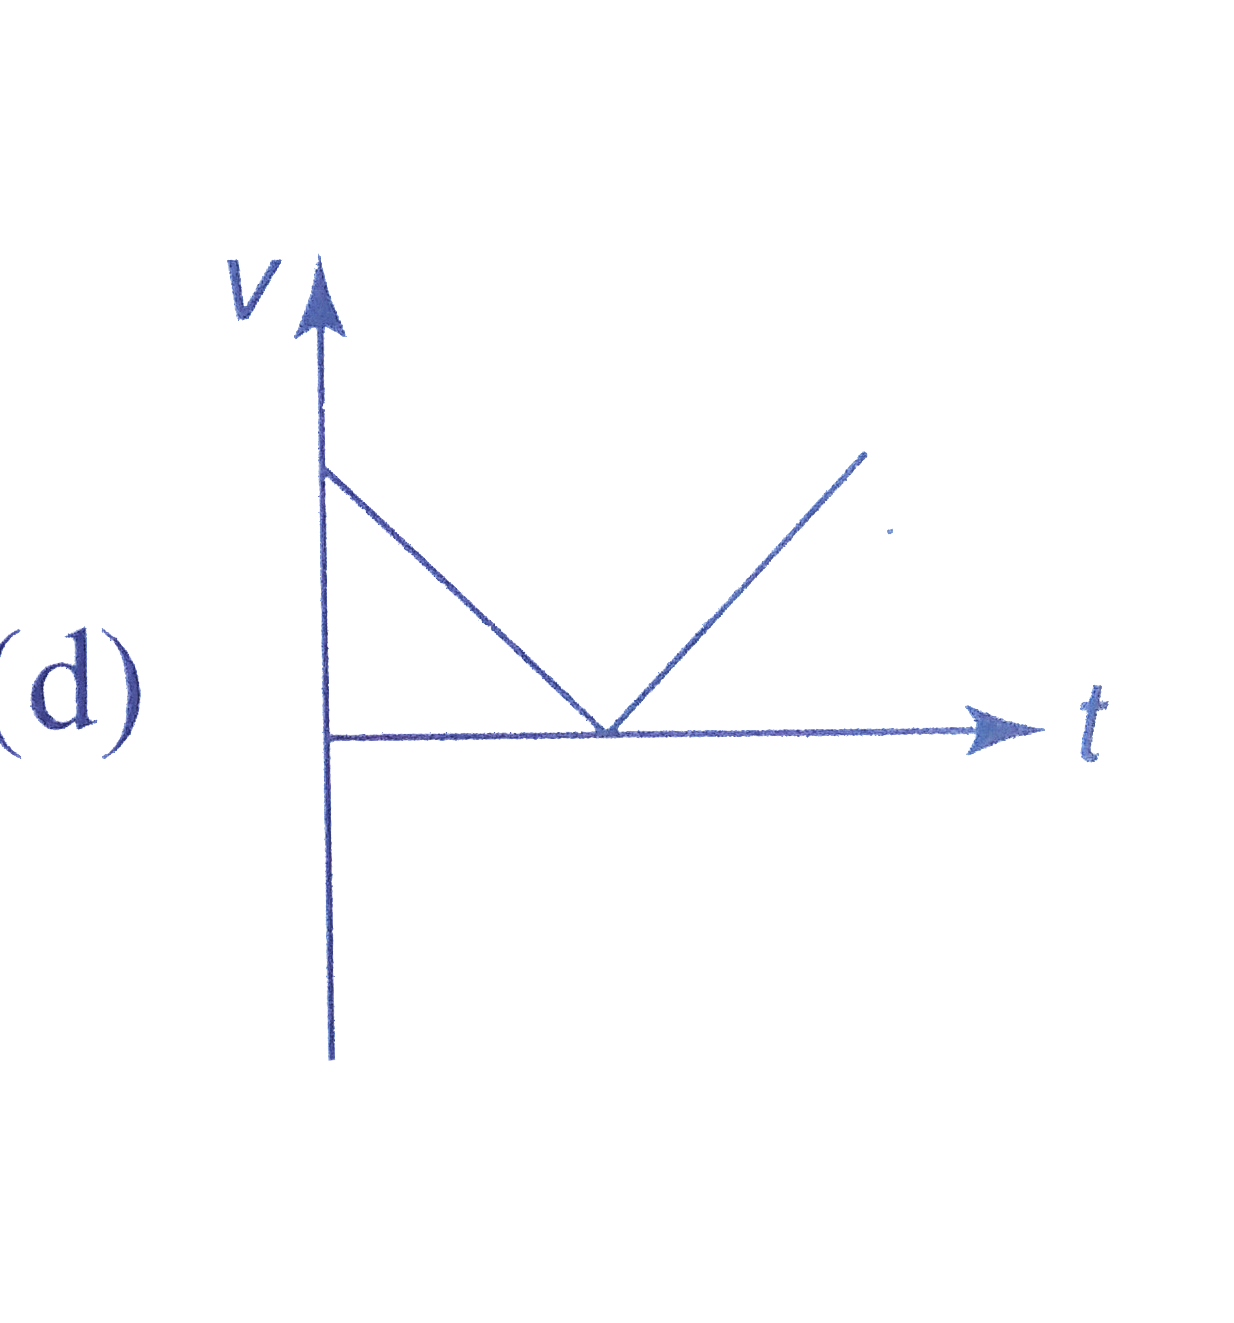 .
. - Question 3 - Select One
The distance travelled by a particle starting from rest and moving with an acceleration 43ms−2, in the third second is.
A6 mB4 mC103mD193m
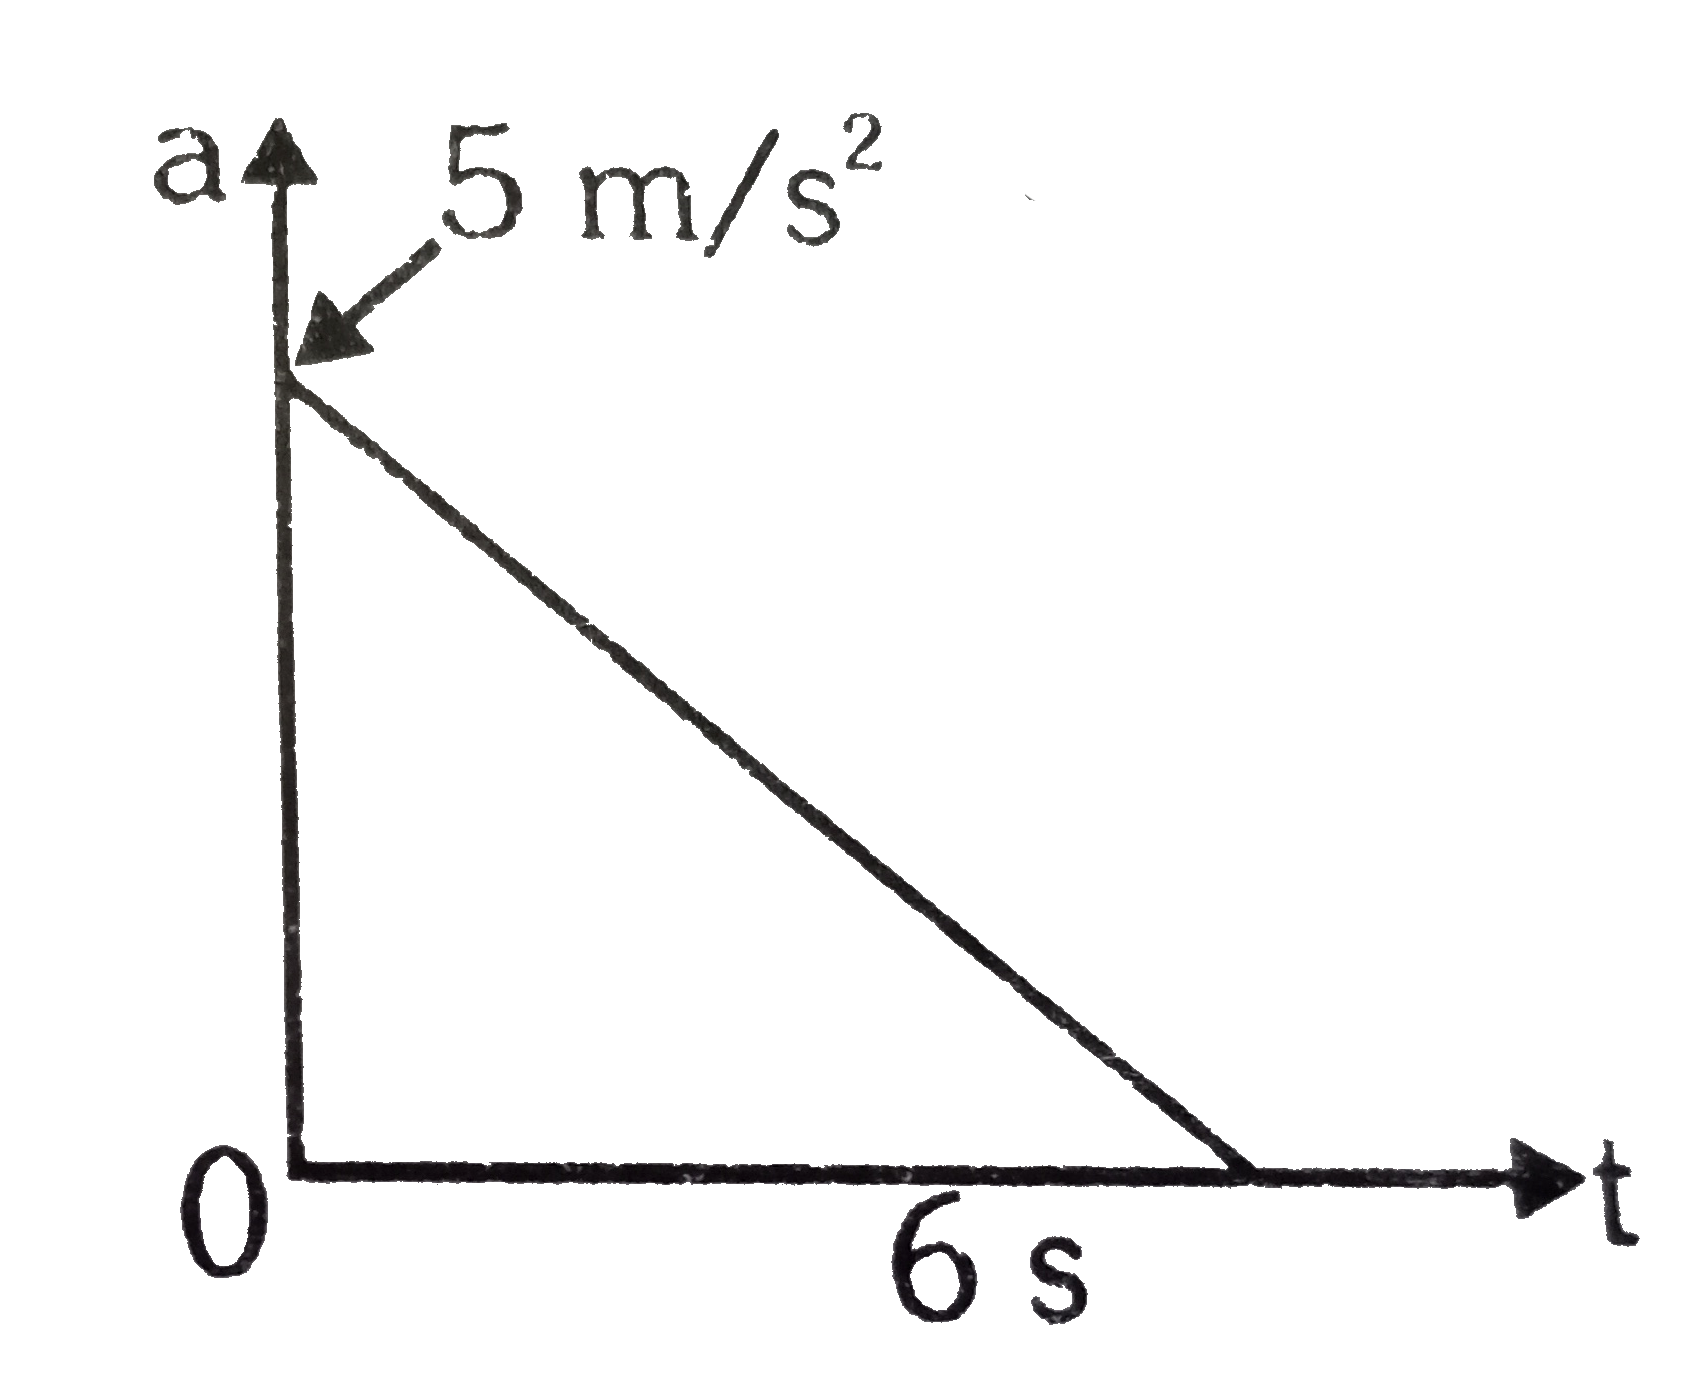
A particle starts from rest. Its acceleration at time t=0 is 5m/s2 which varies with time as shown in the figure. The maximum speed of the particle will be
 View Solution
A particle starts from rest with a time varying acceleration a=(2t−4). Here t is in second and a in m/s2
The velocity time graph of the particle isView SolutionA particle starts from rest with uniform acceleration a. Its velocity after n seconds is v. The displacement of the particle in the two seconds is :
View SolutionA particle starts from rest and moves with acceleration a which varies with time t as a=kt where k is a costant. The displacement s of the particle at time t is
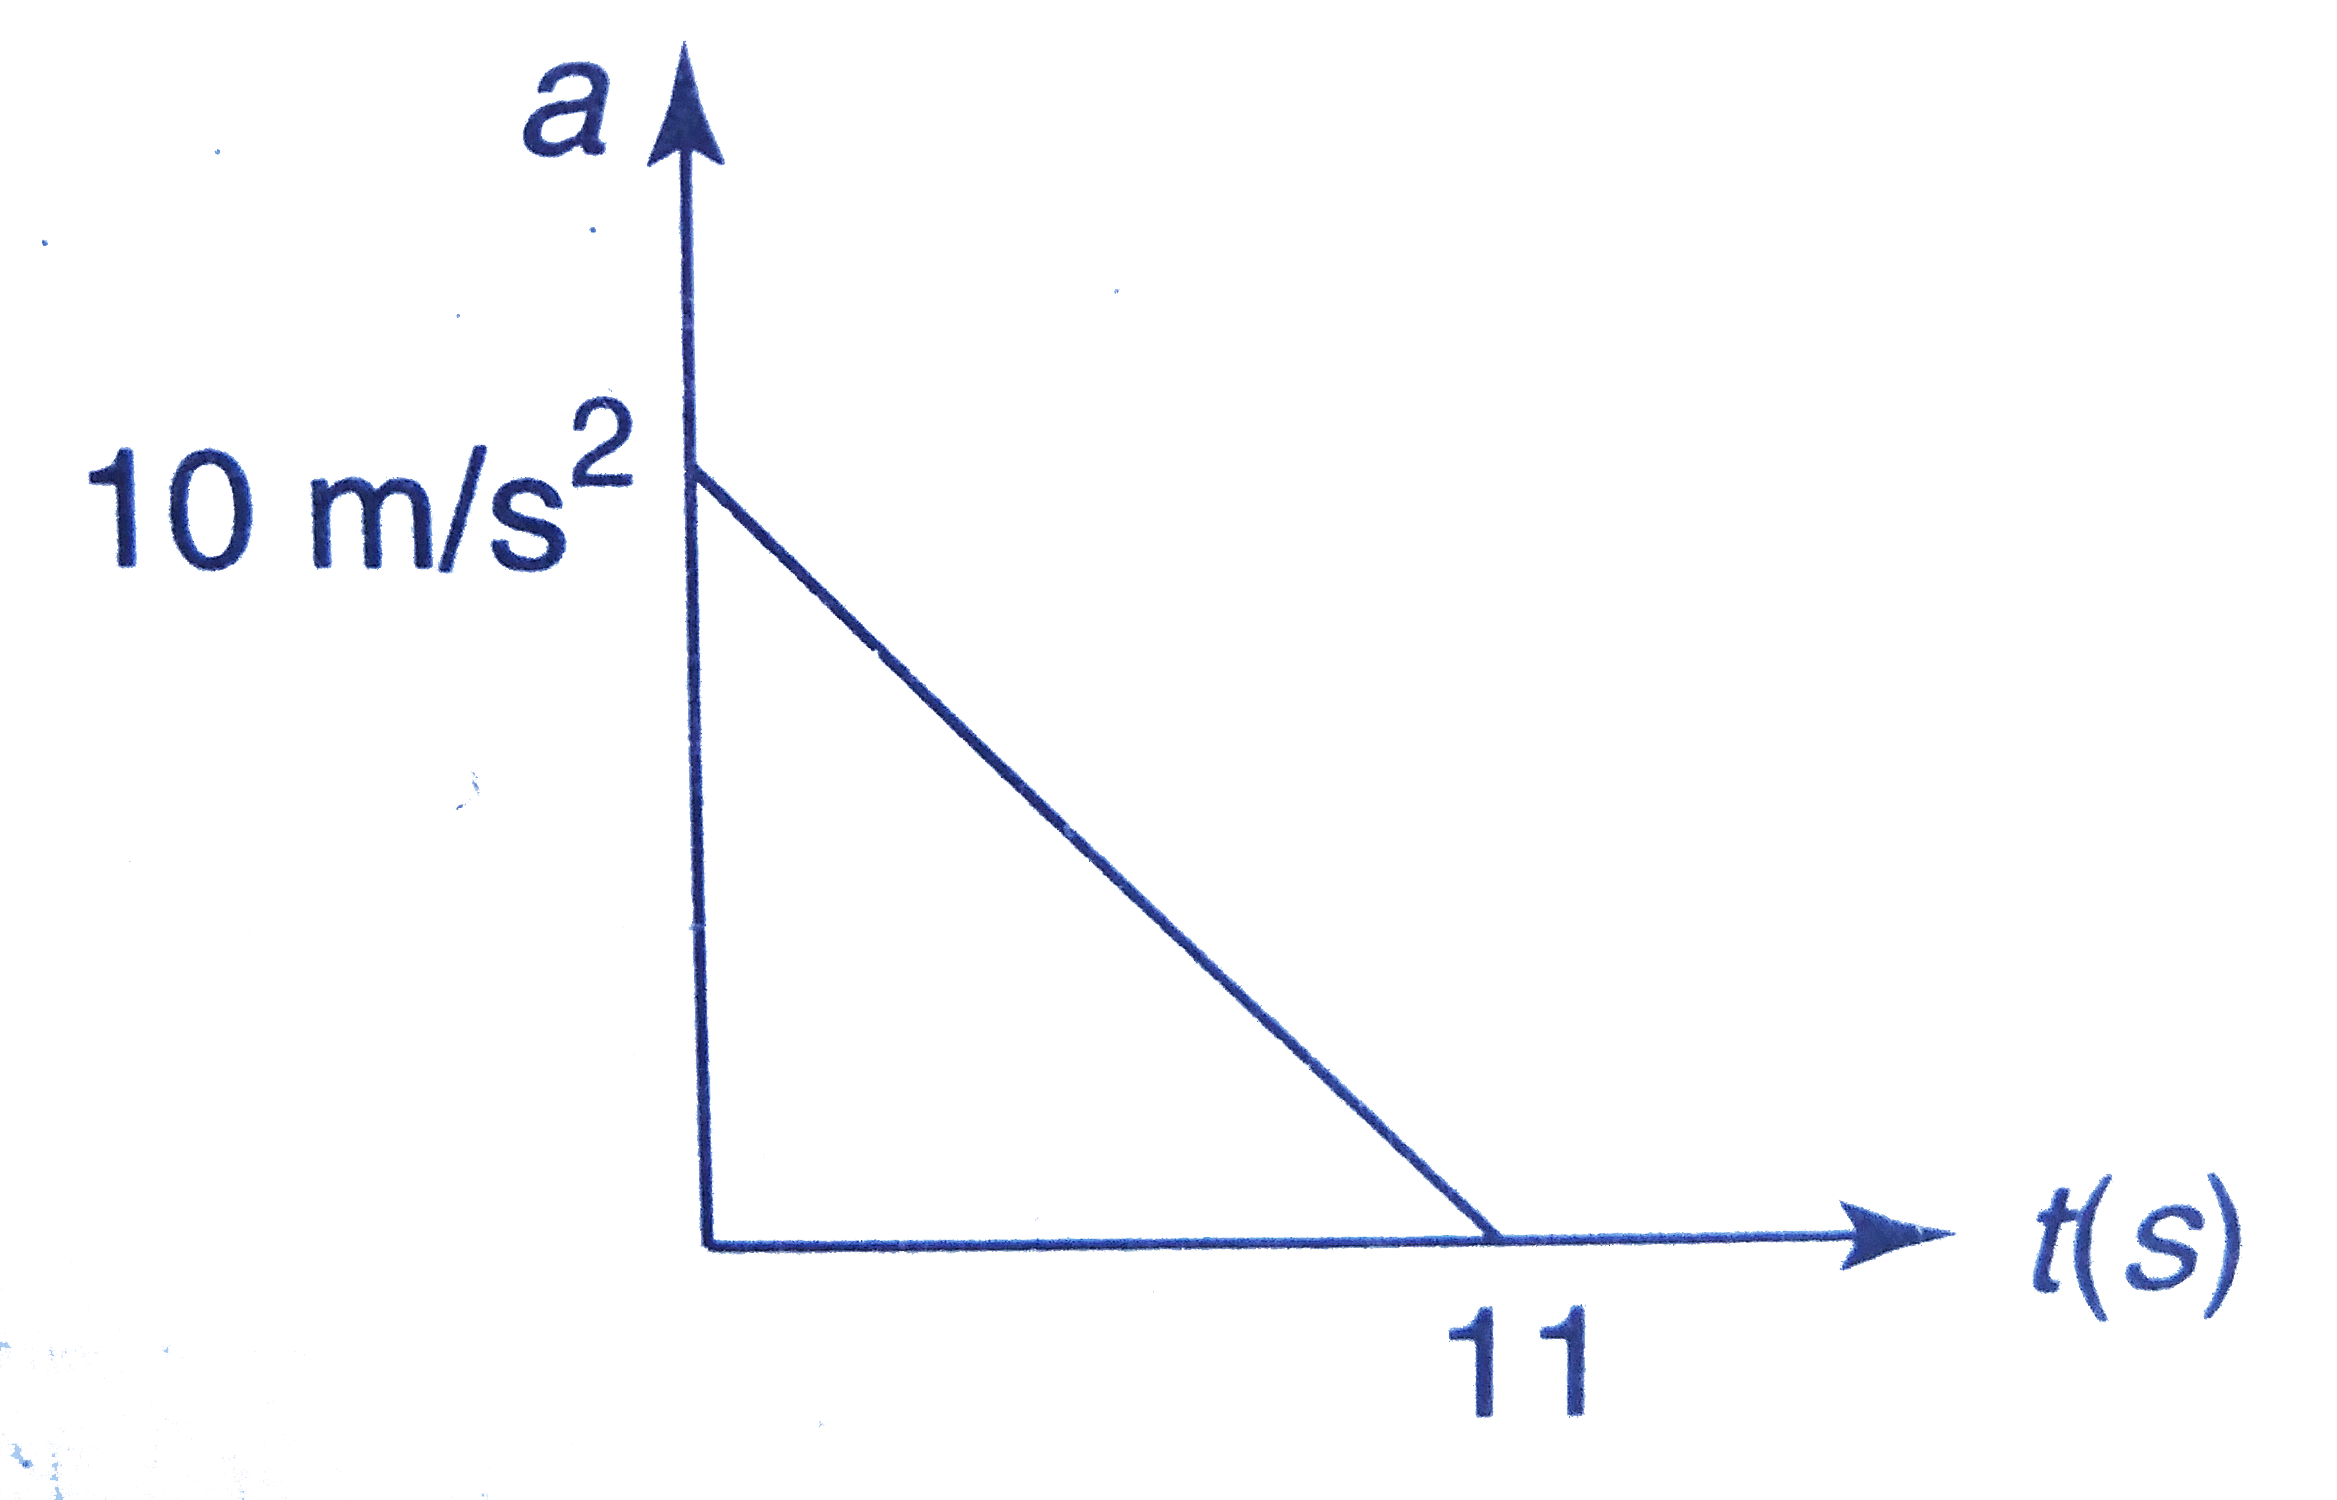
View SolutionA particle starting from rest. Its acceleration (a) versus time (t) is as shown in the figure.
The maximum speed of the particle will be.
 View Solution

