Assertion : In the υ−t diagram as shown in figure, average velocity between the interval t = 0 and t=t0 is independent of t0
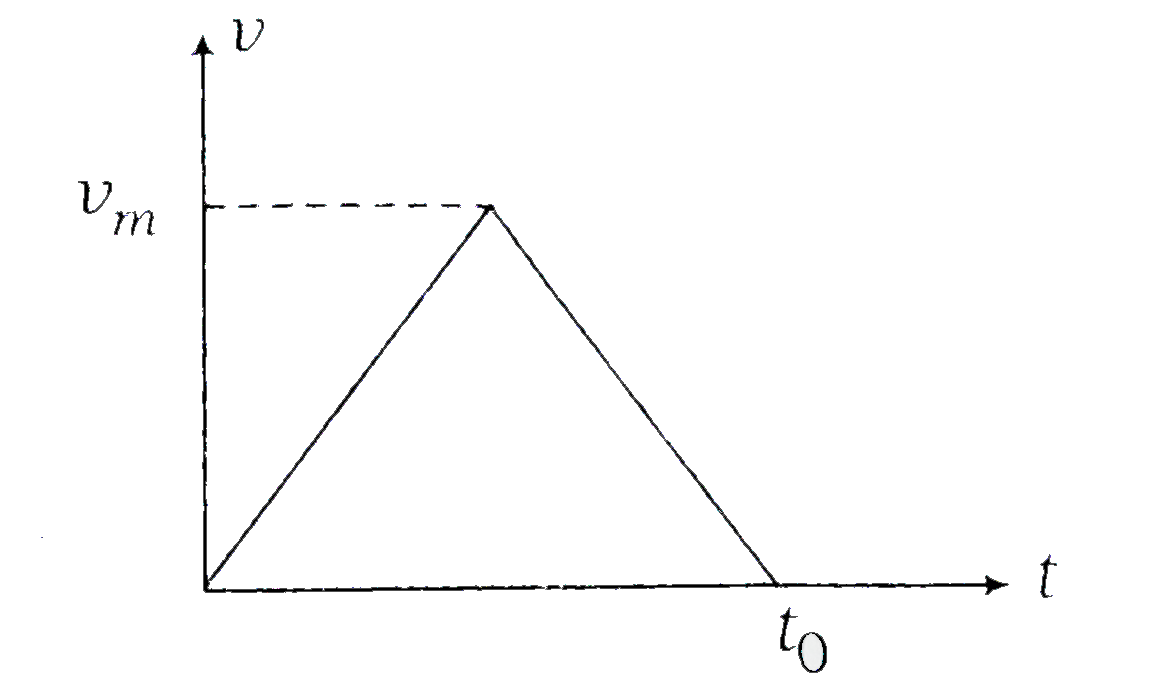
Reason : Average velocity in the given interval is 12υm.
If both Assertion and Reason are correct and Reason is the correct explanation of assertion.
If both Assertion and Reason are correct but Reason in not the correct explanation of Assertion.
If Assertion is true but Reason is false.
If Assertion is false but Reason is true.
The correct Answer is:A
Average velocity =DisplacementTime=Area of υ−t graphTime
(1/2)υmt0t0=12υm
Topper's Solved these Questions
- BOOK - DC PANDEYCHAPTER - MOTION IN A PLANEEXERCISE - (B) Meical entrance special format questions (Mathch the columns)6videos
MOTION IN A PLANE
- BOOK - DC PANDEYCHAPTER - MOTION IN A PLANEEXERCISE - (C )Medical entrances gallery32videos
MOTION IN A PLANE
- BOOK - DC PANDEYCHAPTER - MOTION IN A PLANEEXERCISE - (A) Taking it together75videos
MOTION IN A PLANE
- BOOK - DC PANDEYCHAPTER - MOTIONEXERCISE - Medical entrances gallery19videos
MOTION
- BOOK - DC PANDEYCHAPTER - PROJECTILE MOTIONEXERCISE - Level - 2 Subjective10videos
PROJECTILE MOTION
Similar Questions
Find average speed in time interval t= 2 to t=10s
View SolutionThe v-t graph for a particle moving along x-axis is shown in the figure, find
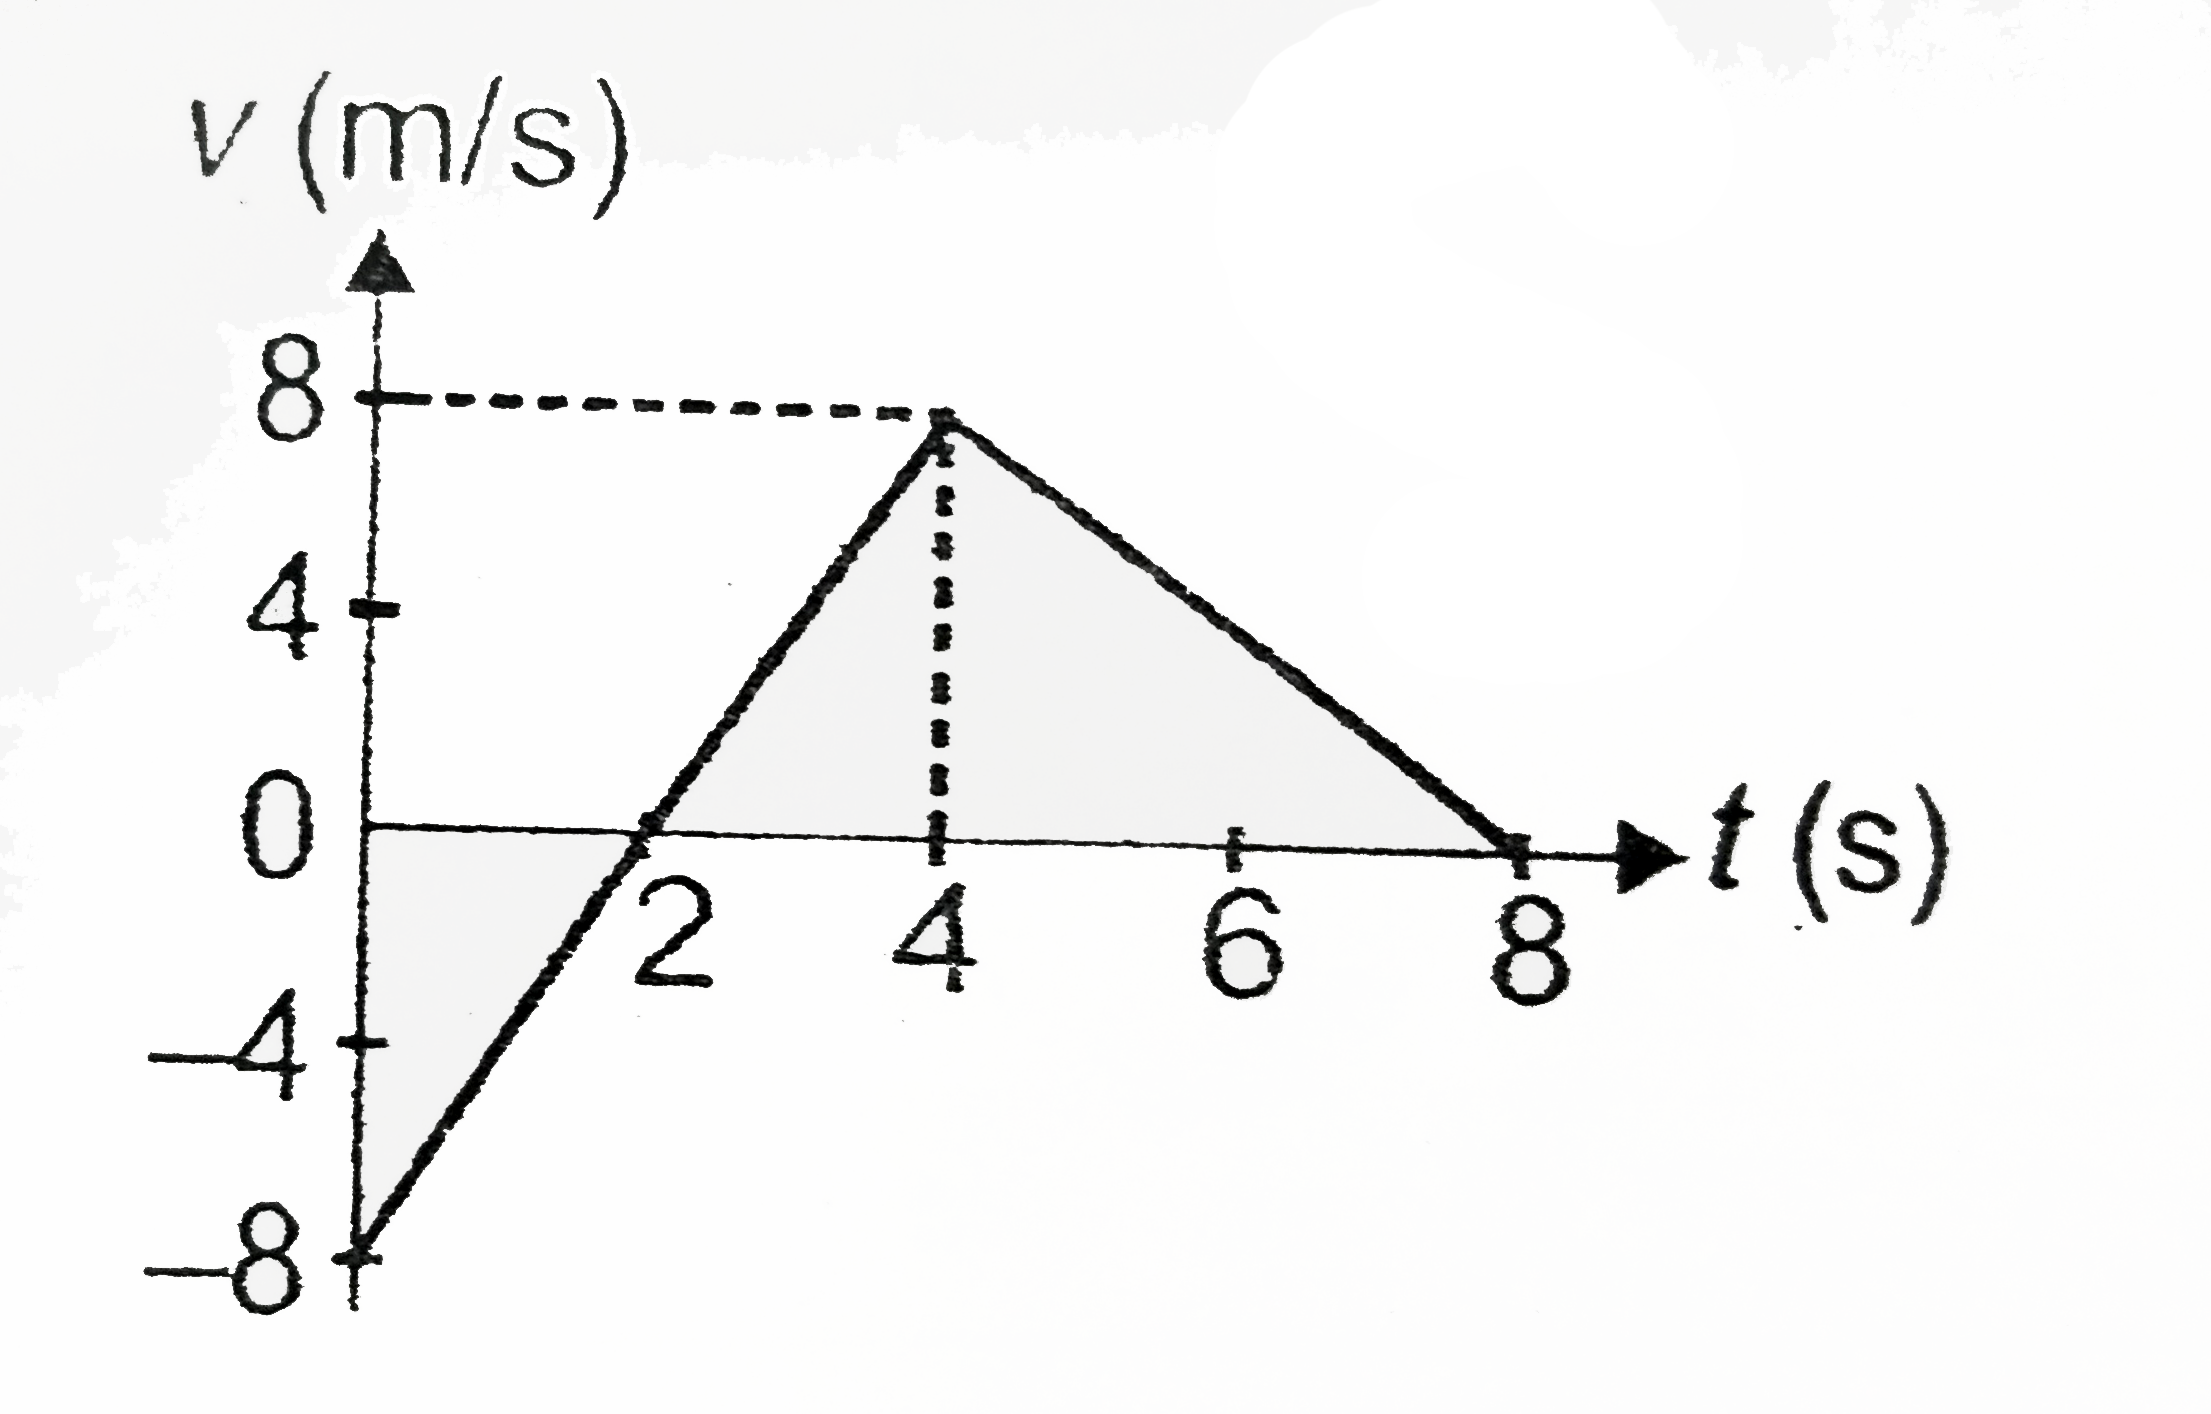
(a) Average velocity in the interval 0 to 8 s.
(b) Average speed in the interval 0 to 8 s.
(c) Average acceleration in the interval 0 to 4 s.
(d) Instantaneous acceleration at t = 2.5 s.View Solution
Knowledge Check
- Question 1 - Select One
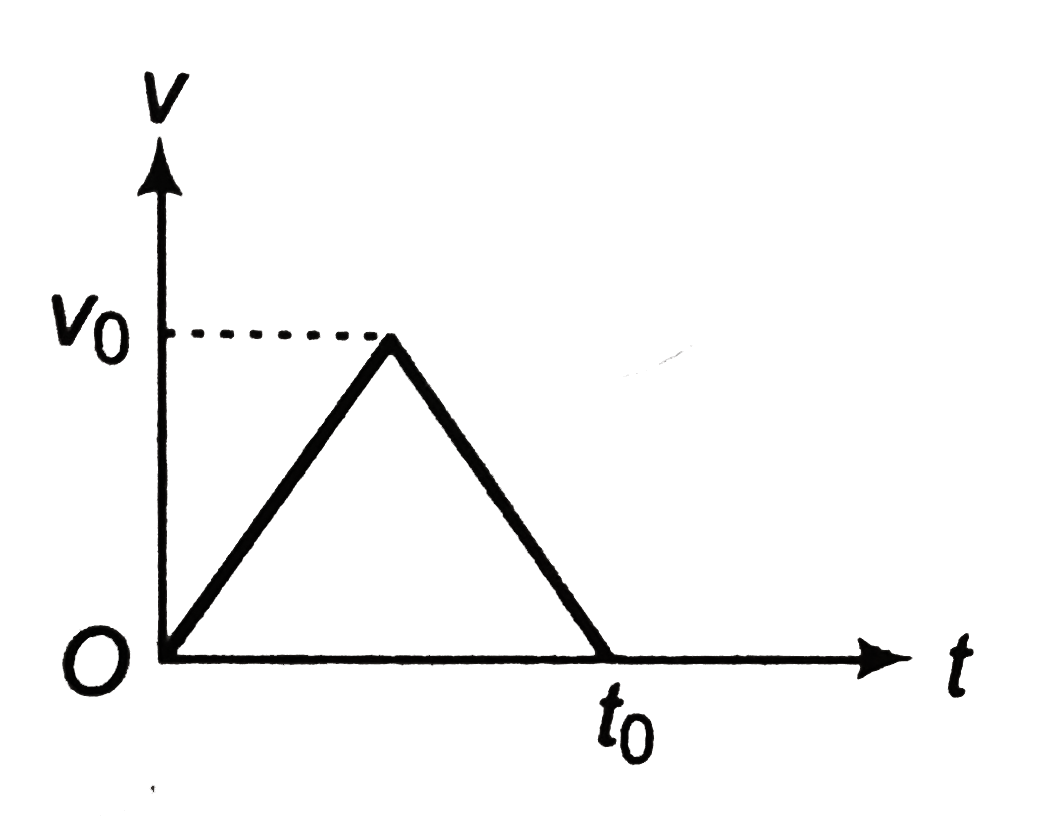
Assertion : In v-t graph shown in figure, average velocity in time interval from 0→t0 depends only on v0. It is independent of t0.
Reason : In the given time interval average velocity is v02.
 AIf the both Assertion and Reason are true and the Reason is correct explanation of the Assertion.BIf both Assertion and Reason are true but Reason is not the correct explanation of Assertion.CIf Assertion is true, but the Reason is false.DIf Assertion is false but the Reason is true.
 - Question 2 - Select One
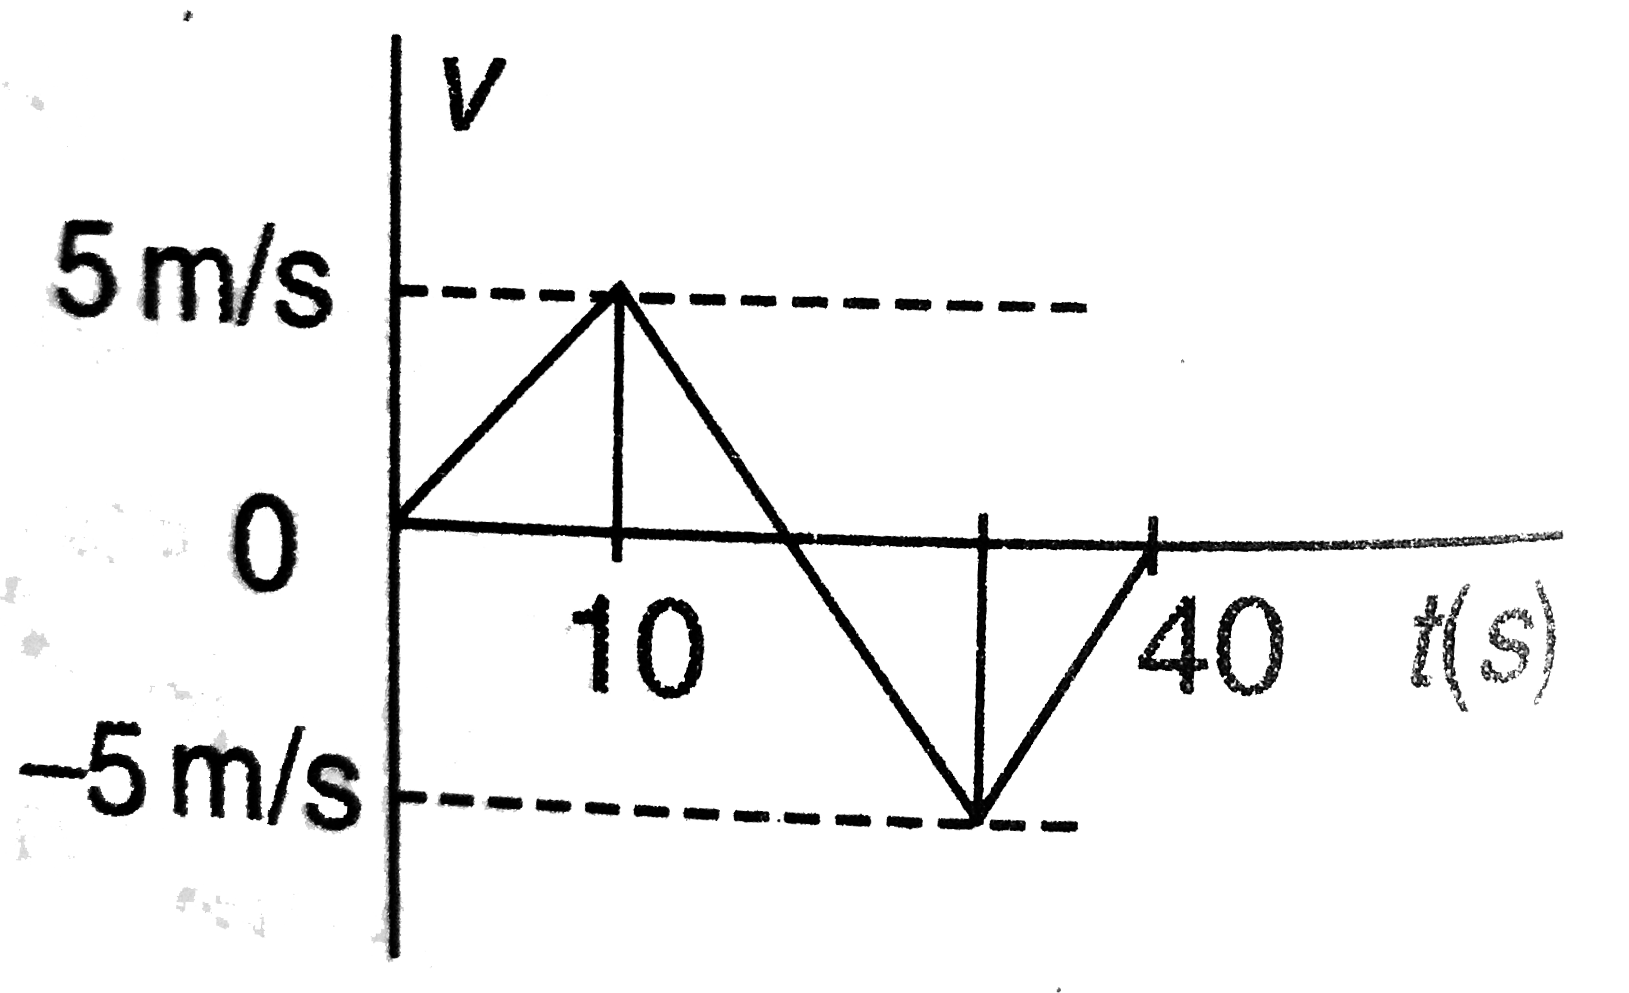
The velocity-time plot is shown in figure. Find the average speed in time interval t=0 to t=40s during the period.
 AzeroB2.5m/sC5m/sDnone
 - Question 3 - Select One
Assertion : In the s-t diagram as shown in figure, the body starts moving in positive direction but not form s = 0.

Reason : At t=t0, velocity of body changes its direction of motion.AIf both Assertion and Reason are correct and Reason is the correct explanation of assertion.BIf both Assertion and Reason are correct but Reason in not the correct explanation of Assertion.CIf Assertion is true but Reason is false.DIf Assertion is false but Reason is true.
A particle move with a velocity v=αt3 along a straight line.The average velocity in time interval t=0 to t=T is
View SolutionFor body moving with uniform acceleration a, initial and final velocities in a time interval t are u and v respectively. Then its average velocity in the time interval t is
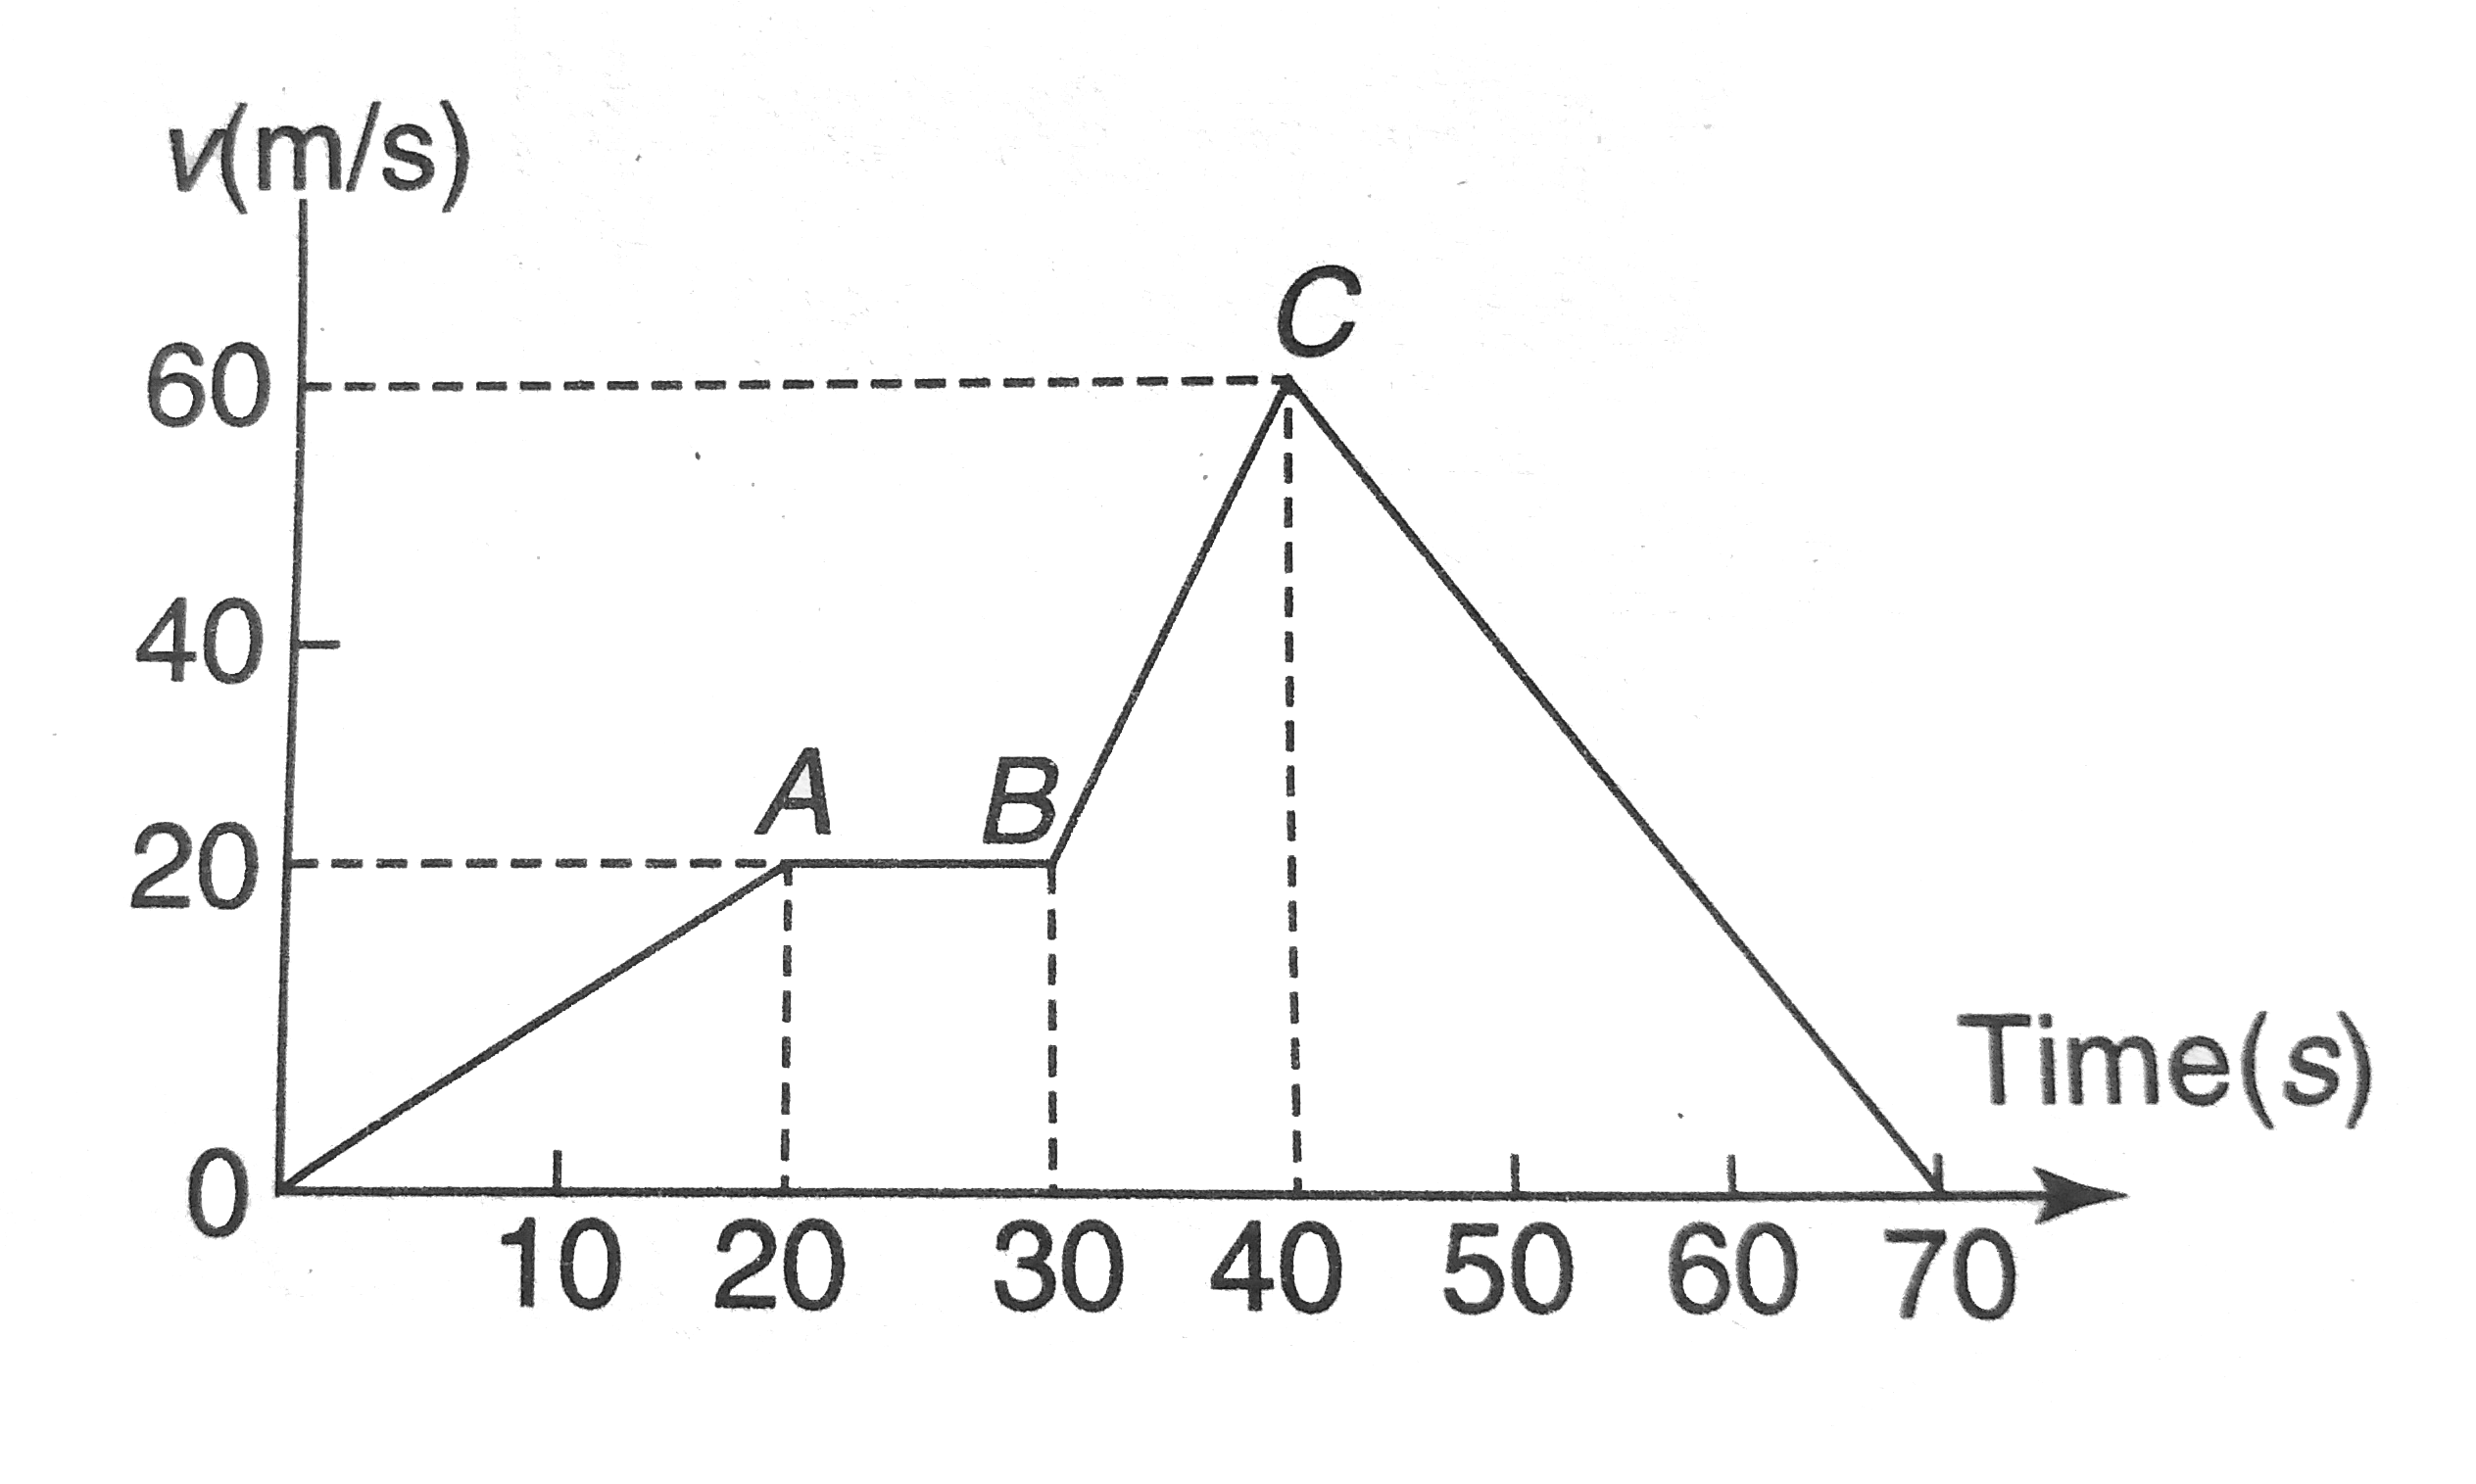
View SolutionThe velocity-time graph of a body is given below. Find the average velocity from t=0 to t=40s.
 View Solution
Velocity-time graph of a particle moving in a straight line is shown in figure. In the time interval from t = 0 to t = 14 s, find:
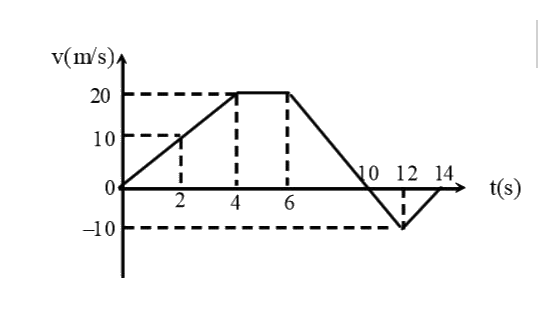
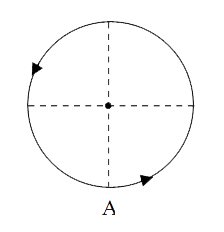
Q. average velocity andView SolutionA particle is describing uniform circular motion in the anti-clockwise sense such that its time period of revolution is T. At t = 0 the particle is observed to be at A. If θ1 be the angle
between acceleration vector at t=T4 and average velocity vector in the time interval 0 to T/4 and θ2 be the angle between acceleration vector at t=T4 and the vector representing change in velocity in the time interval 0 to T/4, then :
 View Solution

