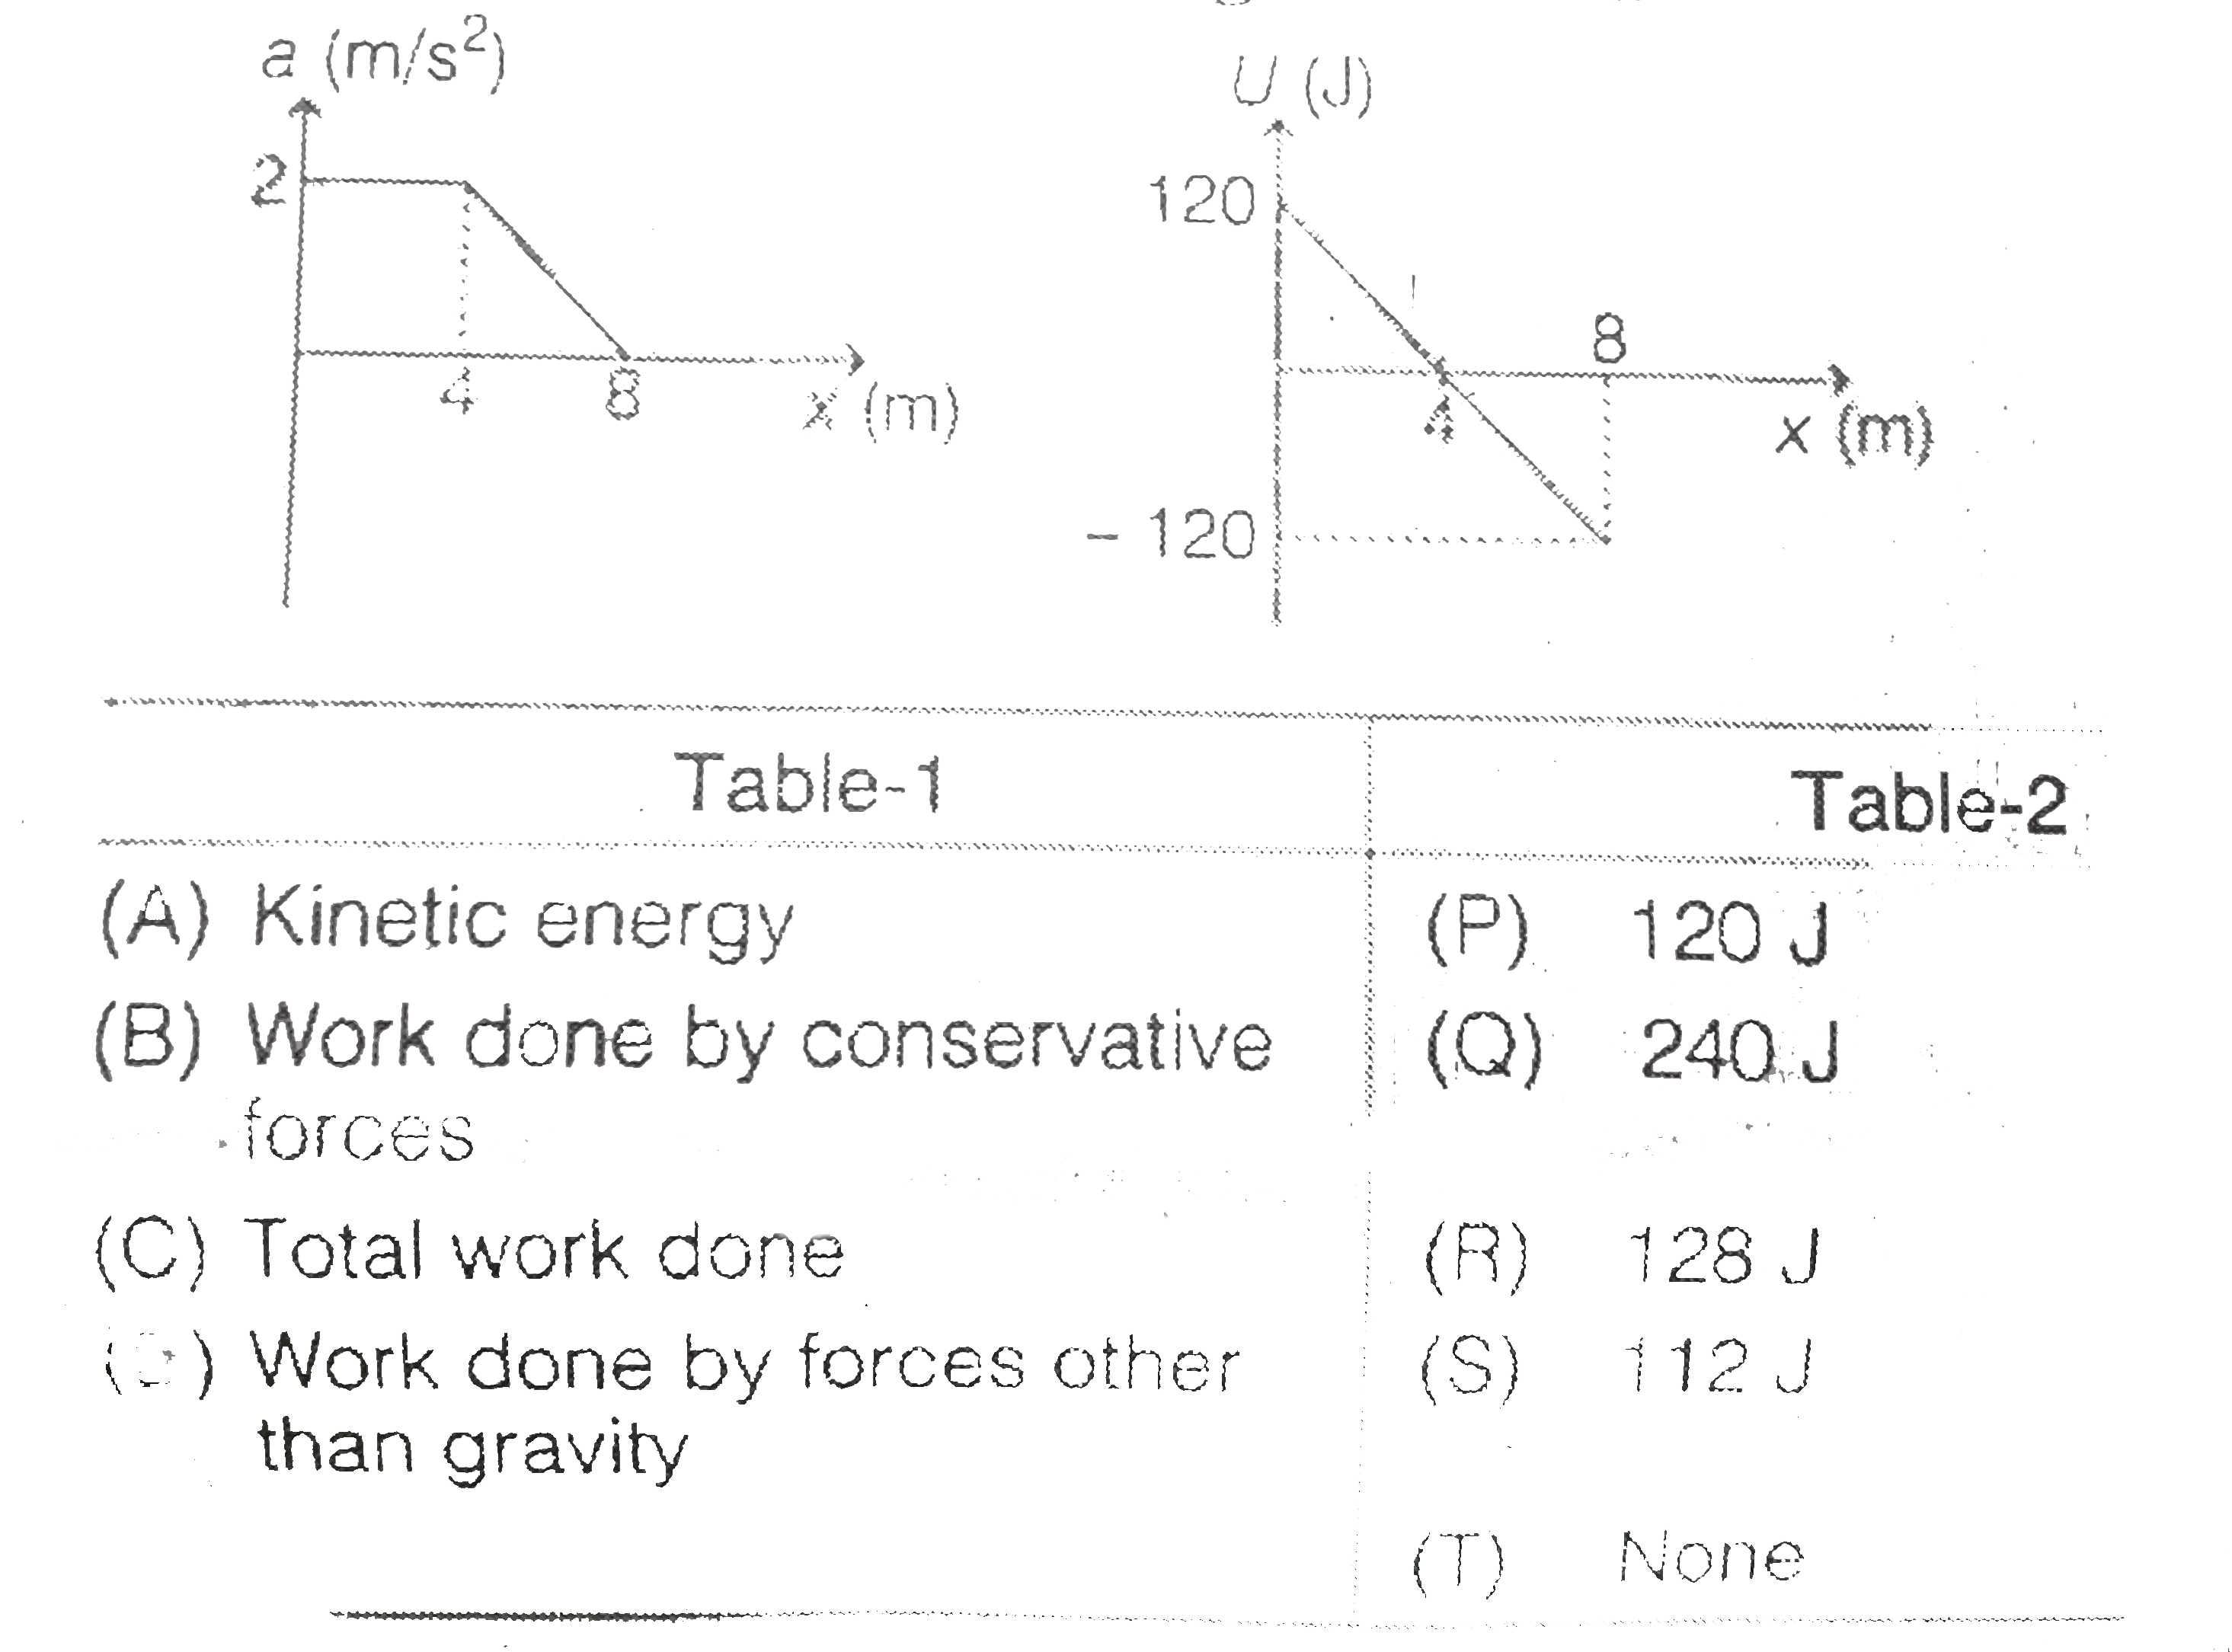
Acceleration versus x and potential energy versus x graph of a particle moving along x-axis is as shown in figure. Mass of the particle is 1 kg and velocity at x = 0 is . Match the following at x = 8 m.
The correct Answer is:
=area of a-s graph=12
Work done by all the forces
Work done conservative forces
Work done by external force
=total work done -work done by conservative forces
=-112J
Topper's Solved these Questions
- WORK, ENERGY AND POWERBOOK - DC PANDEYCHAPTER - WORK, ENERGY AND POWEREXERCISE - MEDICAL ENTRACES GALLERY
33 Videos
- WORK, ENERGY AND POWERBOOK - DC PANDEYCHAPTER - WORK, ENERGY AND POWEREXERCISE - MEDICAL ENTRANCE SPECIAL QUESTIONS
16 Videos
- WORK, ENERGY & POWERBOOK - DC PANDEYCHAPTER - WORK, ENERGY & POWEREXERCISE - Level 2 Comprehension Based
2 Videos
- WORK, POWER AND ENERGYBOOK - DC PANDEYCHAPTER - WORK, POWER AND ENERGYEXERCISE - E Integer Type Questions
11 Videos
Similar Questions
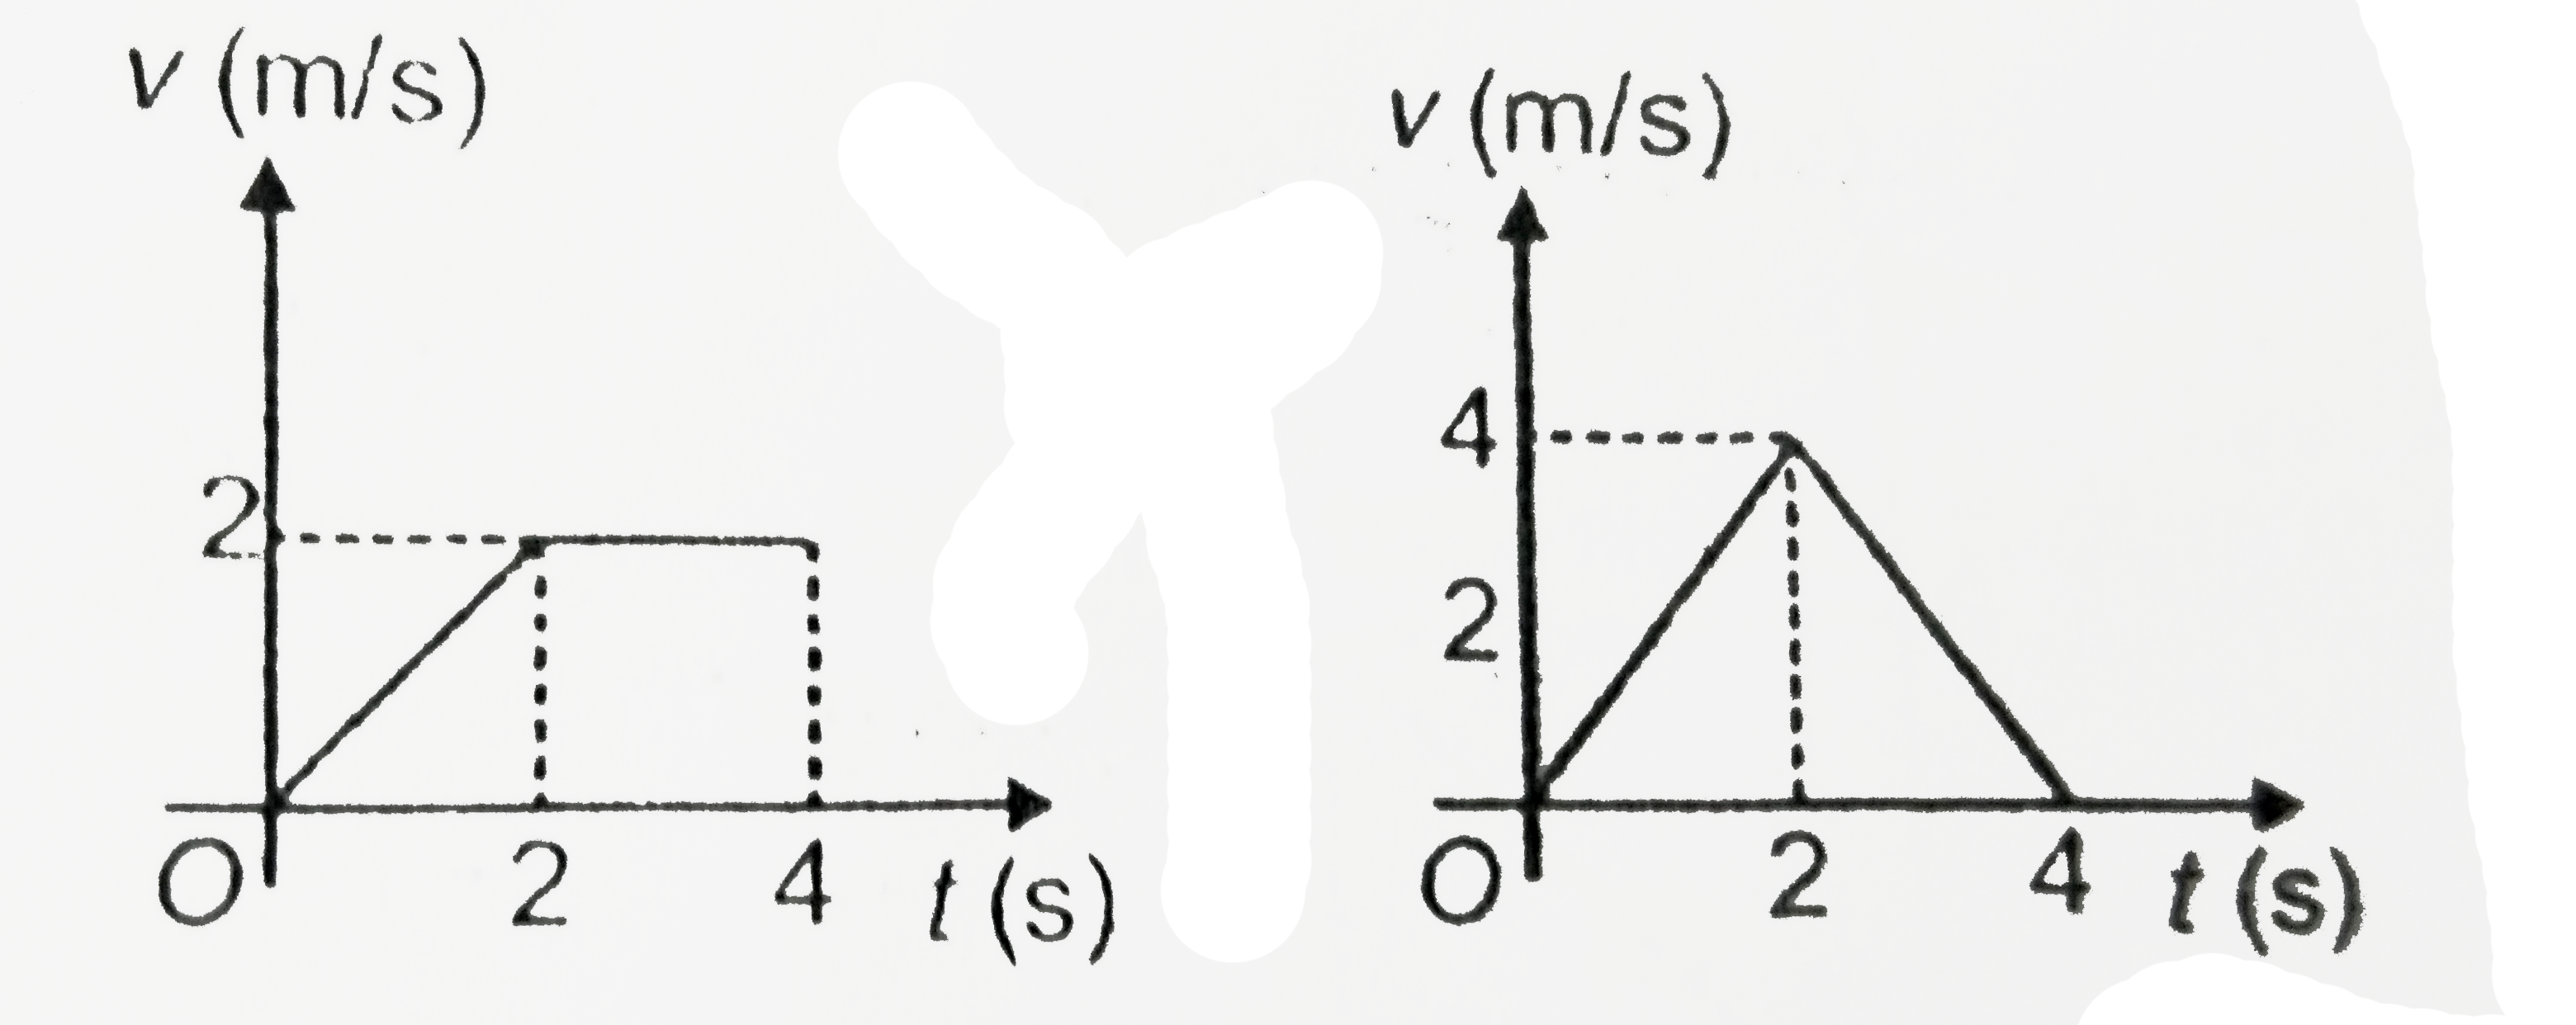
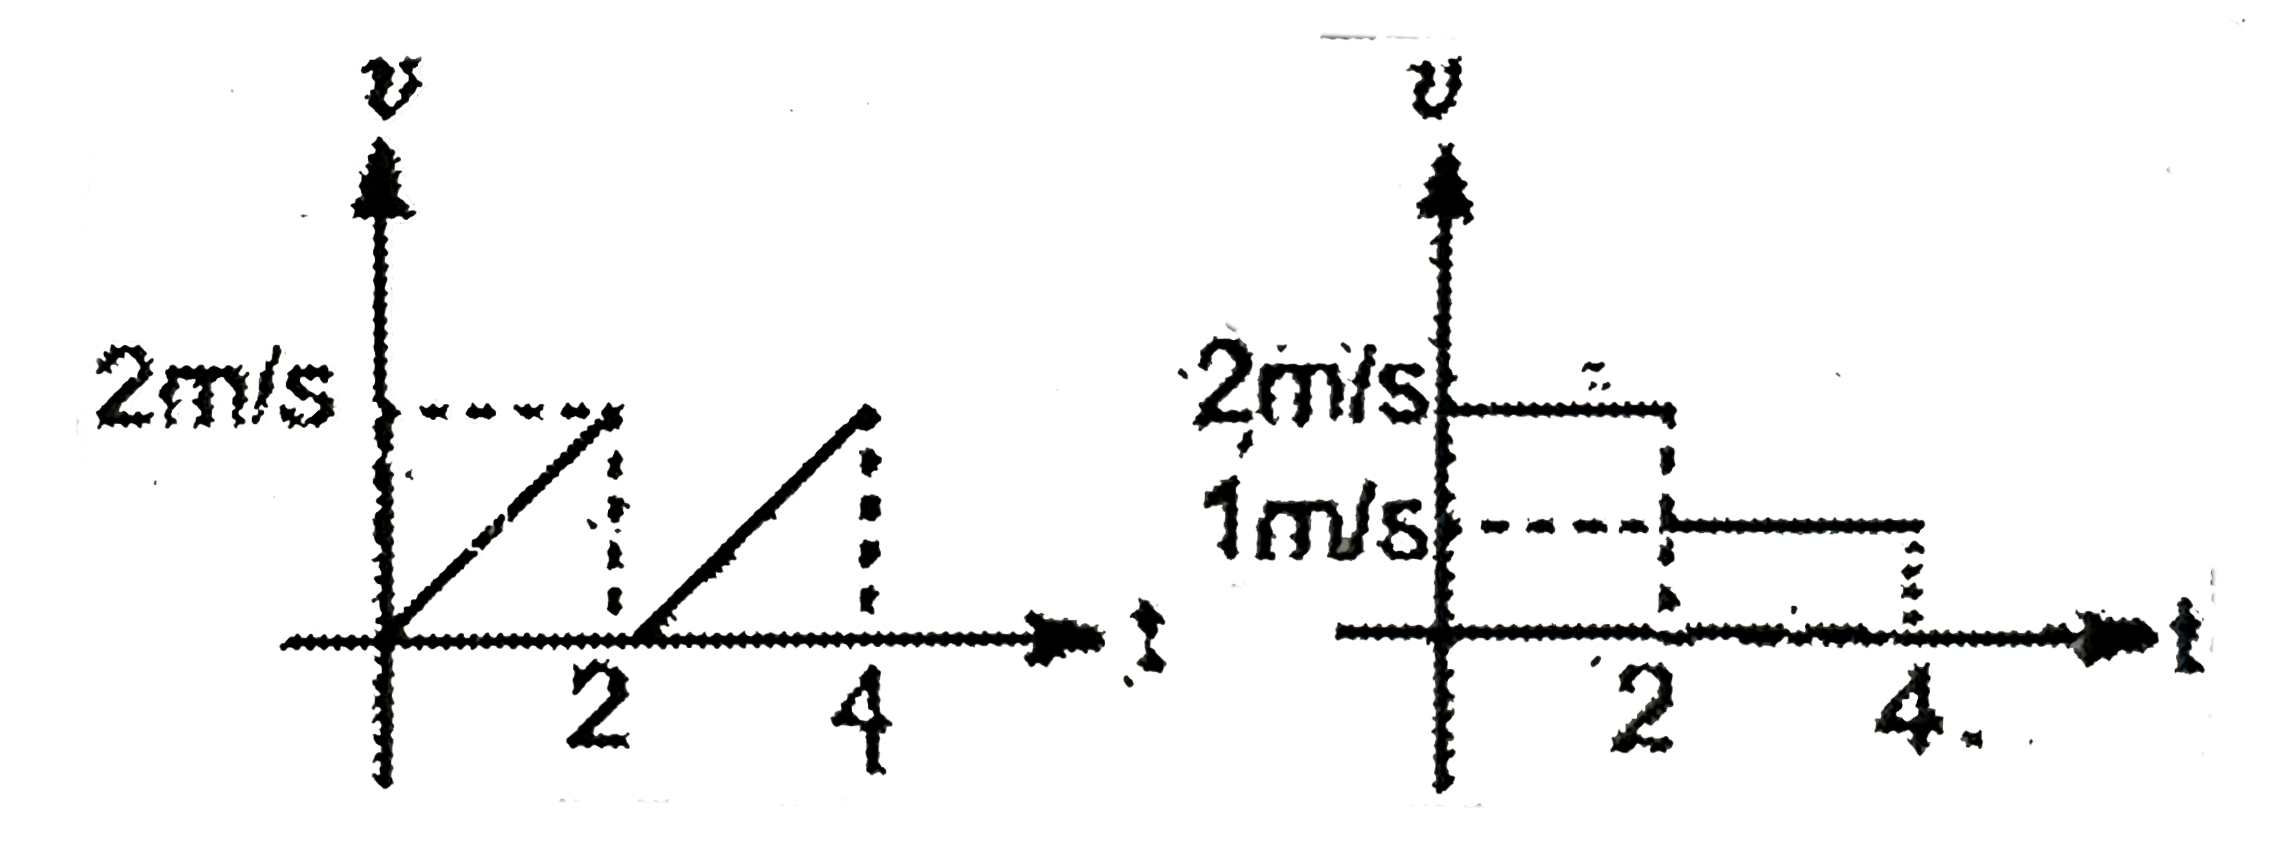
The velocity versus time graph of two particles moving along x-axis varies are shown in the following two plots. Then
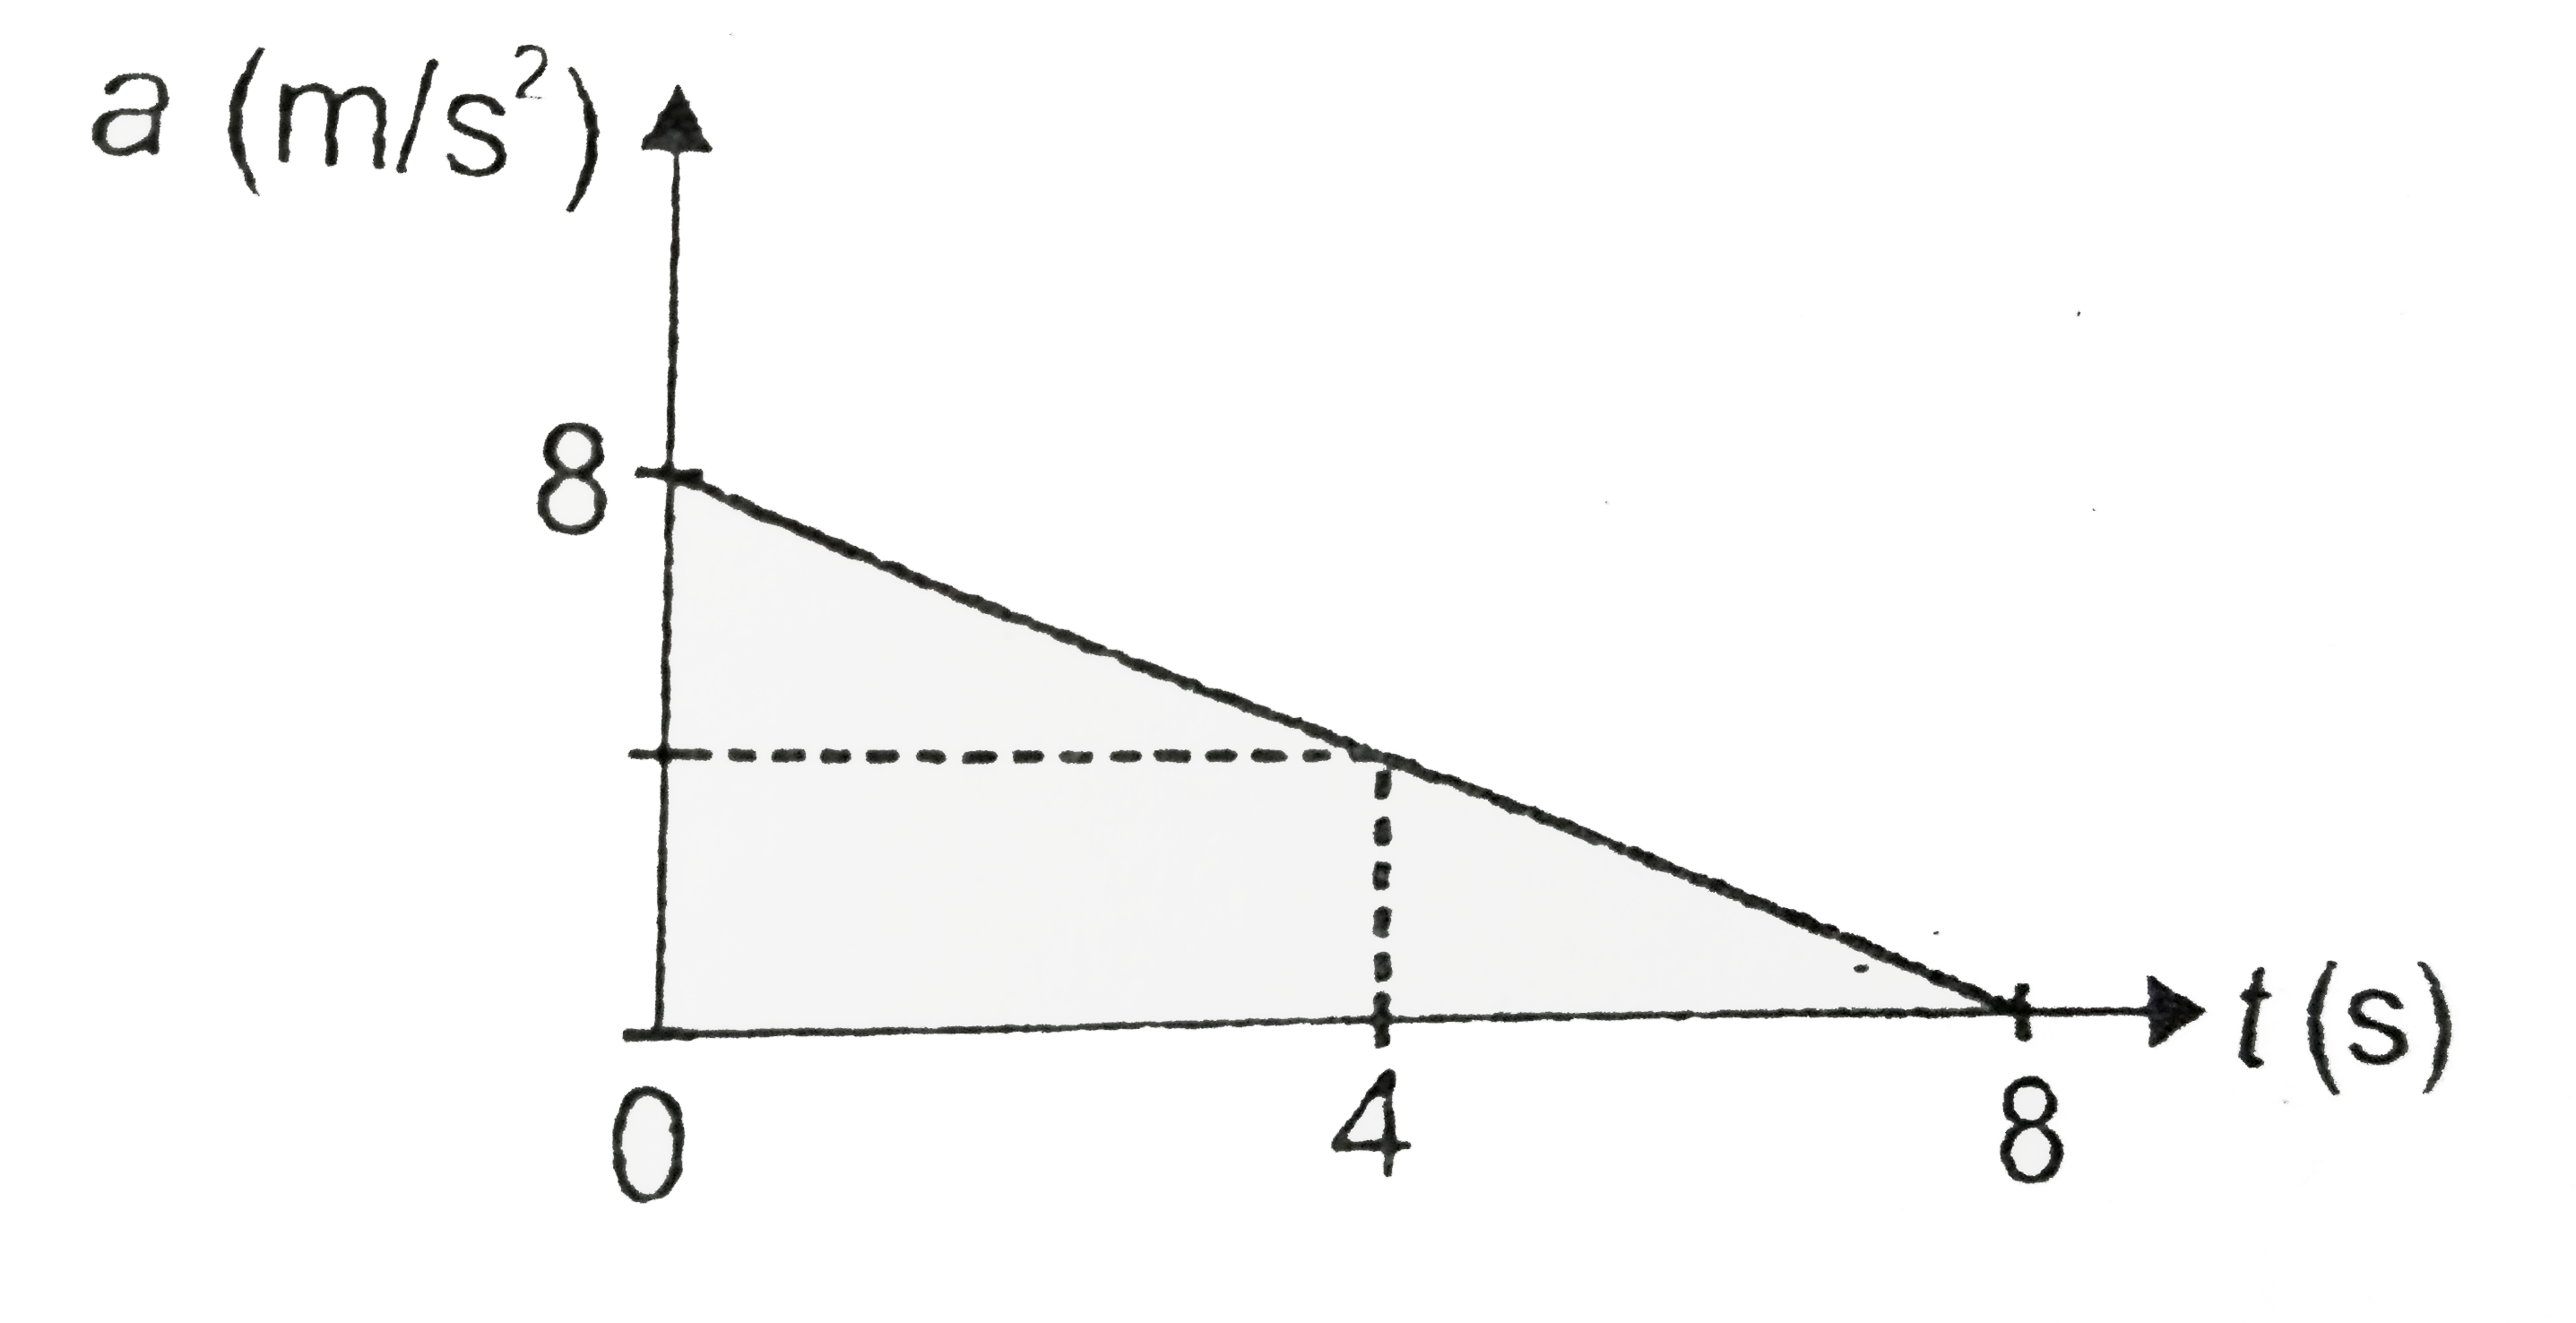
View SolutionThe acceleration-time graph of a particle moving along x-axis is shown in the figure. If the particle starts with velocity 3 m/s at t = 0, find the velocity of particle at t = 4 s.
View Solution
Knowledge Check
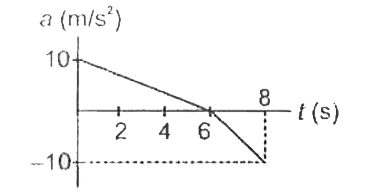
The acceleration - time graph for a particle moving along x - axis is shown in figure, If the initial velocity of particle is −5m/s, the velocity at t = 8 s is
 A+15m/sB+20m/sC−15m/sD−20m/s
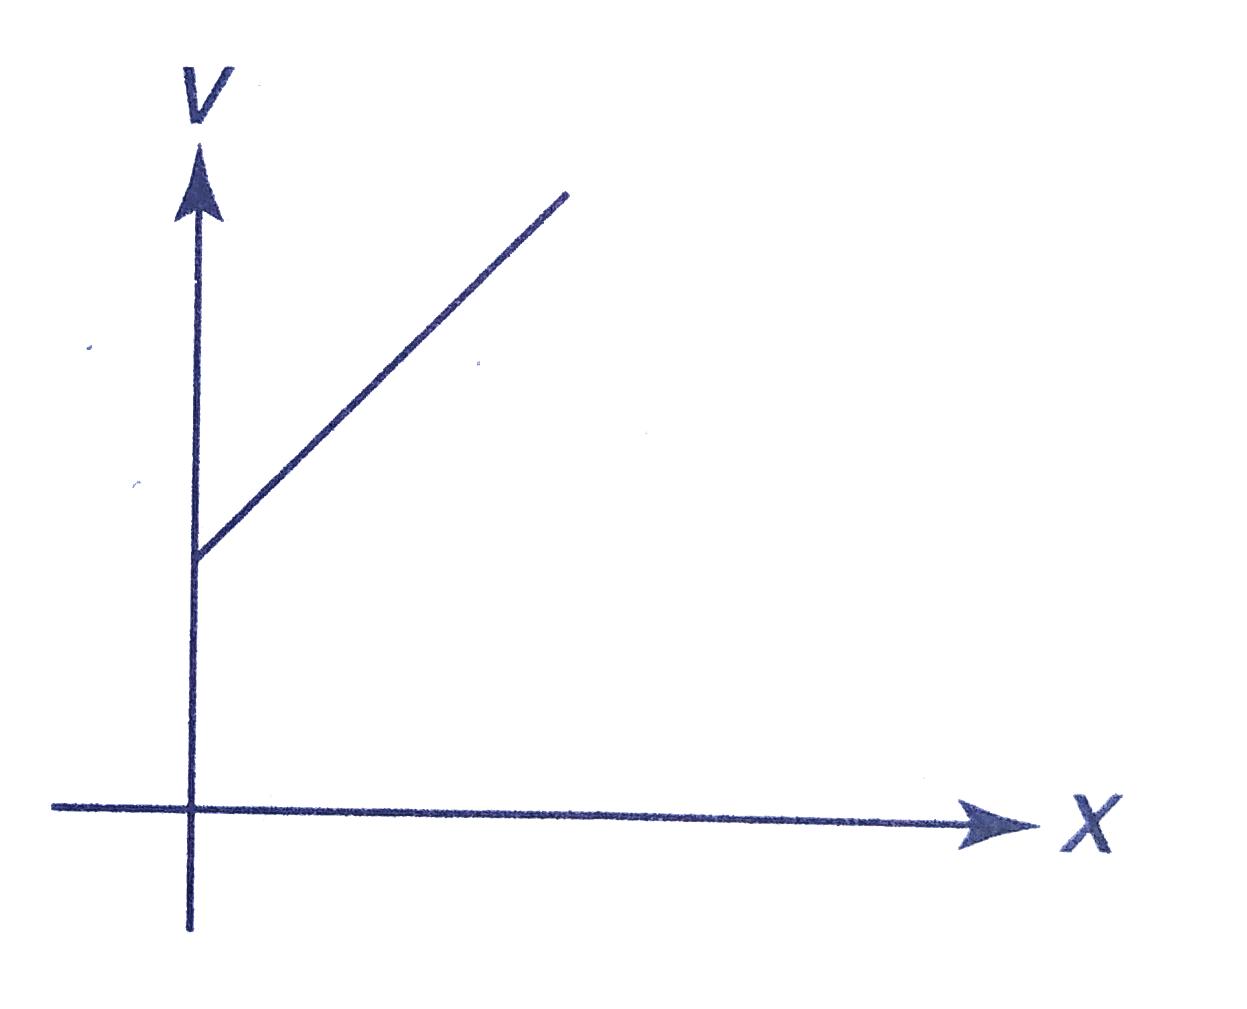
Velocity versus displacement graph of a particle moving in a straight line as shown in figure.
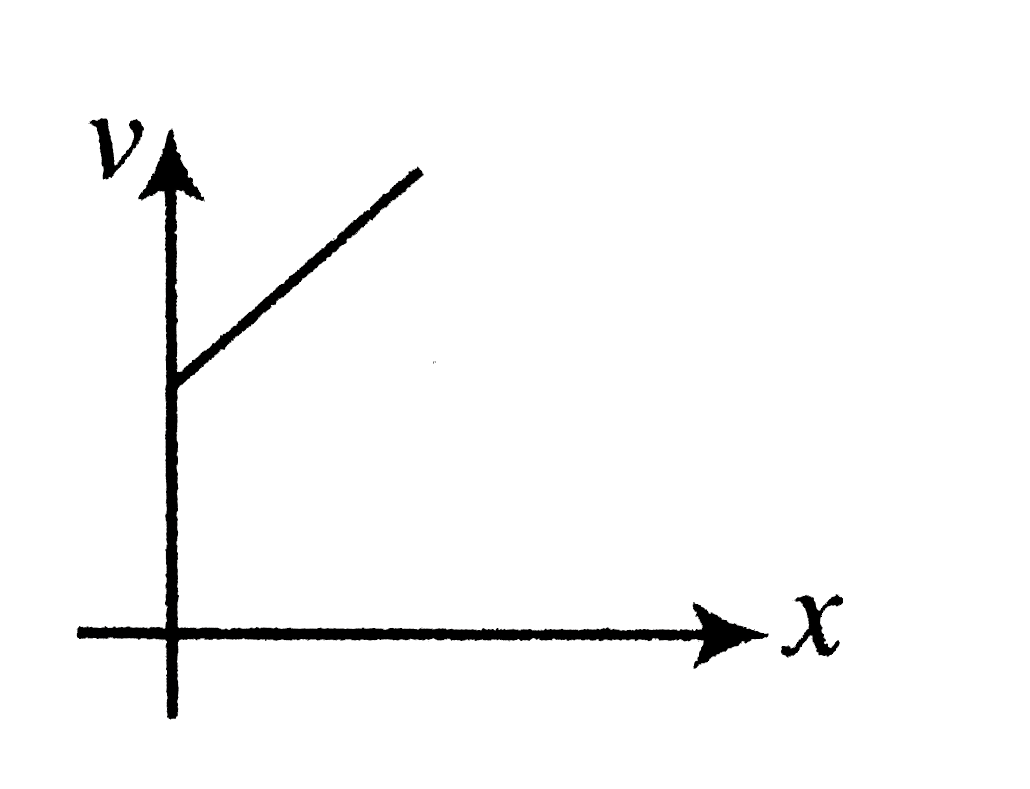
The acceleration of the particle.Ais constantBincreases linearly with xCincreases parabolically with xDNone of theseFor a particle moving along x-axis, a scaled x-6 graph is shown in figure. Mark the correct statement (s).
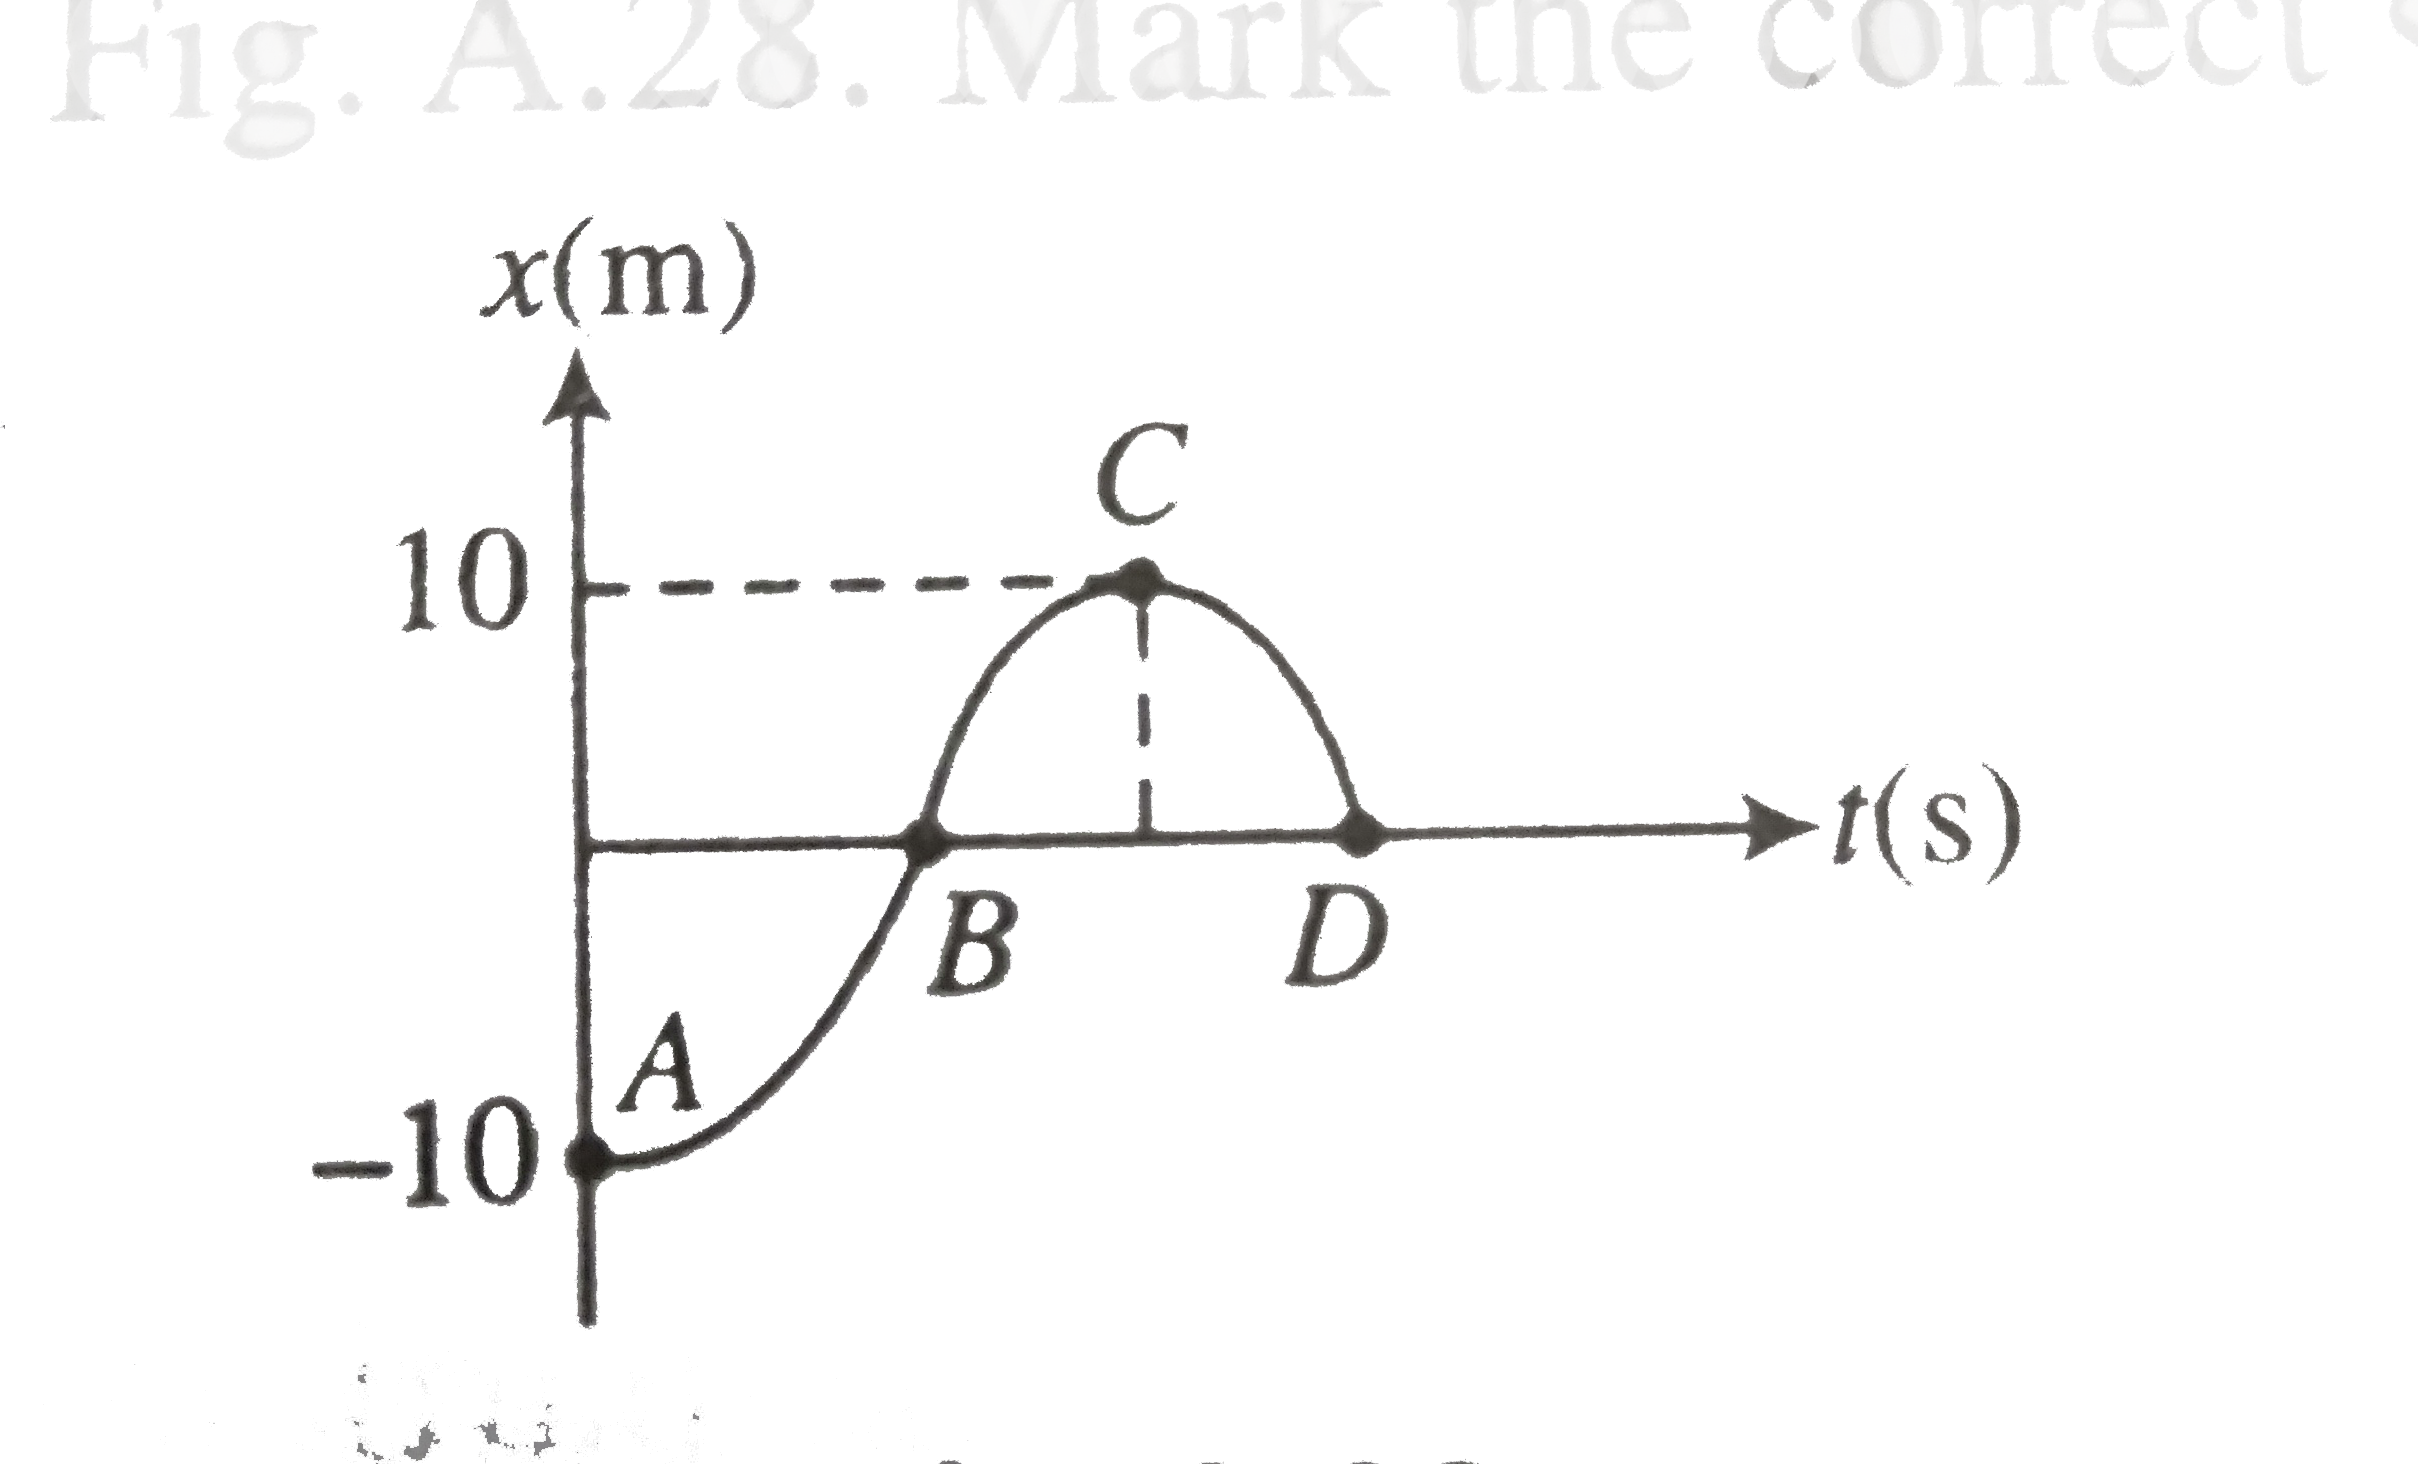 ASpeed of the particle is greatest at C.BSpeed of the particle is greatest at B.CParticle is speeding up in region marked CD.DParticle is speeding up in region marked AB.
The position (X)-time (t) graph for a particle of mass 1 kg moving along x-axis is shown in figure. Find impulse on particle at t = 4 s.
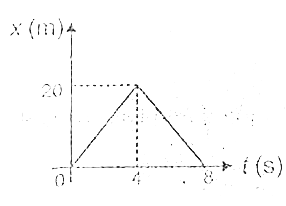
View SolutionFor a particle moving along x-axis, velocity-time graph is as shown in figure. Find the displacement of the particle?
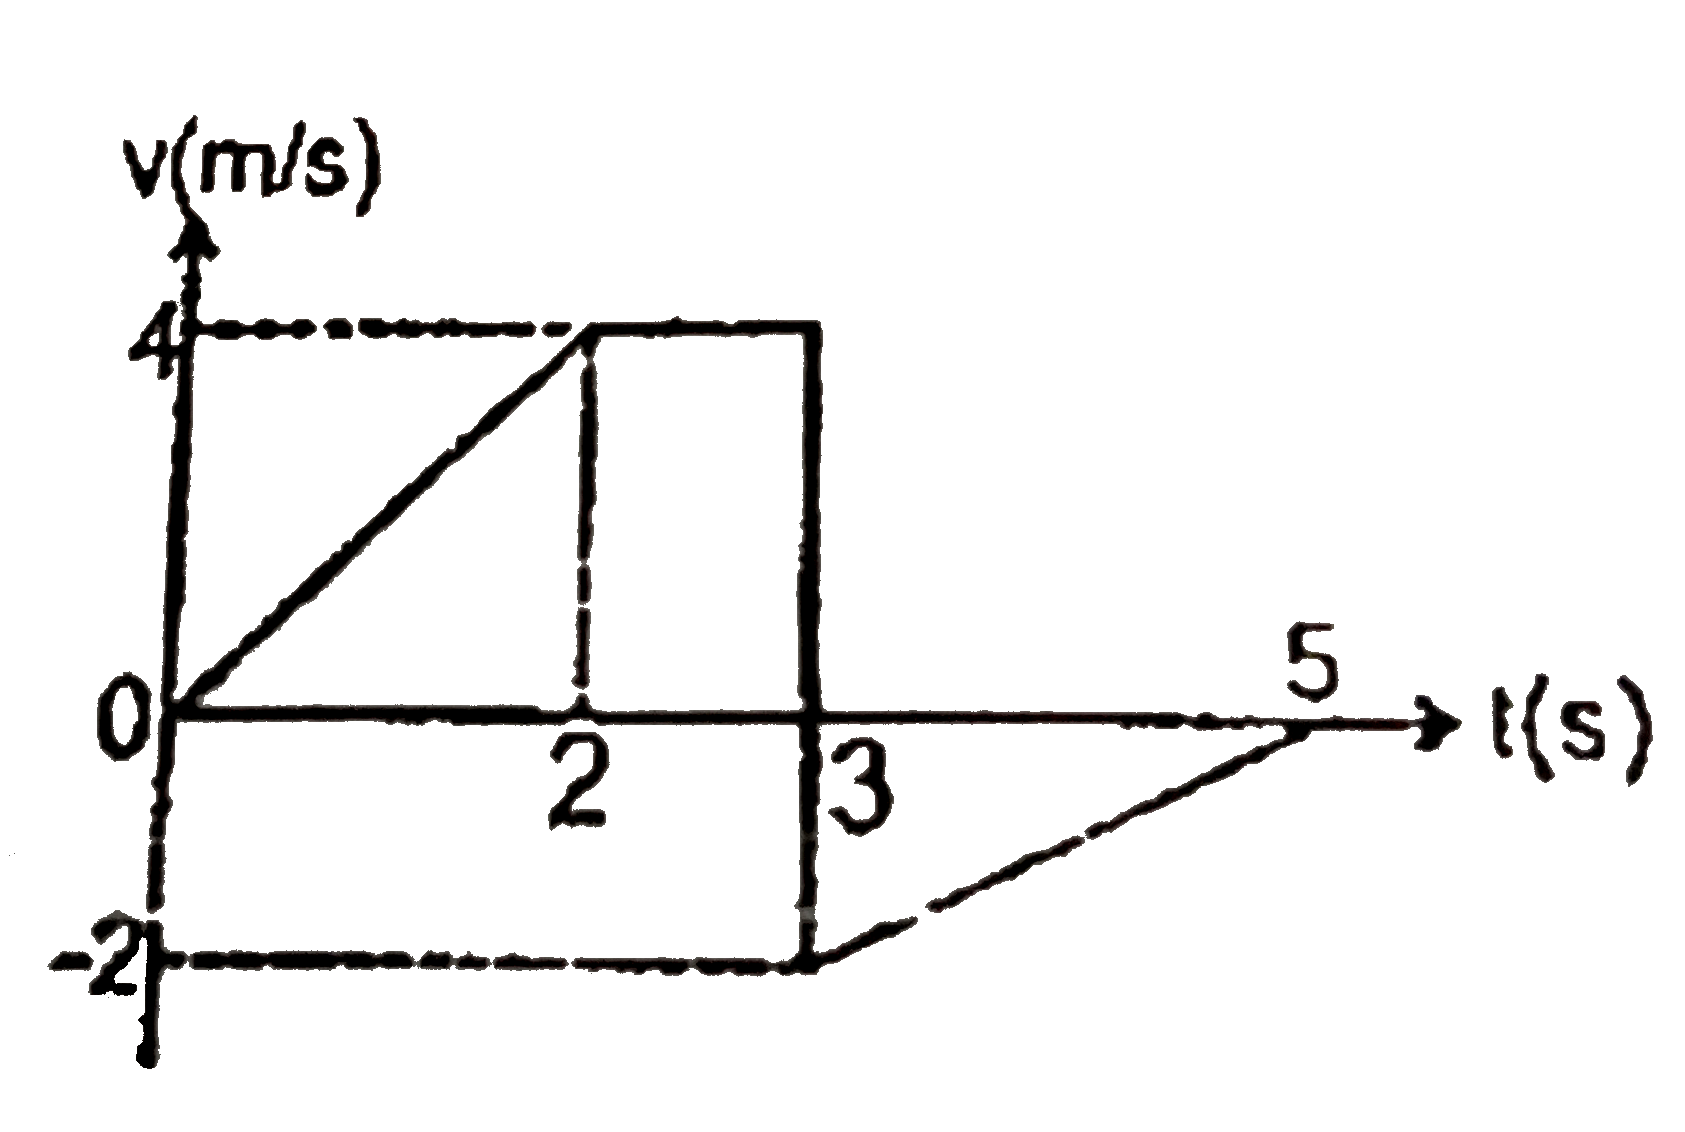
View SolutionThe velocity versus time of two particles moving along x-axis varies as shown in the following two plots. Then
View SolutionGraph of velocity versus displacement of a particle moving in a straight line is as shown in figure.
The acceleration of the particle is.
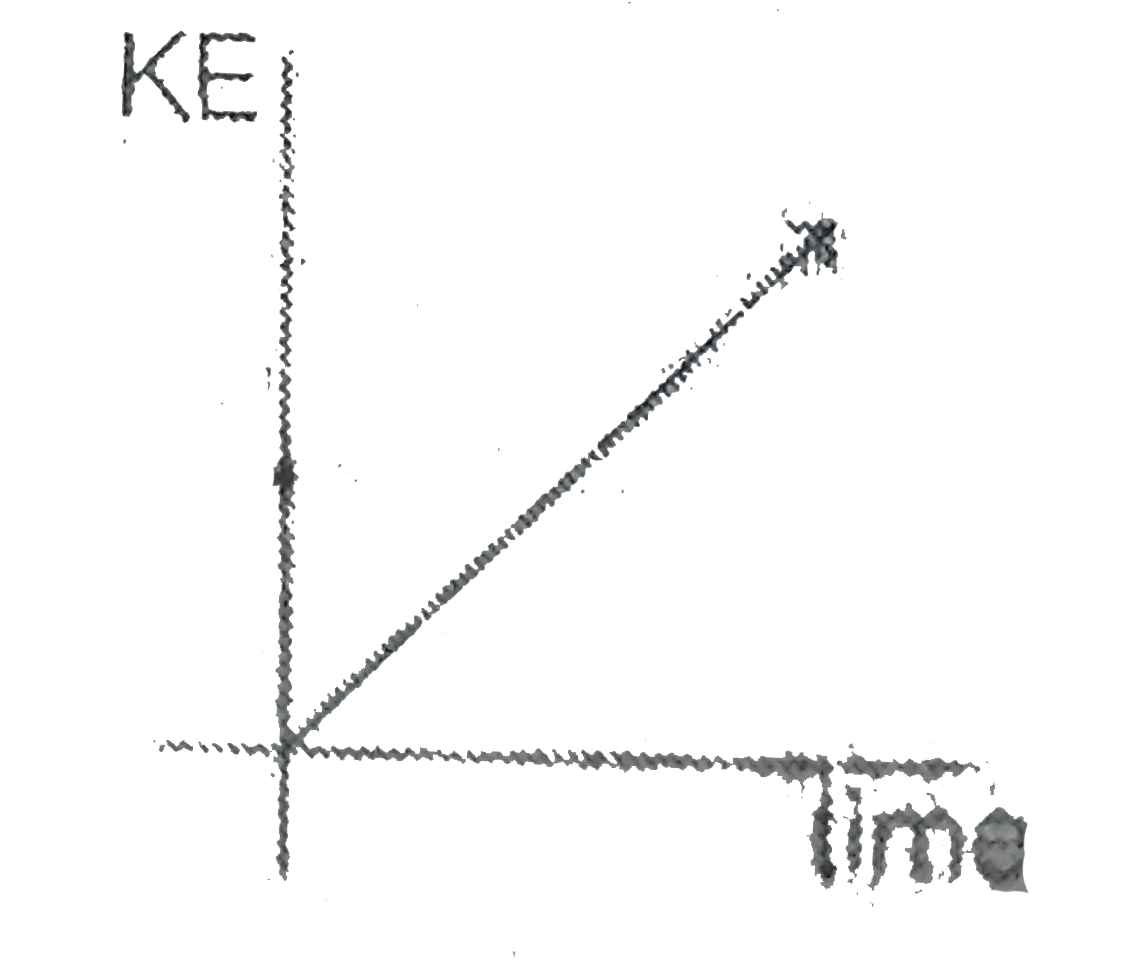
View SolutionThe kinetic energy (KE) versus time graph for a particle moving along a straight line is as shown in the figure. The force versus time graph for the particle may be
View Solution
