In the following figure the energy levels of hydrogen atom have been shown along with some transitions marked A, B,C,D and E. The transitions A,B and C respectively represent: 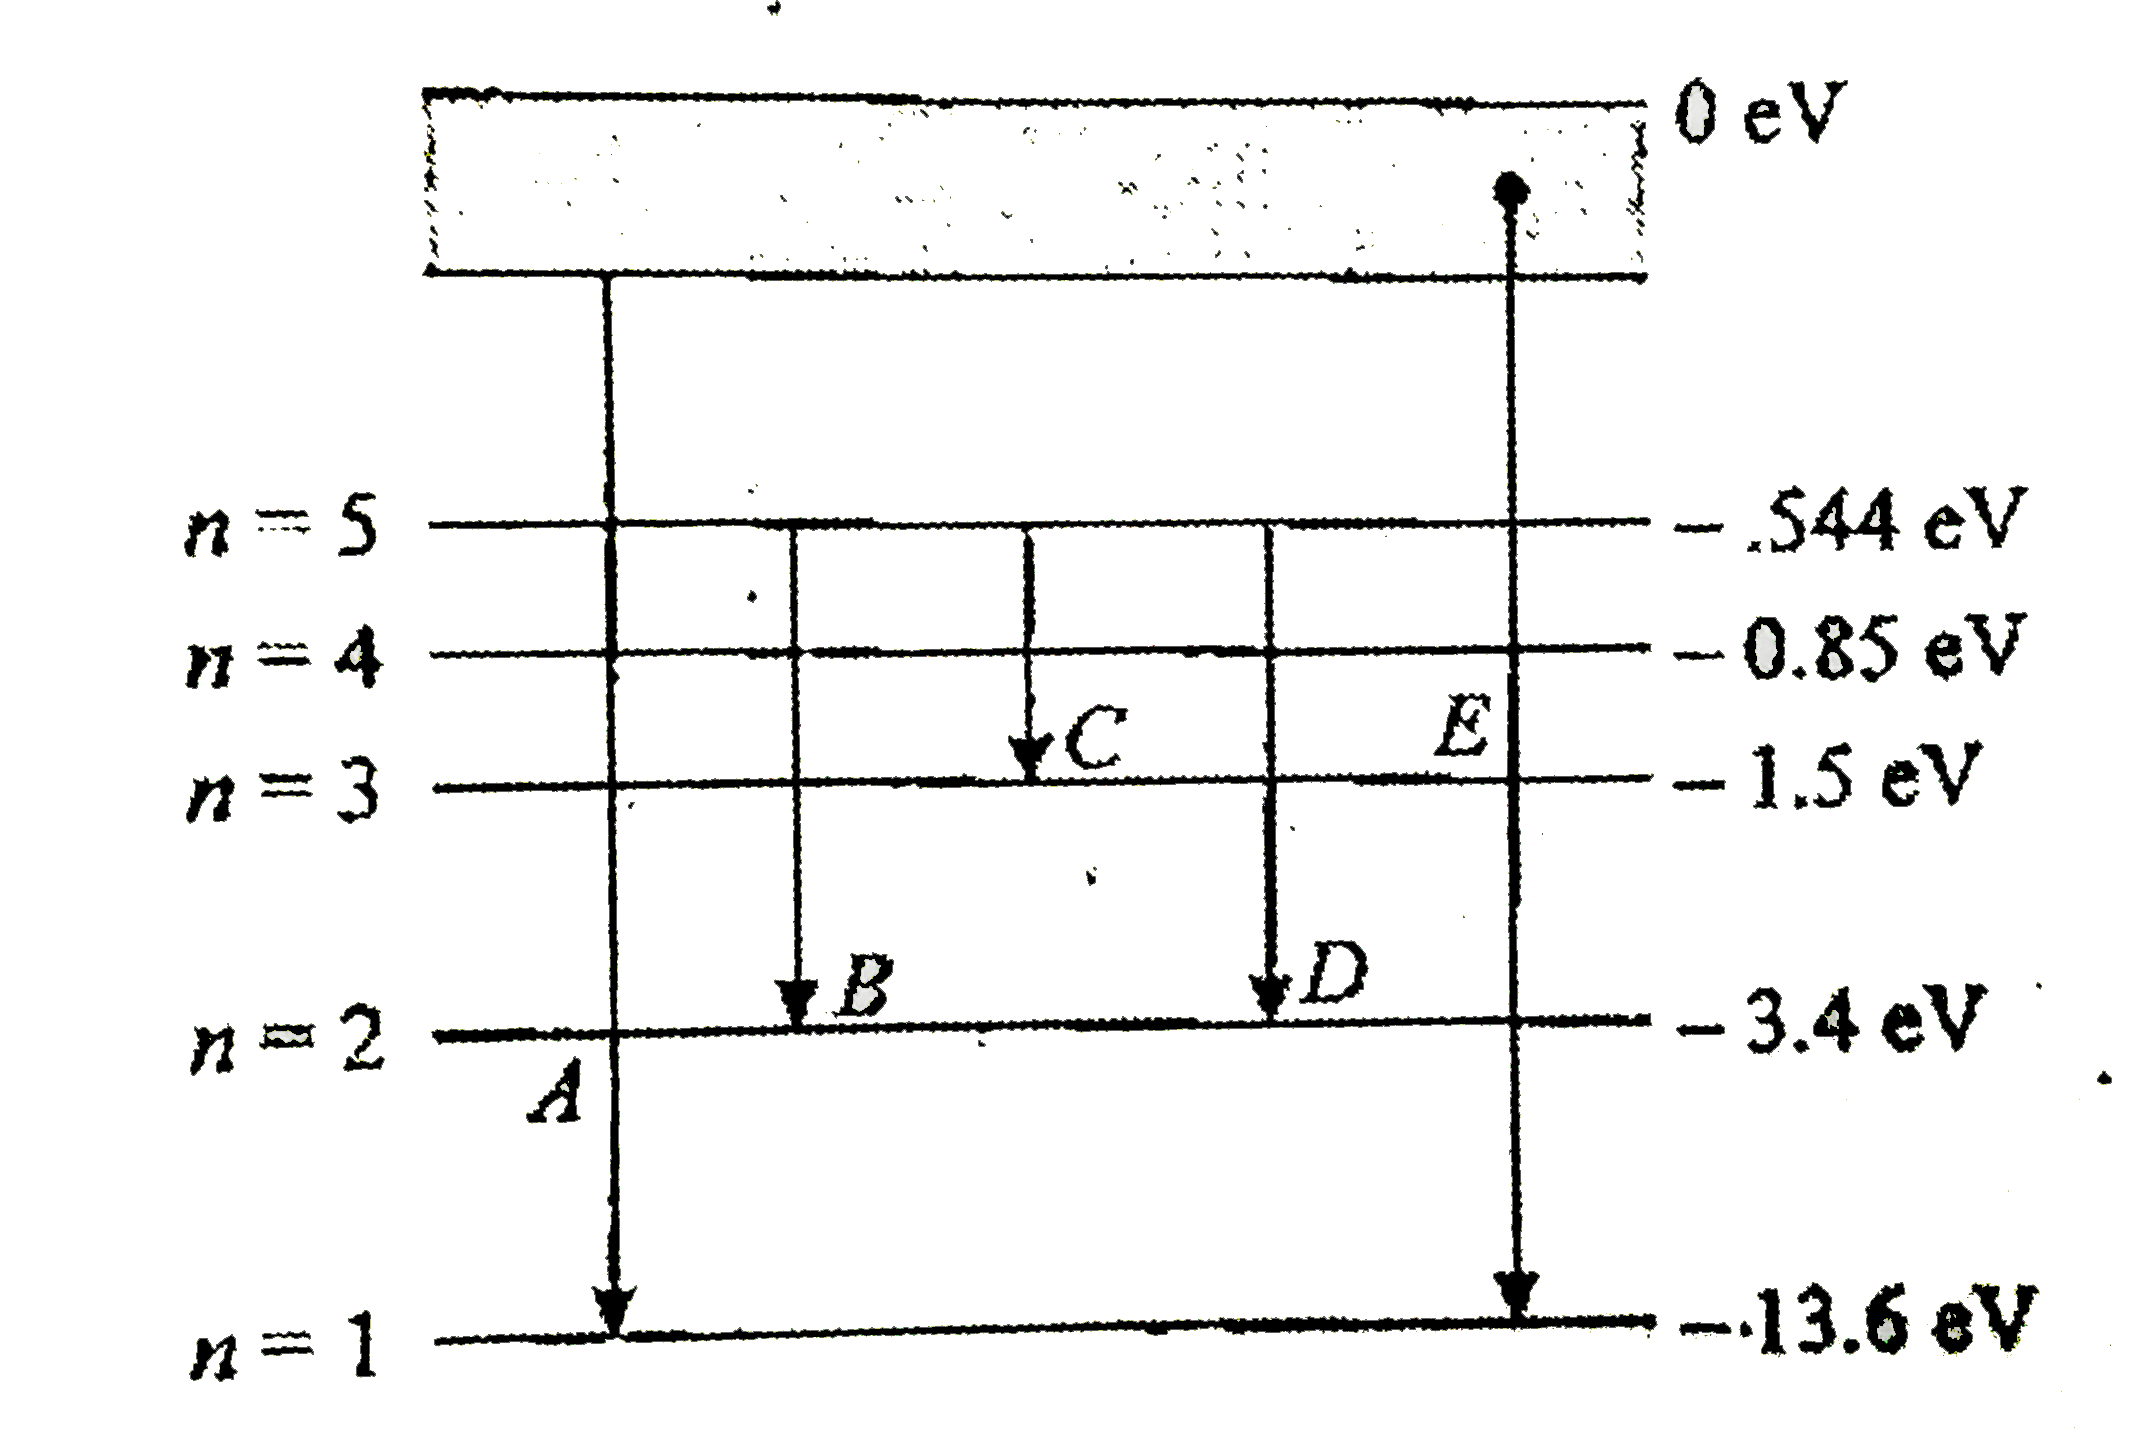
the first member of the Lyman series, third member of Balmer series and second member of Paschen series
the ionisation potential of H, second member of Blamer series and third member of Pachend sereis
the series limit of Lyman series, second member of Balmer series and second member of Paschen series
the series limit of Lyman series, third member of Balmer series and second member of Paschen series
The correct Answer is:D
The transition marked as A represents sseries limit of Lyman series, B represent third member of Balmer series and c represents second of Paschenn series.
Topper's Solved these Questions
- BOOK - DC PANDEYCHAPTER - ATOMSEXERCISE - ASSERTION AND REASON10videos
ATOMS
- BOOK - DC PANDEYCHAPTER - ATOMSEXERCISE - MATCH THE COLUMNS4videos
ATOMS
- BOOK - DC PANDEYCHAPTER - ATOMSEXERCISE - Check point 12.315videos
ATOMS
- BOOK - DC PANDEYCHAPTER - ALTERNATING CURRENTEXERCISE - JEE MAIN63videos
ALTERNATING CURRENT
- BOOK - DC PANDEYCHAPTER - CAPACITORSEXERCISE - OBJECTIVE_TYPE1videos
CAPACITORS
Similar Questions
In the following figure the energy levels of hydroge atom have been shown along with some transitions marked A, B,C,D and E.The transitionsy A,B and C respectively represent:
 View Solution
Sketch the energy level diagram for hydrogen atom and mark the transitions for different spectral series of hydrogen.
View Solution
Knowledge Check
- Question 1 - Select One
In the following figure the energy levels of hydroge atom have been shown along with some transitions marked A, B,C,D and E.The transitionsy A,B and C respectively represent:
 AThe ionization potential of hydrogen, second member of Balmer series and third member of Paschen series.BThe first member of the Lyman series, third member of Balmer series and second member of Paschen series.CThe series limit of Lyman series, third member of Balmer series and second member of Paschen series.DThe series limit of Lyman series, second member of Balmer series and second member of Paschen series.
 - Question 2 - Select One
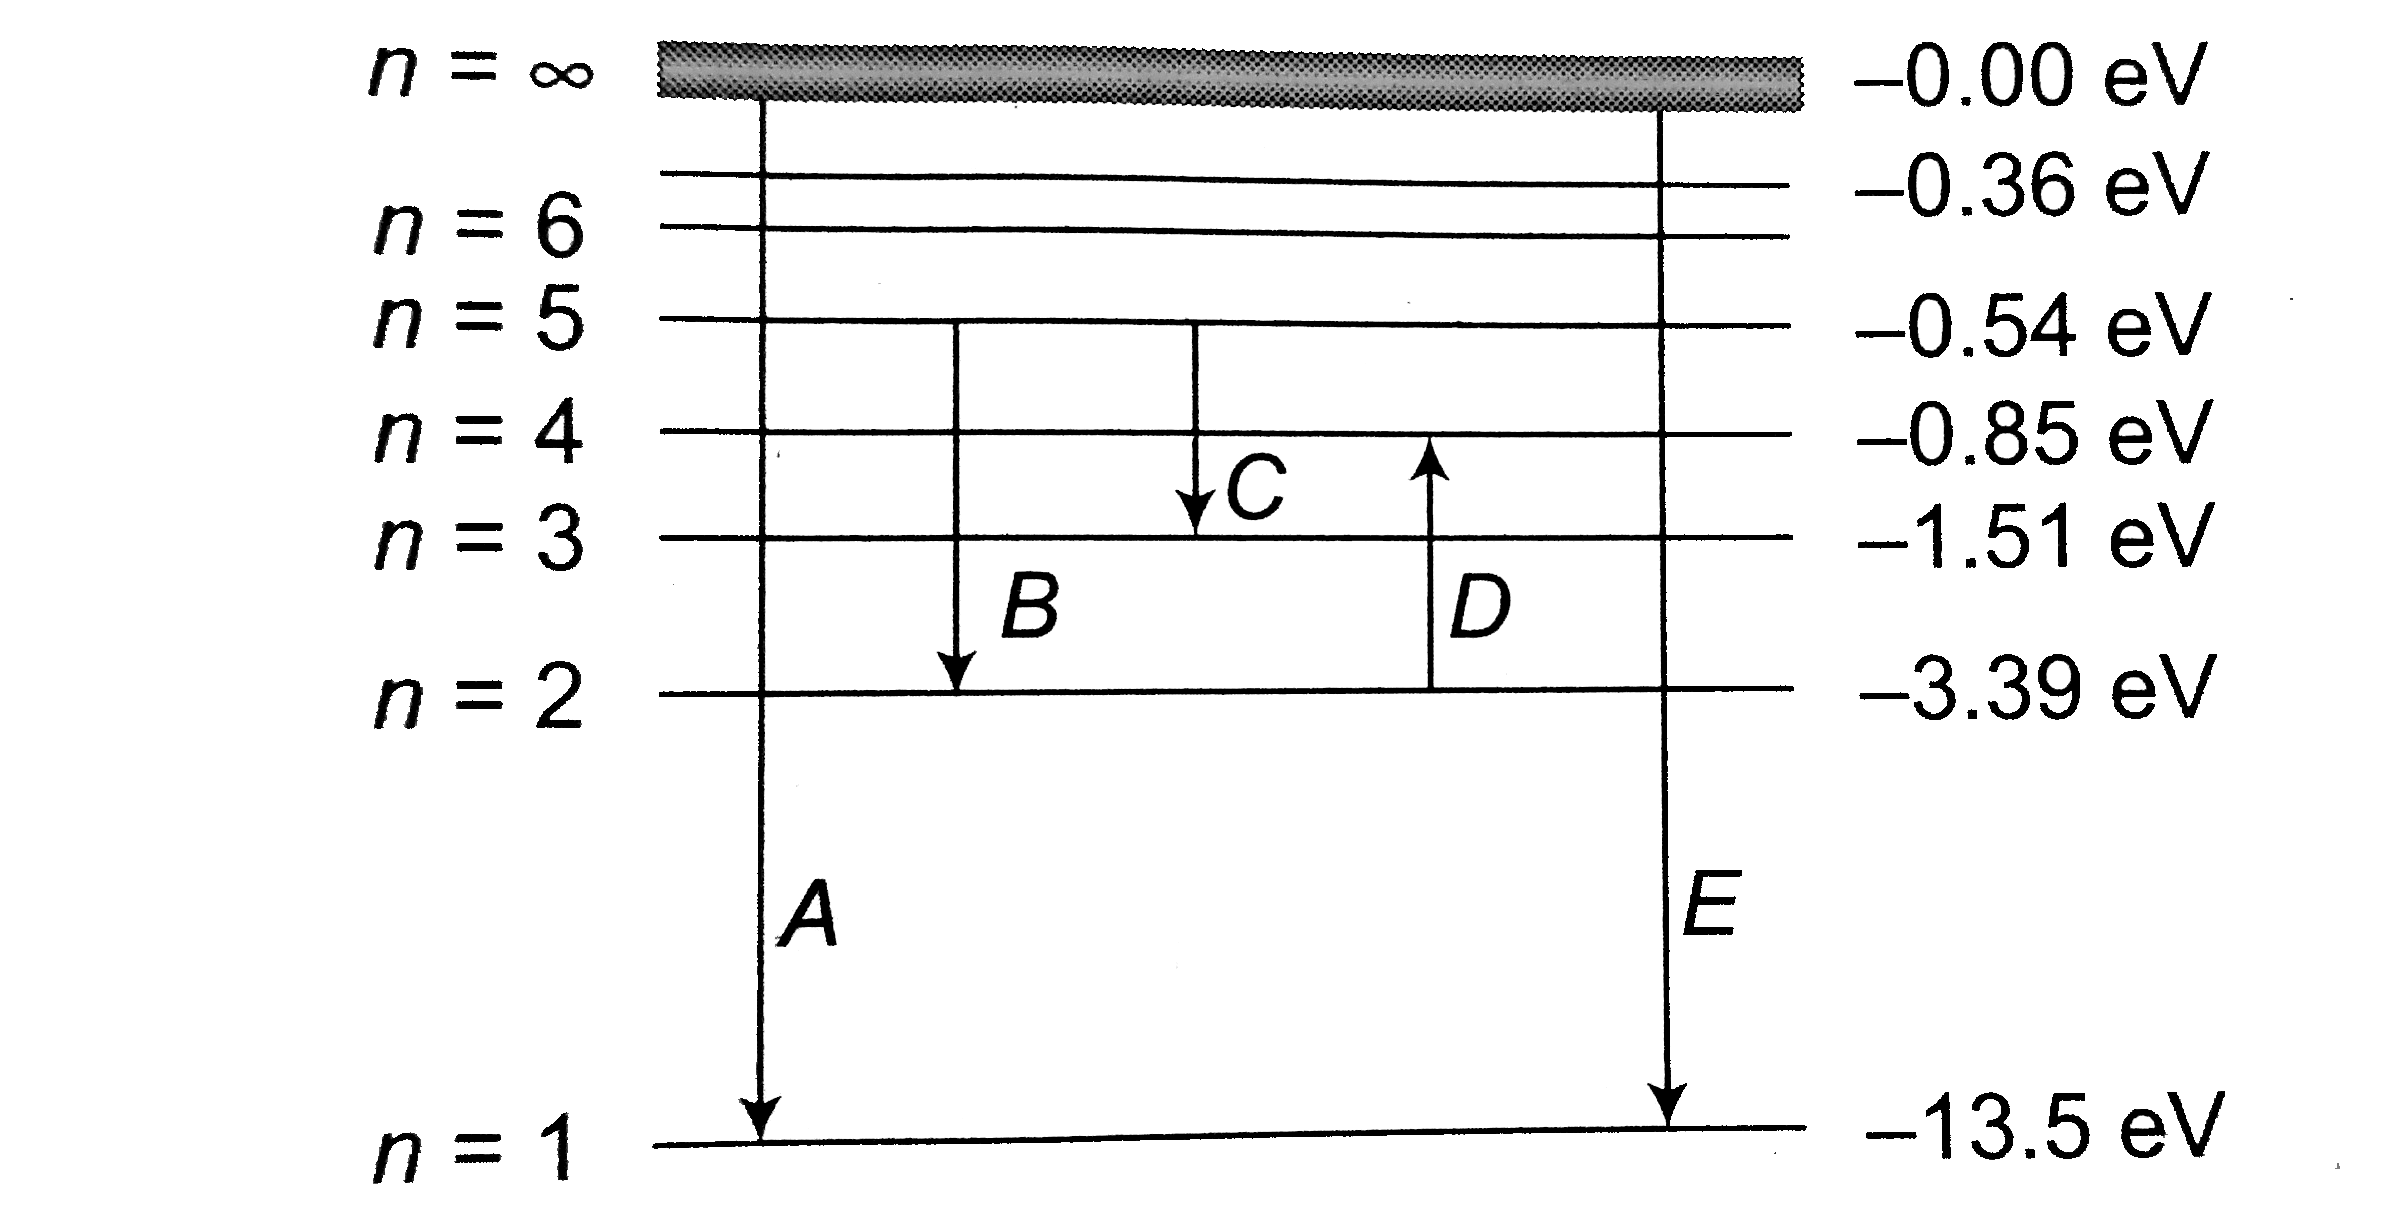
The energy levels of the hydrogen spectrum is shown in figure. There are some transitions A,B,C,D and E. Transition A,B, and C respectively represent
 AFirst mumber of Lyman series, third spectual line of Balmer series and the second spectral line of Paschen seriesBIonization potential of hydrogen, second spectral line of Balmer series and third spectral line of Paschen seriesCSeries limit of Lyman series, third spectral line of Balmer series and second spectral line of Paschen seriesDSeries limit of Lyman series, second spectral line of Balmer series and third spectral line of Paschen series
 - Question 3 - Select One
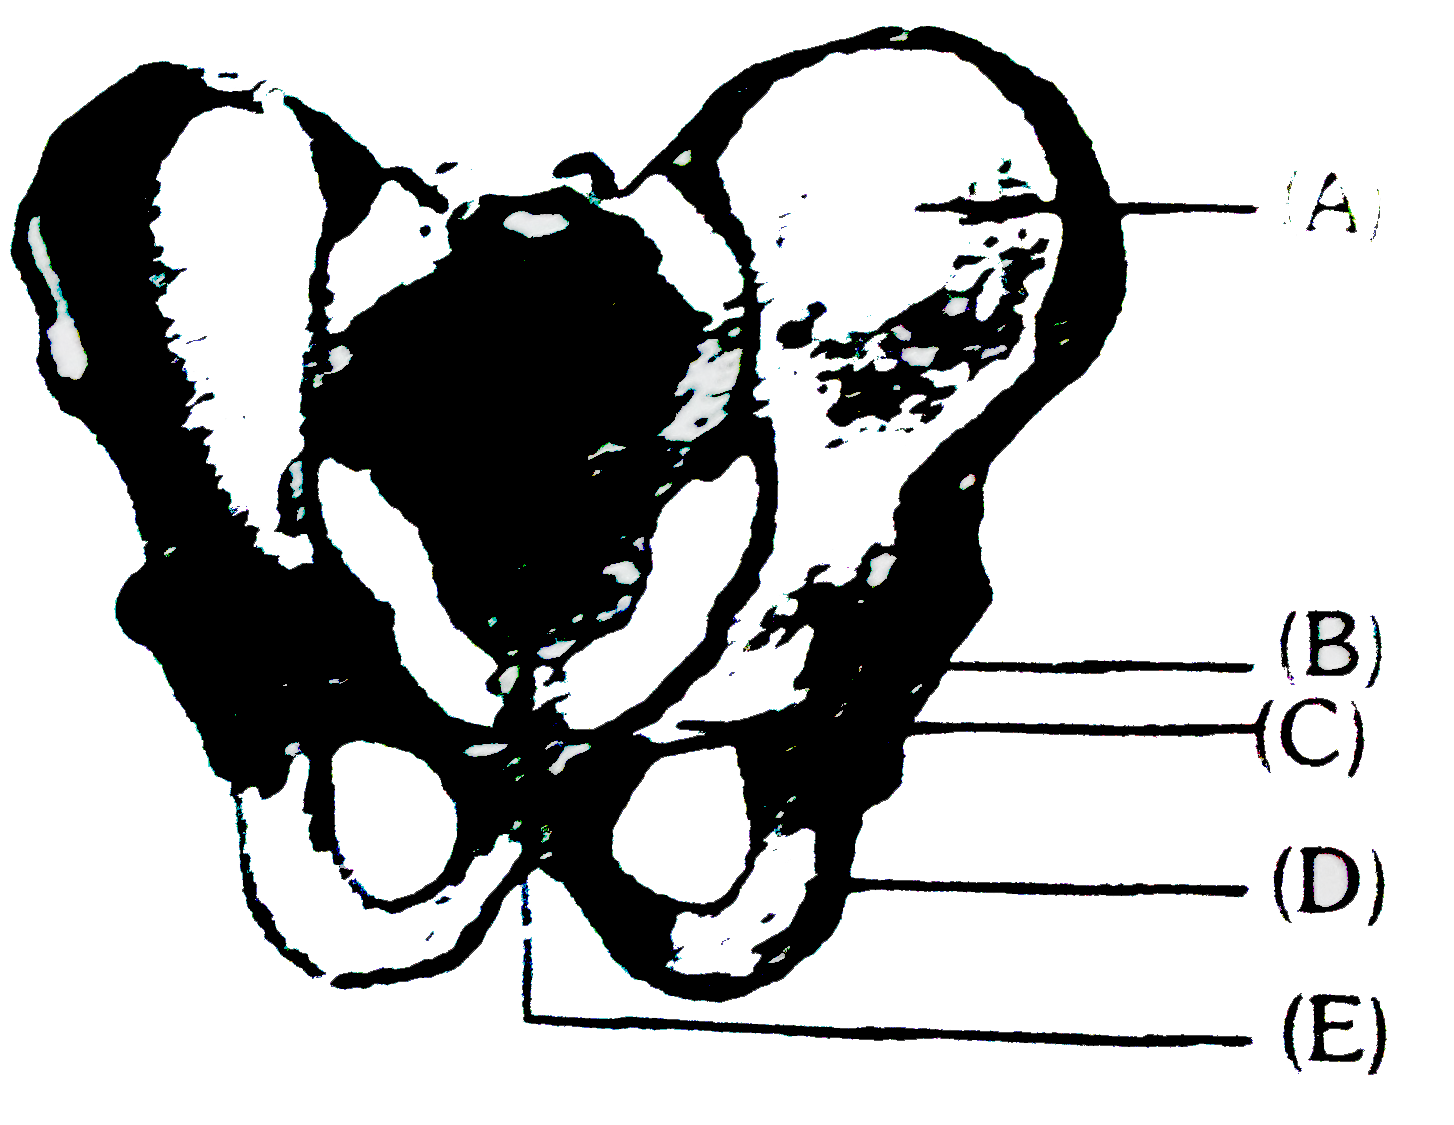
In the pelvic girdle of man A, B, C, D and E respectively represents
 AA-pubis, B-acetabulum, C-ilium, D-ischium, E-pubic symphysisBA-ilium, B-acetabulum, C-pubis, D-ischium, E-pubic symphysisCA-ischium, B-acetabulum, C-pubis, D-ilium, E-pubic symphysisDA-ilium, B-pubis, C- acetabulum, D-pubic symphysis, E-ischium
Draw the energy level diagram for the hydrogen atom, neatly labelled and showing the transitions which give rise to the first five series of spectral lines for hydrogen.
View SolutionIn figure E1andE2 represent some of the energy levels of the hydrogen atom.
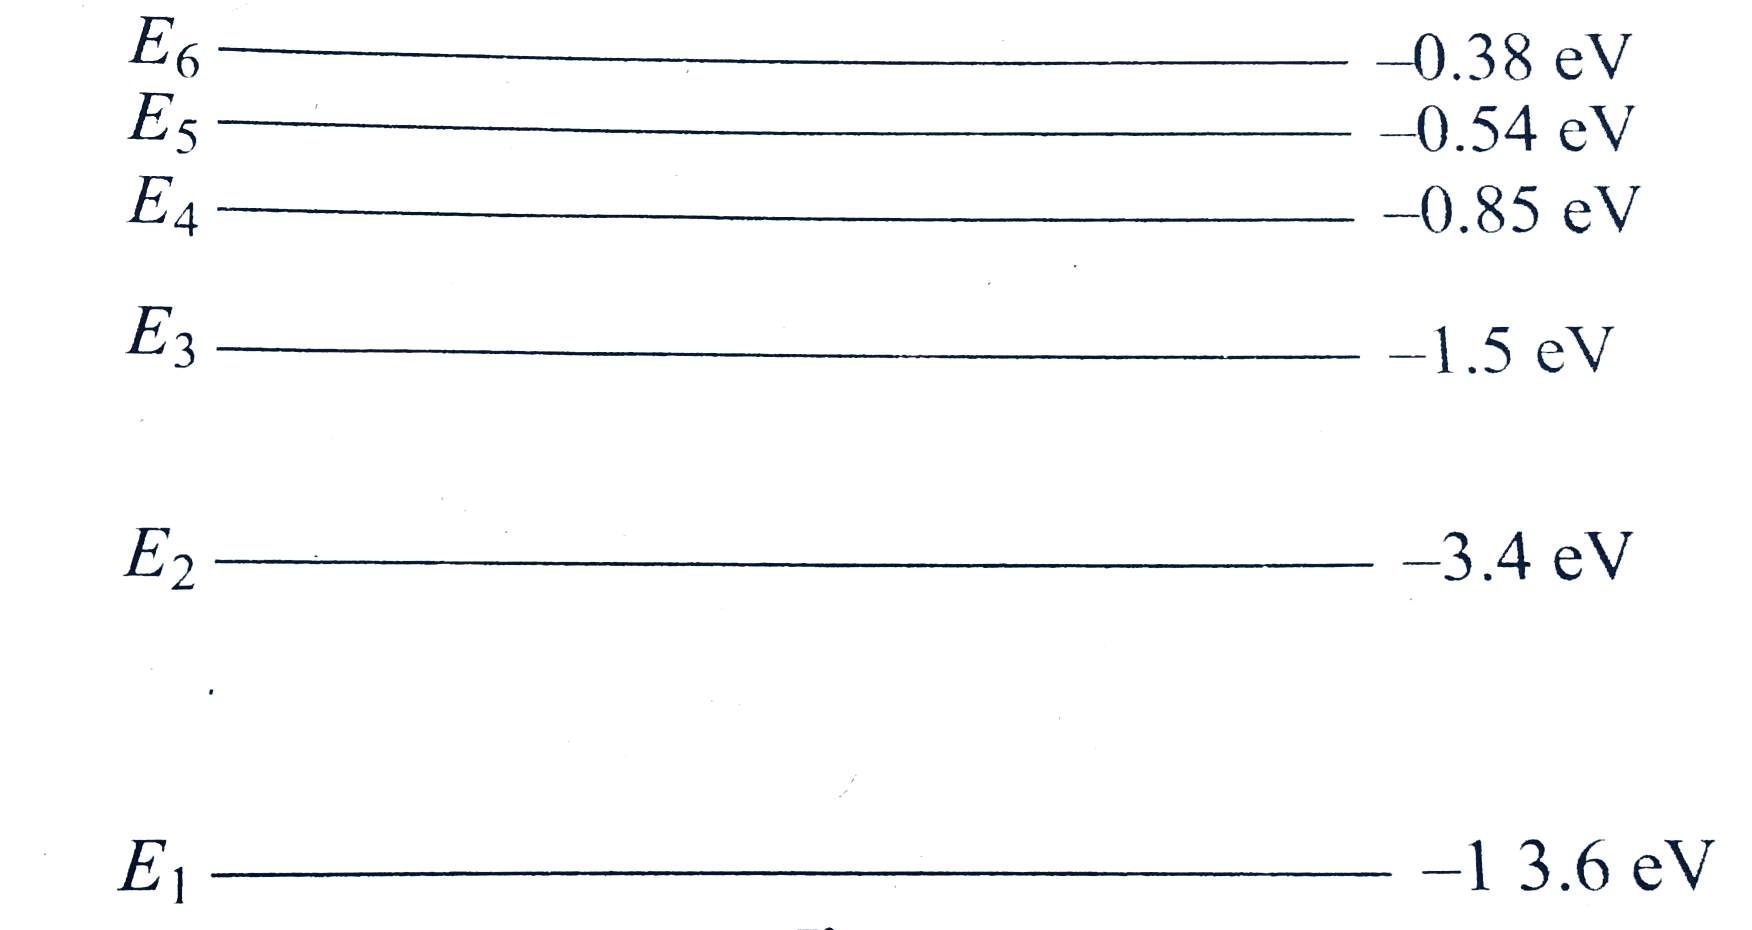
Which one of the following transitions produced a photon of wavelength in the ultraviolet region of the electromagnetic spectrum?View SolutionThe figure shows an energy level diagram for the hydrogen atom. Several transition are marked as I, II, III, …………. The diagram is only indicative and not to scale.
 View Solution
Pertain to the following statement and figure
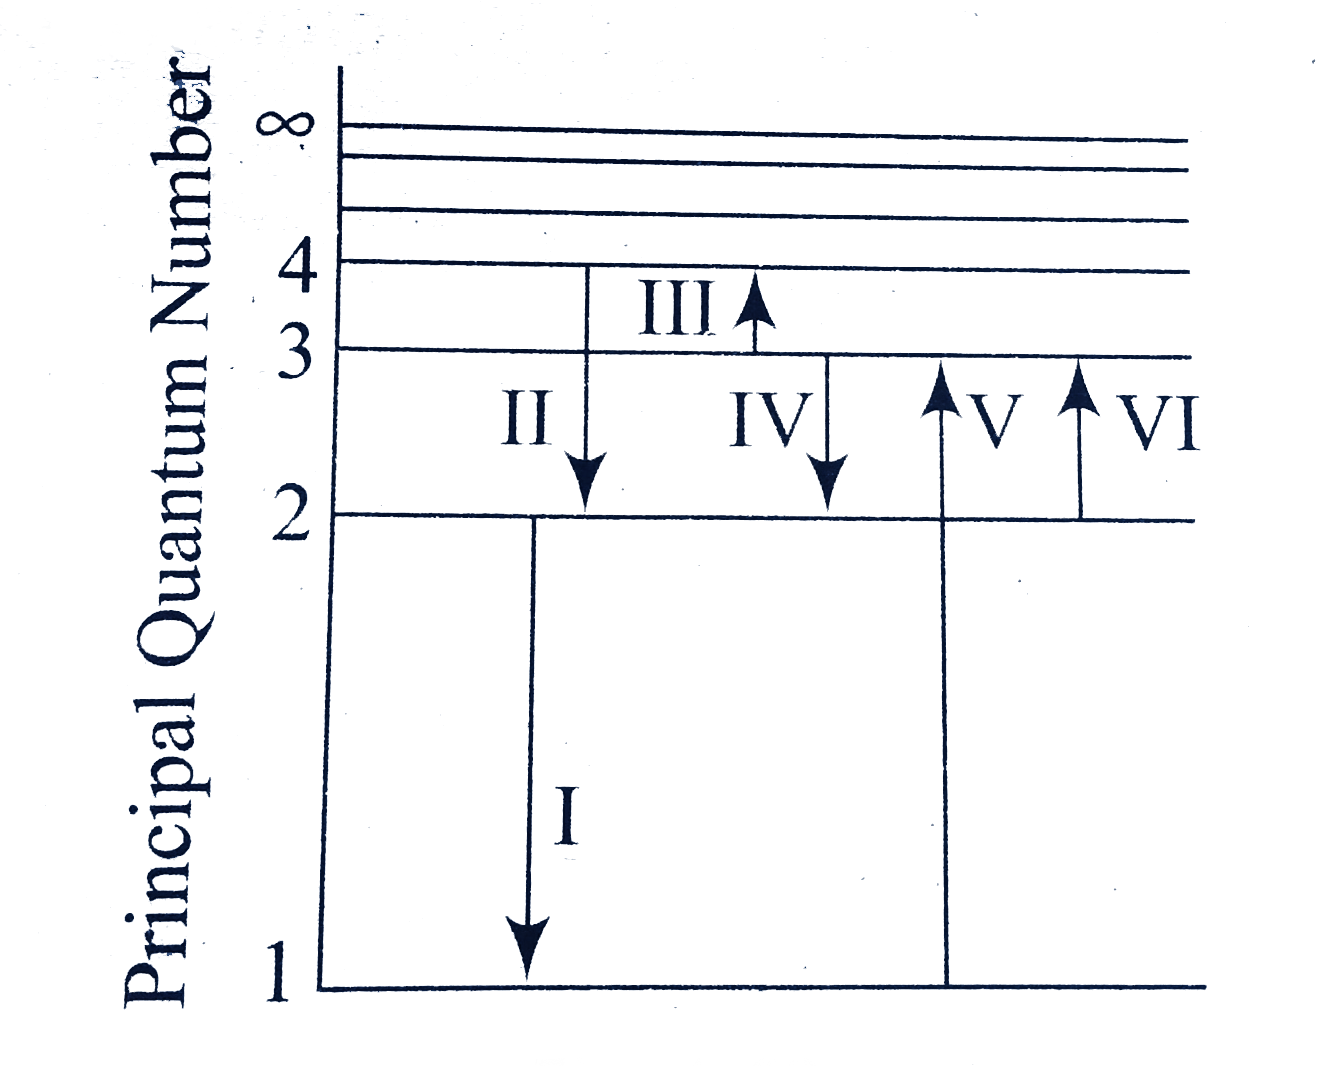
The figure above shown level diagram of the hydrogen atom. Serveral transition are market as I, II, III, … The diagram is only indicative and not to scale.
The wavelength of the radiation involved in transition II is:View SolutionPertain to the following statement and figure
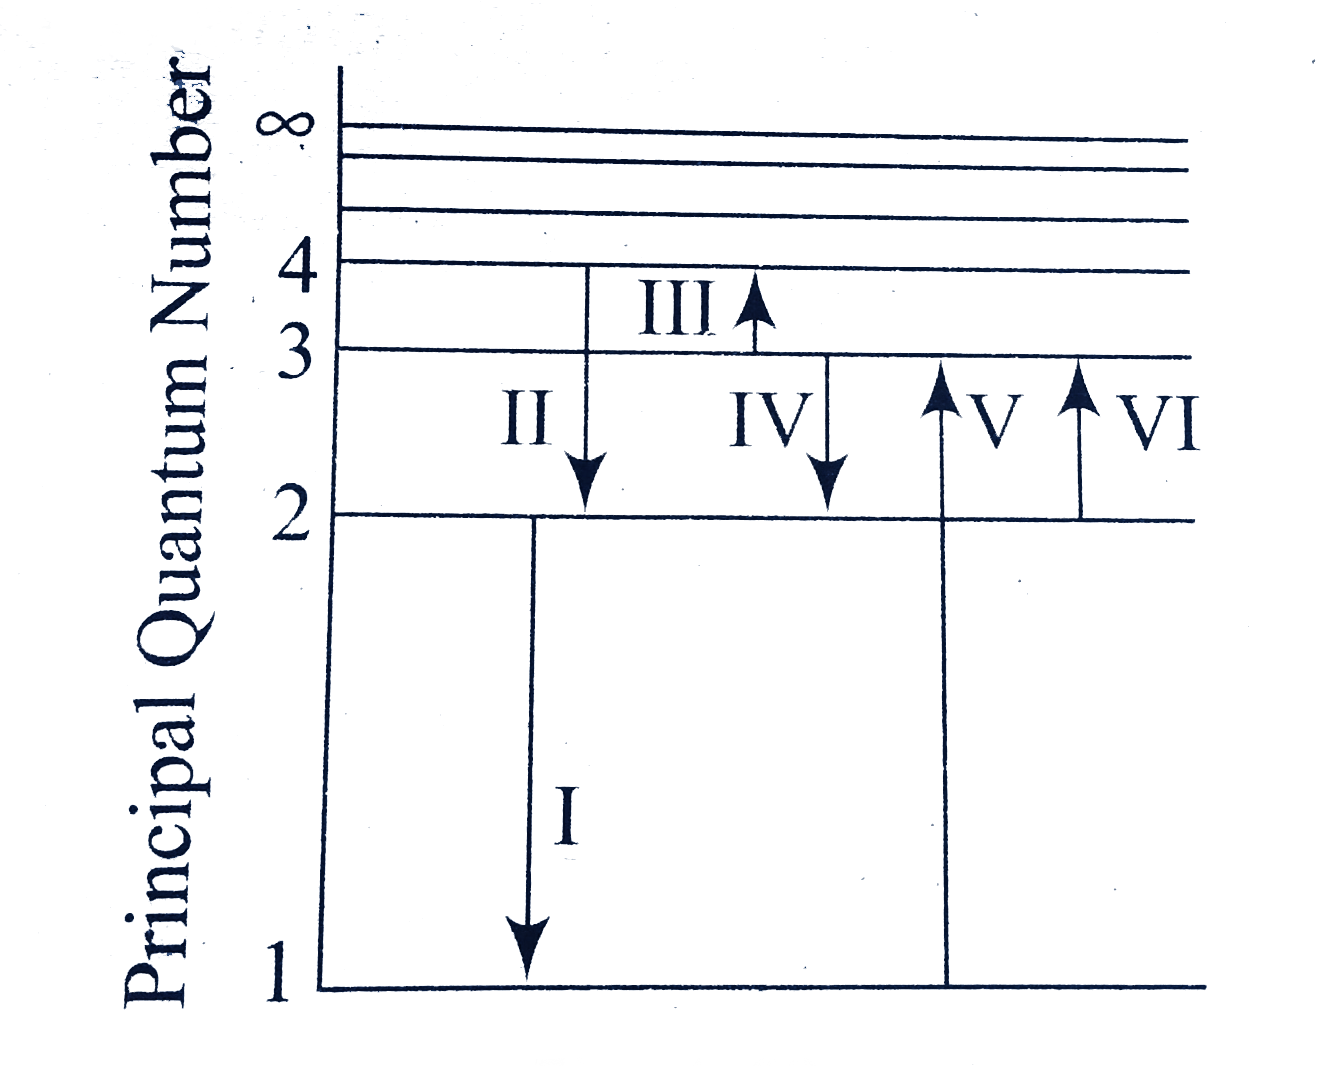
The figure above shown level diagram of the hydrogen atom. Serveral transition are market as I, II, III, … The diagram is only indicative and not to scale.
In which transition ia a Balmer series photon absorbed?View Solution

