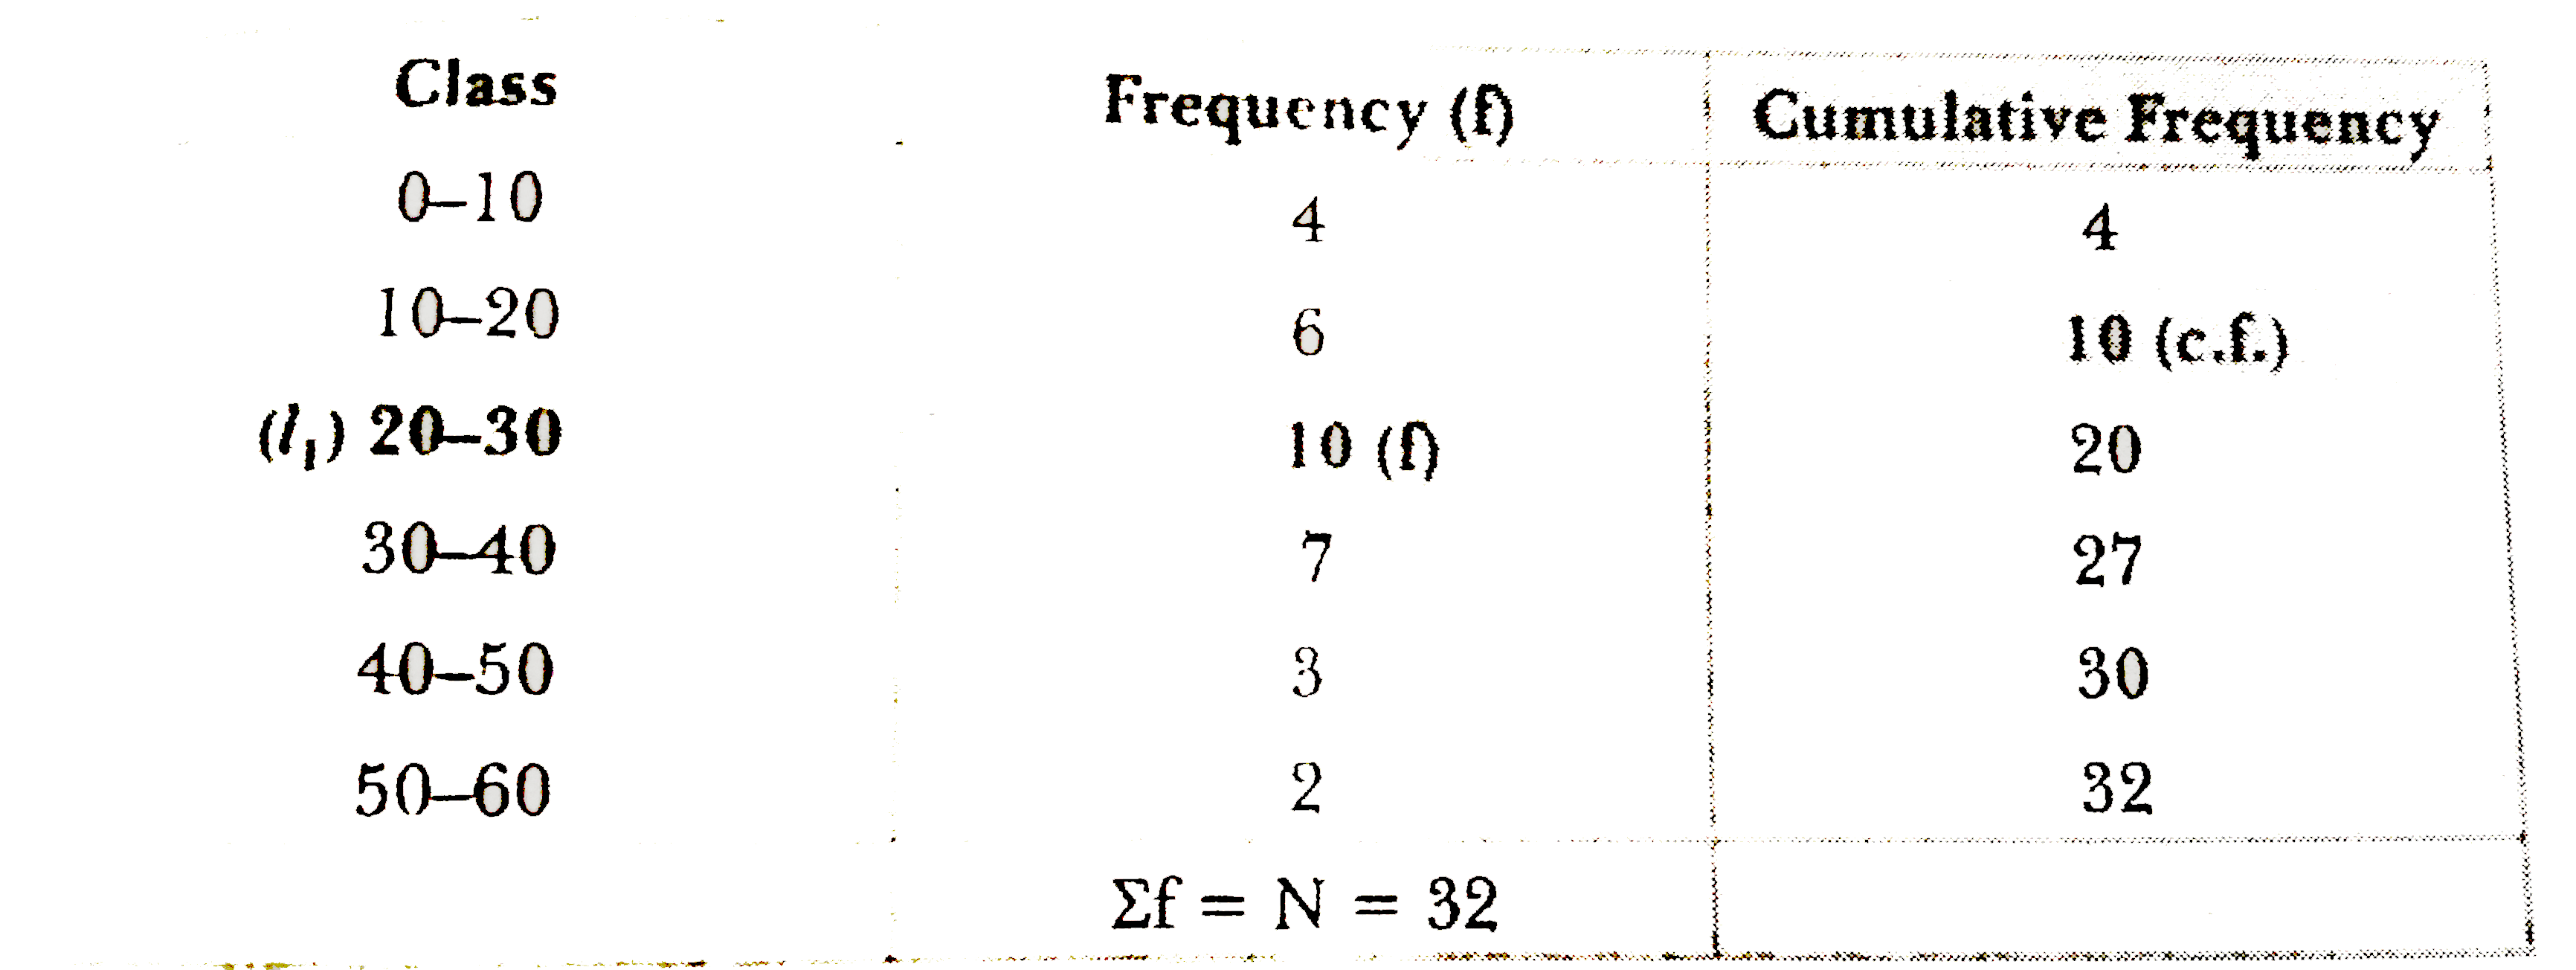
Following is the distribution of marks in Statistics obtained by 32 students :
Mid - value51525354555Frequency4610732
Caculate the median marks.
Since , we are given the mid - values , we should first find out the upper and limits of the various classes . As the mid - values are 5,15,25,35,45,55,so , class size is 10 (=15-5) . For determining limits of different classes , applying the formula :
Lower limit : l1=m−12×iand
Upper limit : l2=m+12×i
where , i = difference between two mid - values.
In this case, the upper and the lower limits of the first mid - value are :
l1=5−12×10=0andl2=5+12×10=10
i.e., 0-10 class interval.
Similarly , class intervals for other mid - values are obtained as :

M= Size of (N2)th item
= Size of (322) th item= Size of 25th item
Hence, median lies in the class 20-30.
M=l1+N2−c.f.f×i
=20+322−1010×10
=20+16−1010×10
=20+610×10
=20+6=26
Median Marks =26.
Topper's Solved these Questions
- MEASURES OF CENTRAL TENDENCY MEDIAN AND MODEBOOK - TARUN JAIN & VK OHRICHAPTER - MEASURES OF CENTRAL TENDENCY MEDIAN AND MODEEXERCISE - Objective Type Questios
26 Videos
- MEASURES OF CENTRAL TENDENCY MEDIAN AND MODEBOOK - TARUN JAIN & VK OHRICHAPTER - MEASURES OF CENTRAL TENDENCY MEDIAN AND MODEEXERCISE - Concept - based Objective Questions
7 Videos
- MEASURES OF CENTRAL TENDENCY MEDIAN AND MODEBOOK - TARUN JAIN & VK OHRICHAPTER - MEASURES OF CENTRAL TENDENCY MEDIAN AND MODEEXERCISE - NCERT Questions (With Hints to Answers)
5 Videos
- MEASURES OF CENTRAL TENDENCY - ARITHMETIC MEANBOOK - TARUN JAIN & VK OHRICHAPTER - MEASURES OF CENTRAL TENDENCY - ARITHMETIC MEANEXERCISE - Illustration
72 Videos
- MEASURES OF DISPERSIONBOOK - TARUN JAIN & VK OHRICHAPTER - MEASURES OF DISPERSIONEXERCISE - Learning by doing
30 Videos
Similar Questions
Following is the distribution of marks in Economics obtained by 50 students :
Marks (more than)01020304050Number of Students50464020103
Calculate the median marks . If 60% of the students pass this test , find the minimum marks obtained by a pass candidate.
View SolutionCalculate mode , given the following data set :
Mid - value1525354555657585Frequency581216281532
View Solution
Knowledge Check
Following table represents the marks in a subject of students of a class.
Marks102030334045Number of students2481023
Mode of above distribution isA48B33C30D10
Compute median from the following data :
Mid - value515253545556575Frequency15711101382016
View SolutionFollowing table gives marks in Statistics of the students of a class.
Find out mean marks.
Mid-value510152025303540Number of Students579108632
View SolutionFollowing table gives marks in Statistics of the students of a class.
Find out mean marks.
Mid-value510152025303540Number of Students579108632
View SolutionThere are 60 students in a class. The following is the frequency distribution of marks obtained by the students in a test: Marks:, 0, 1, 2, 3, 4, 5 Frequency , x−2 , x , x2 , (x+1)2 , 2x , x+1. Determine mean and standard deviation of the marks.
View SolutionFind out median of the following series :
Size152025303540Frequency1015255520
View SolutionMarks (obtained out of 10)4578910Frequency51086129
9 students got full marks. ??
View SolutionThe following sercies show marks in Statistics of 9 students in Class XI . Find the median marks.
Marks221618131519172023
View Solution
