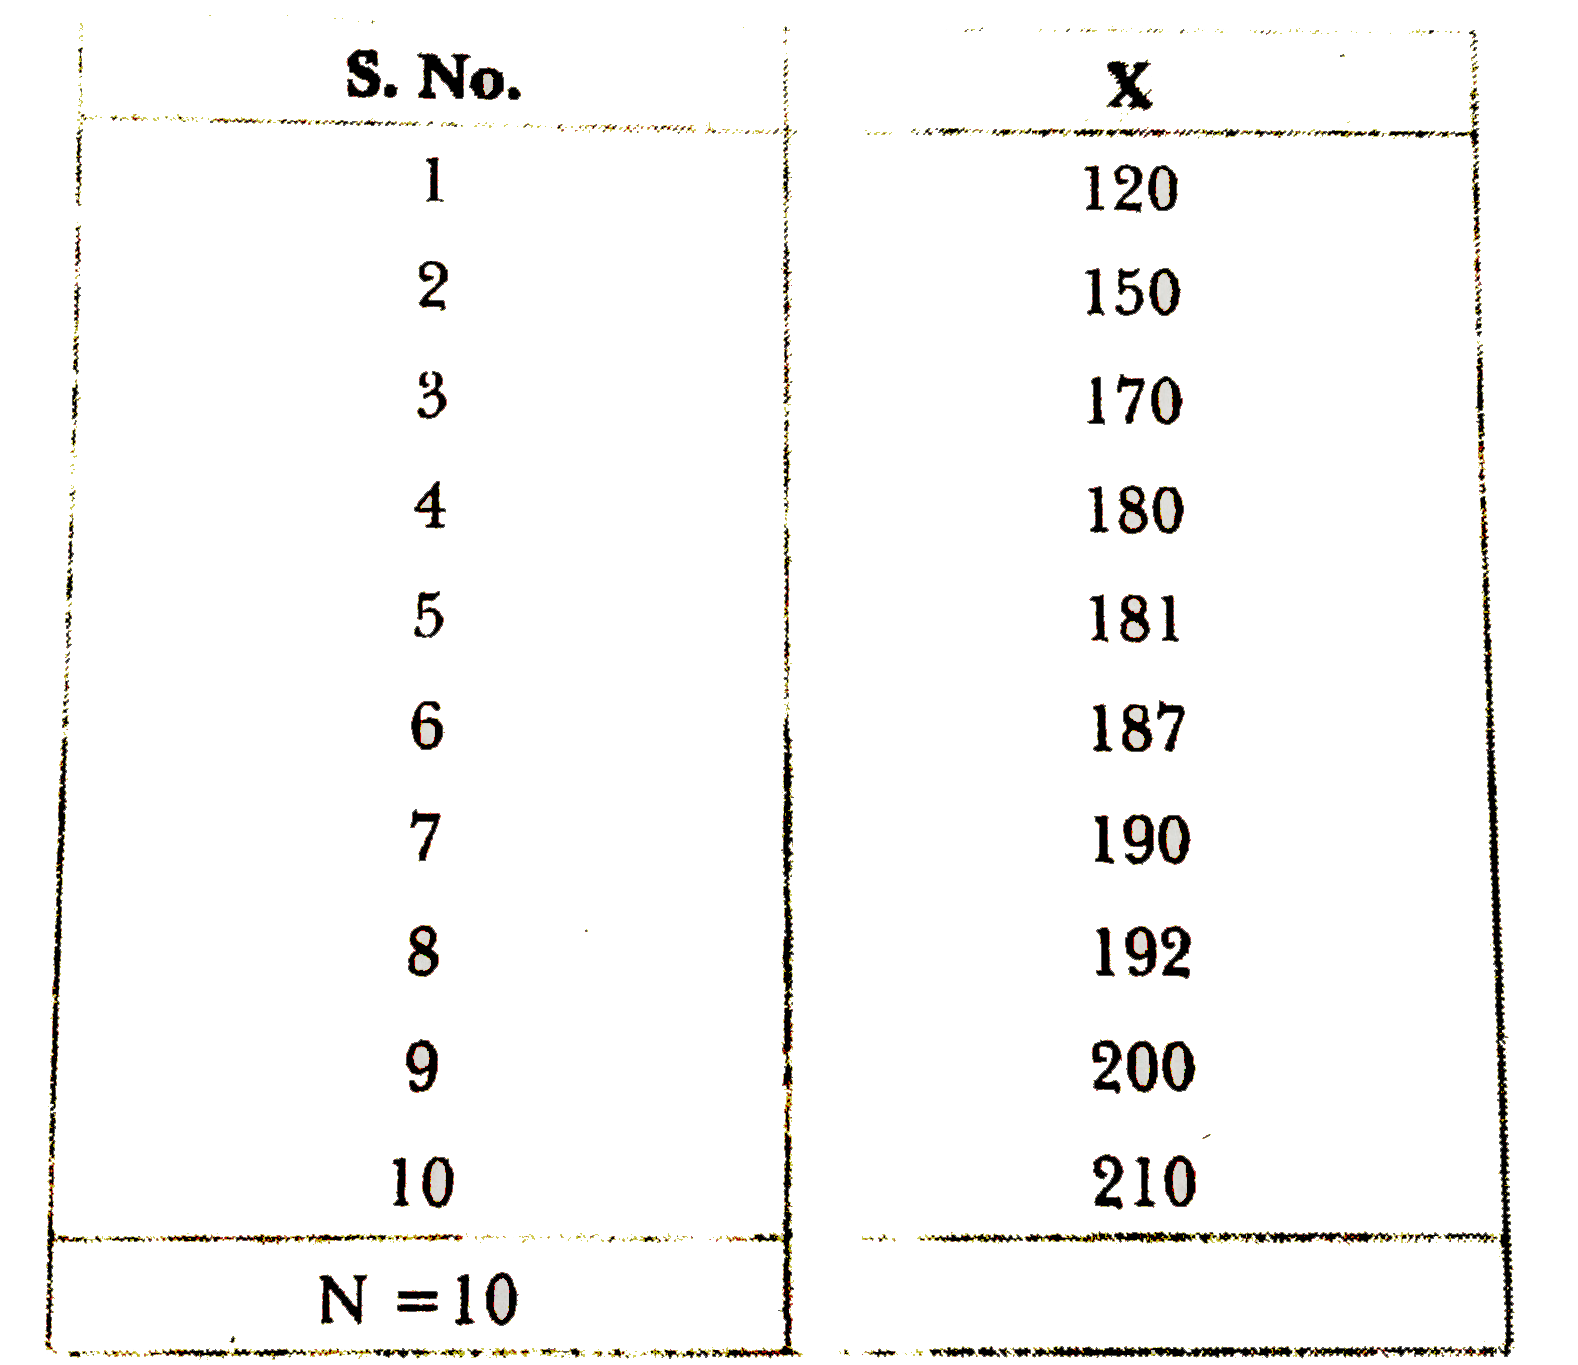
Caculate Q1,Q3,D9andP70 from the following data :
120187170180192150190181200210
The data is first arranged in ascending order :

Q1 = Size of (N+14) th item = Size of (10+44) th item
= Size of 2.75 th item
= Size of 2nd item + 0.75 (Size of 3 rd item = Size of 2nd item)
=150+34(170−150)
150+15=165
Q3= Size of 3(N+14) th item = Size of 3(10+14) th item
= Size of 8.25th item
= Size of 8th item + 0.25 (Size of 9th item - Size of 8 th item)
=192+14(200−192)
=192+2=194
D9 = Size of 9(N+110) th item = Size of 9(10+110)th item
=Size of 9.9 th item
Size of 9th +0.9( Size of 10 th item - Size of 9th item)
=200+910(210−200)
200+9=209
P70 = Size of 70(N+1100) th item
= Size of 70th item
= Size of 7.7 th item
= Size of 7th item +0.7 (Size of 8th item - Size of 7th item)
=190+710(192−190)
=190+1.4=191.4
Thus , Q1=165,Q3=194,D9=209,P70191.4.
Topper's Solved these Questions
- MEASURES OF CENTRAL TENDENCY MEDIAN AND MODEBOOK - TARUN JAIN & VK OHRICHAPTER - MEASURES OF CENTRAL TENDENCY MEDIAN AND MODEEXERCISE - Objective Type Questios
26 Videos
- MEASURES OF CENTRAL TENDENCY MEDIAN AND MODEBOOK - TARUN JAIN & VK OHRICHAPTER - MEASURES OF CENTRAL TENDENCY MEDIAN AND MODEEXERCISE - Concept - based Objective Questions
7 Videos
- MEASURES OF CENTRAL TENDENCY MEDIAN AND MODEBOOK - TARUN JAIN & VK OHRICHAPTER - MEASURES OF CENTRAL TENDENCY MEDIAN AND MODEEXERCISE - NCERT Questions (With Hints to Answers)
5 Videos
- MEASURES OF CENTRAL TENDENCY - ARITHMETIC MEANBOOK - TARUN JAIN & VK OHRICHAPTER - MEASURES OF CENTRAL TENDENCY - ARITHMETIC MEANEXERCISE - Illustration
72 Videos
- MEASURES OF DISPERSIONBOOK - TARUN JAIN & VK OHRICHAPTER - MEASURES OF DISPERSIONEXERCISE - Learning by doing
30 Videos
Similar Questions
Knowledge Check
Find the mean of the quartiles Q1,Q2 and Q3 of the data 5 , 9 , 8 , 12 , 7 , 13 , 10 , 14.
A9B10C9.5D11.5
Calculate the values of Q1,Q3,D8andP85 - from the following data :
Wages (Rs.)0−1010−2020−3030−4040−50Number of Workers 22 38 46 35 19
View SolutionCalculate AP and MP from the following particulars :
∣∣ ∣ ∣∣Land1111111111Labour0123456789TP (units)0205090120140150150140120∣∣ ∣ ∣∣
View SolutionCaculate the median and mode from the following data :
Marks0−1010−2020−3030−4040−5050−6060−7070−80Number of Students 2 18 30 45 35 20 6 3
View SolutionCalculate mode from the following data :
{:("Wages",25,50,75,80,85,90),("Number of Workers",4,6,9,3,2,1):}
View SolutionFrom the following data , calculate Q1,Q3,D5andP25.
S.No.2115403026455054606570
View SolutionConstruct a histogram for the following data: Monthly school fee (in Rs)30−6060−9090−120120−150150−180180−210210−240No. of schools51214181094
View SolutionFind out slope of dd curve from the following data:
P Rs.40,Q 40unitsP1 Rs. 80,Q 20 units
View Solution
