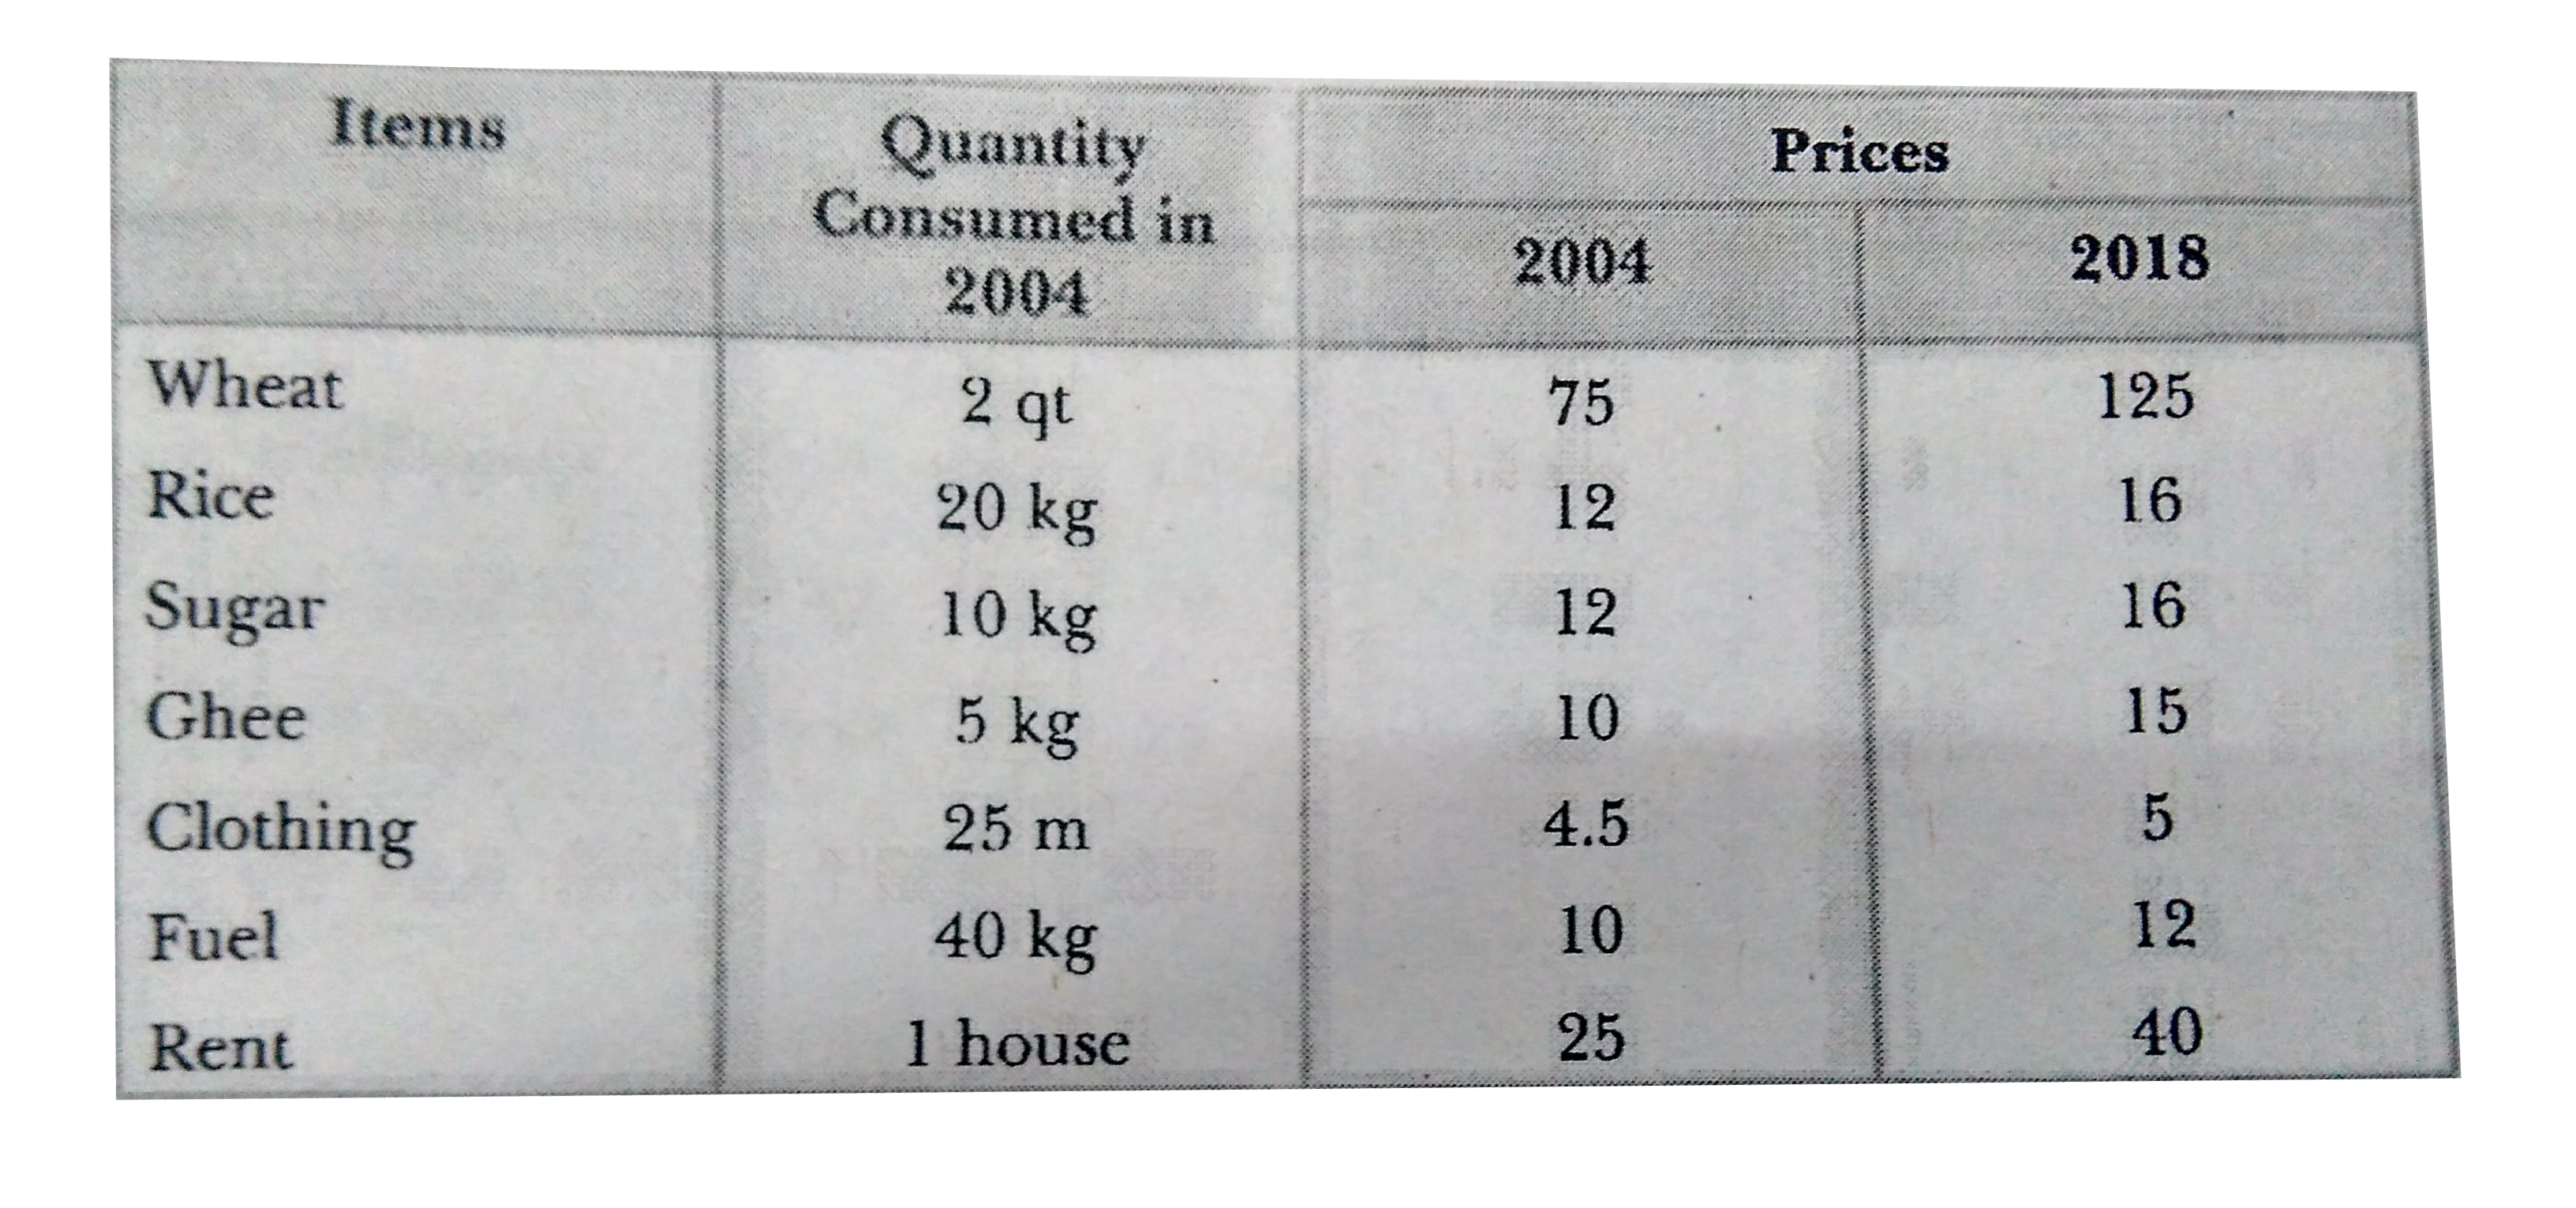
From the following data construct Fisher's Ideal Index:
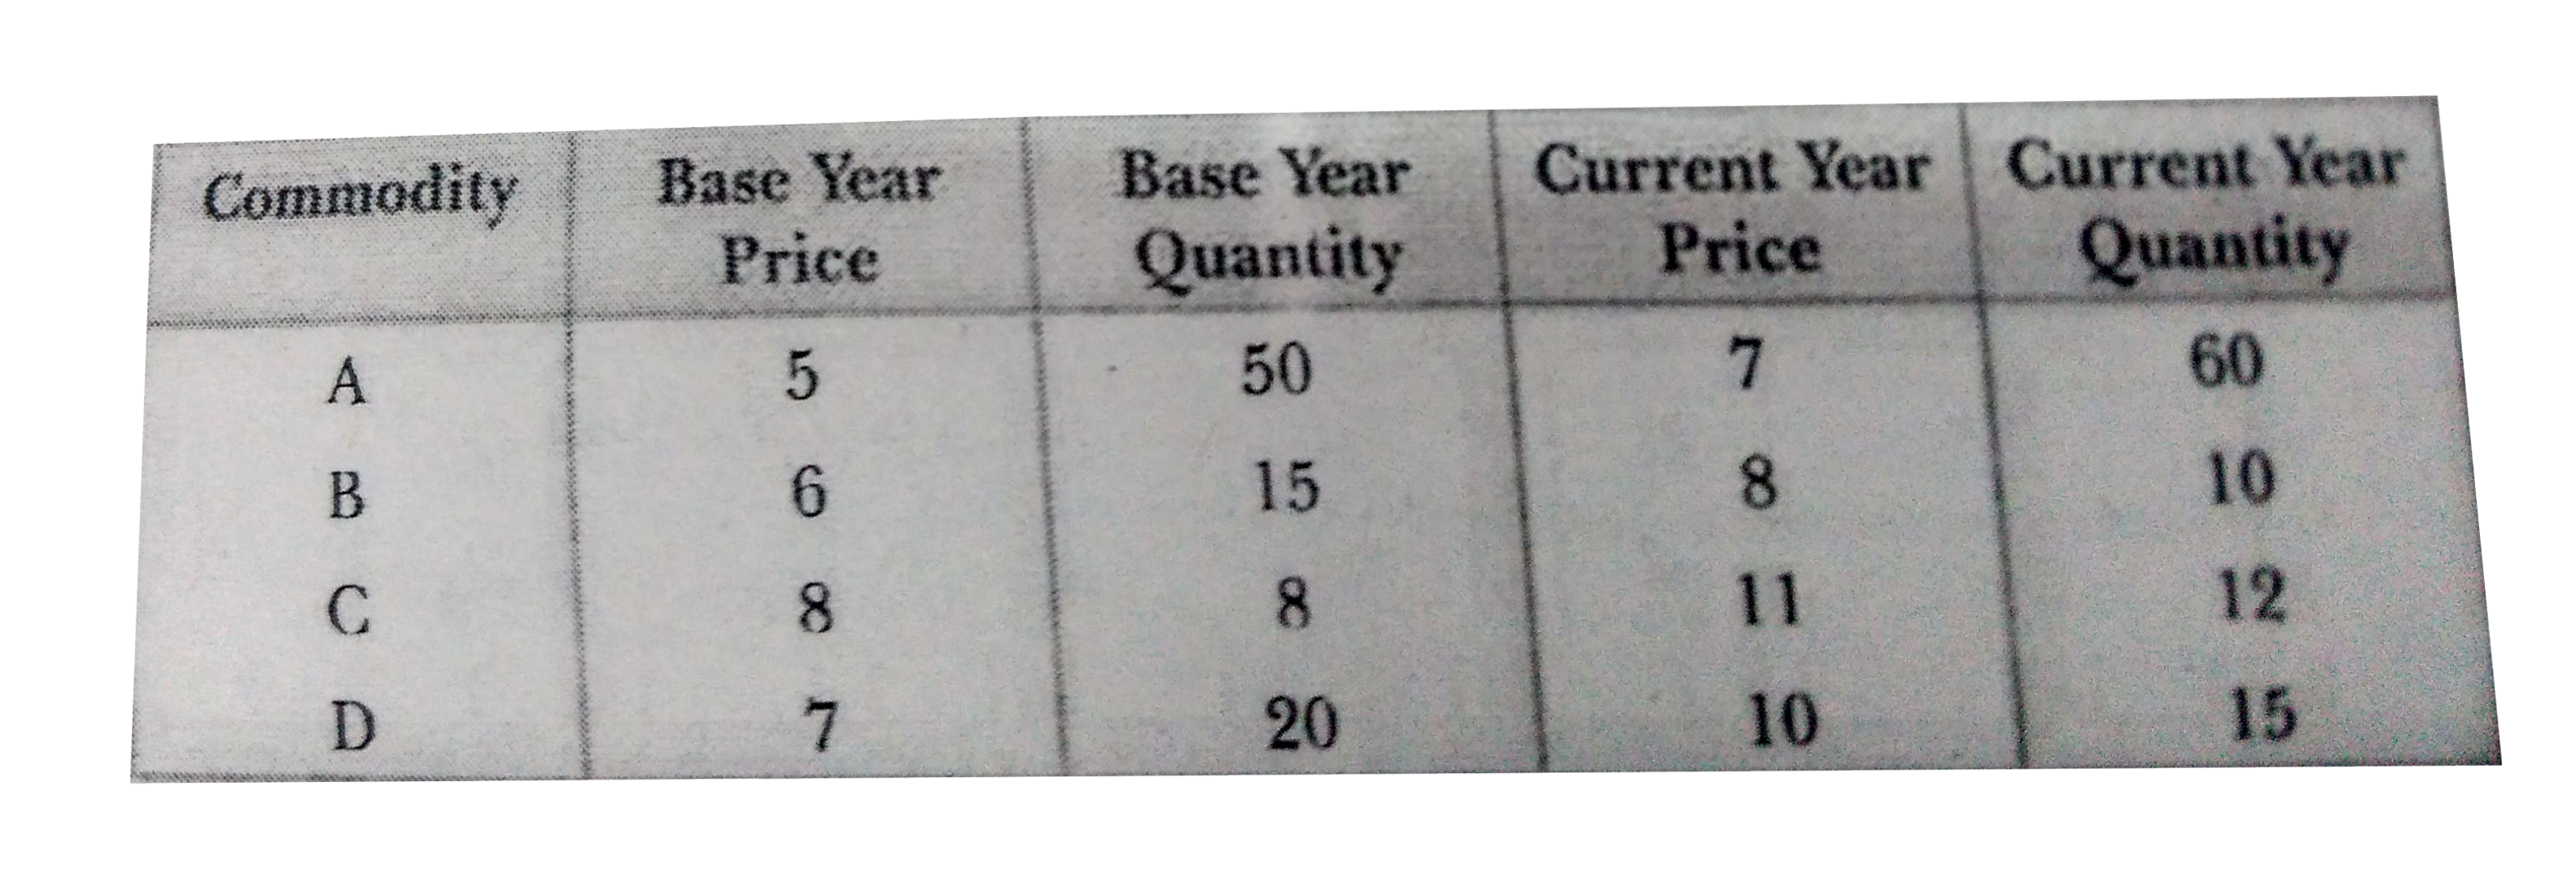

P01=√Σp1q0Σp0q0×Σp1q1Σp0q1×100
=√758544×782561×100
=√1.9423×100
=1.3937×100
=139.37
Topper's Solved these Questions
- BOOK - TARUN JAIN & VK OHRICHAPTER - INDEX NUMBERSEXERCISE - A. Multiple Choice Questions: Choose the Correct Answer12videos
INDEX NUMBERS
- BOOK - TARUN JAIN & VK OHRICHAPTER - INDEX NUMBERSEXERCISE - B. Choose appropriate word and fill in the blank7videos
INDEX NUMBERS
- BOOK - TARUN JAIN & VK OHRICHAPTER - FREQUENCY DIAGRAMS - HISTOGRAM, POLYGON AND OGIVEEXERCISE - EXERCISE NCERT7videos
FREQUENCY DIAGRAMS - HISTOGRAM, POLYGON AND OGIVE
- BOOK - TARUN JAIN & VK OHRICHAPTER - MEASURES OF CENTRAL TENDENCY - ARITHMETIC MEANEXERCISE - Illustration72videos
MEASURES OF CENTRAL TENDENCY - ARITHMETIC MEAN
Similar Questions
From the following data, find Fisher's Ideal Index Number:
 View Solution
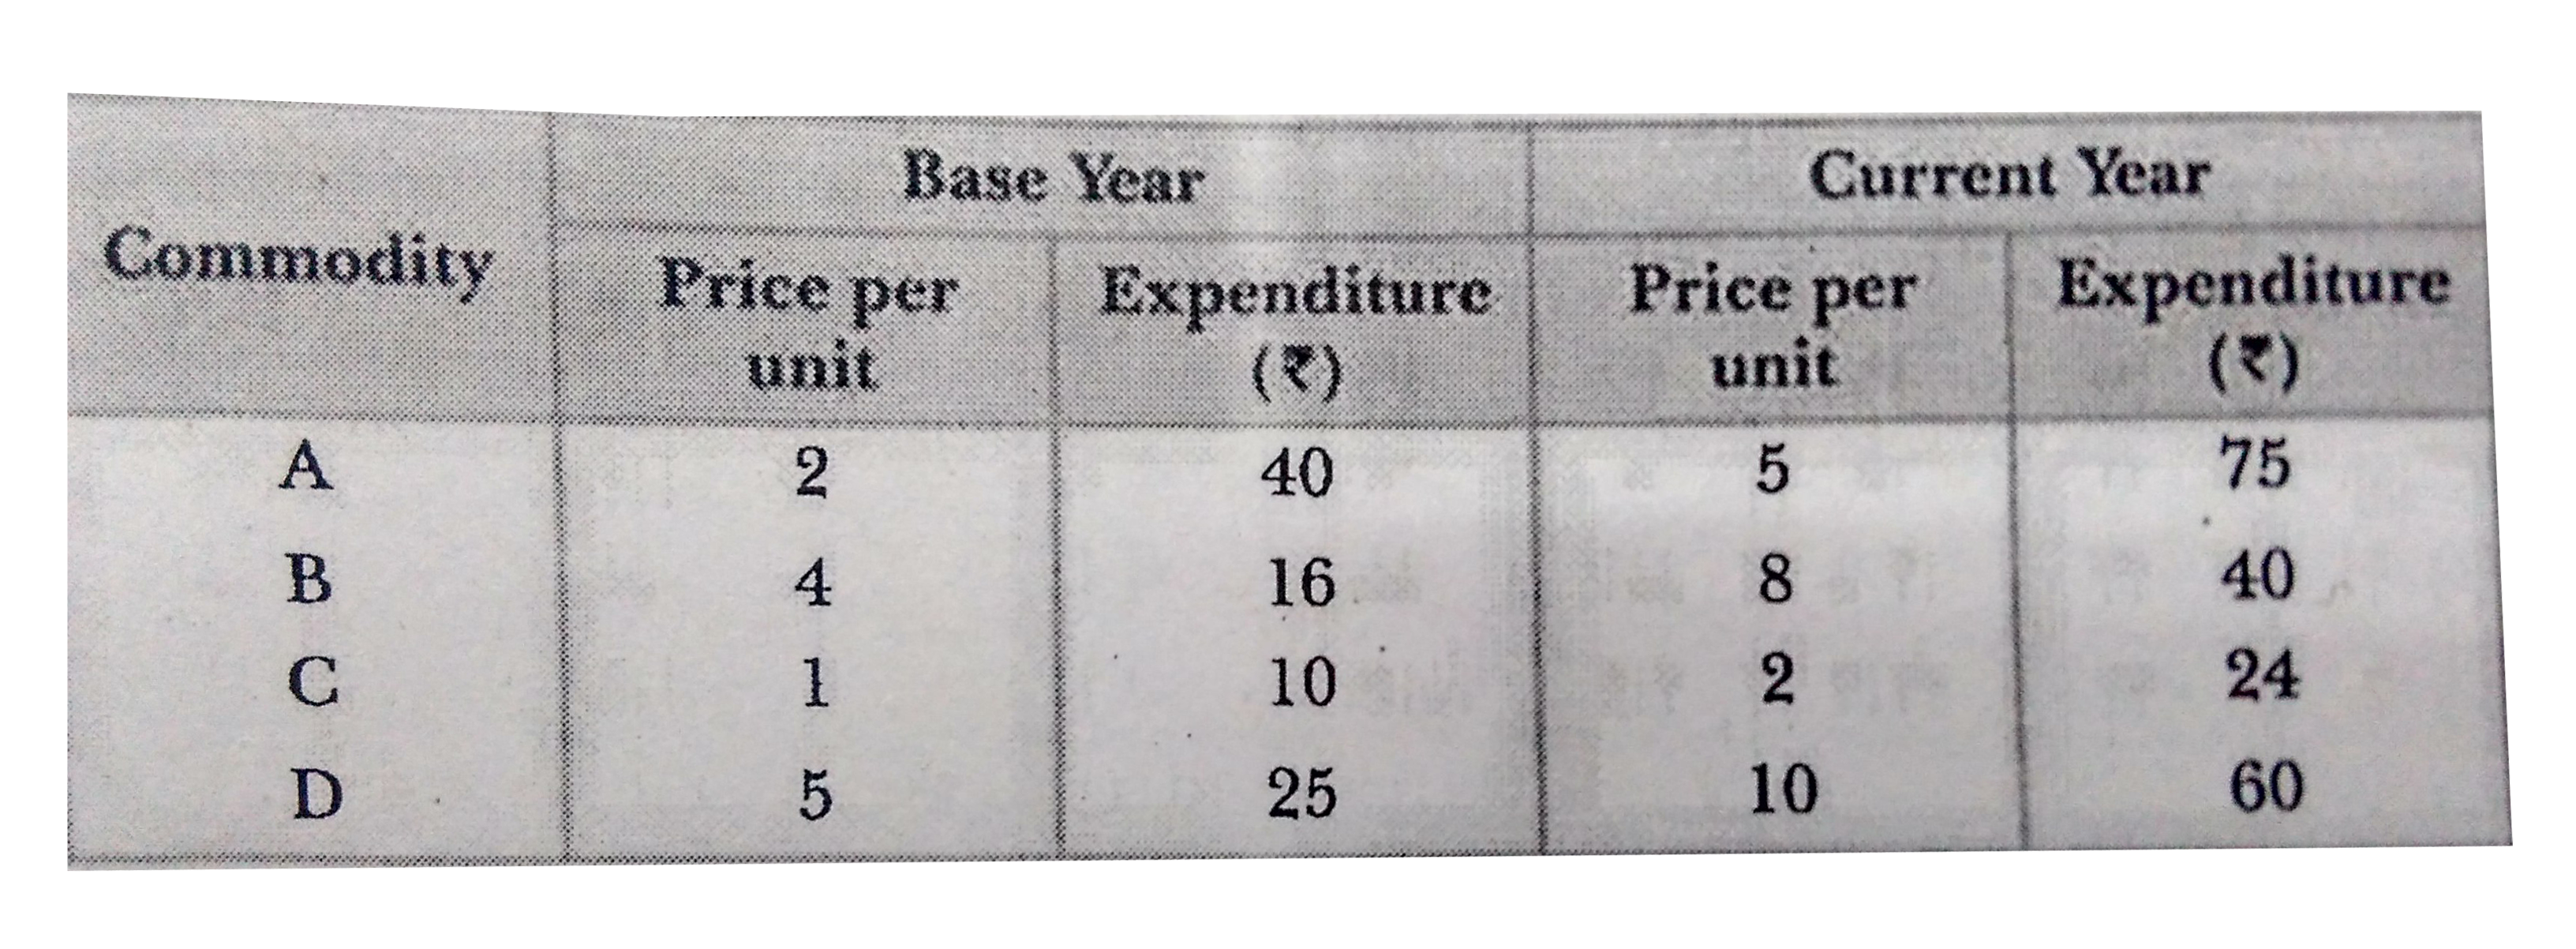
From the following data, construct a price index number by using Fisher's Ideal Formula:
 View Solution
Find MC from the following data :
 View Solution
Find MU from the following data :
 View Solution
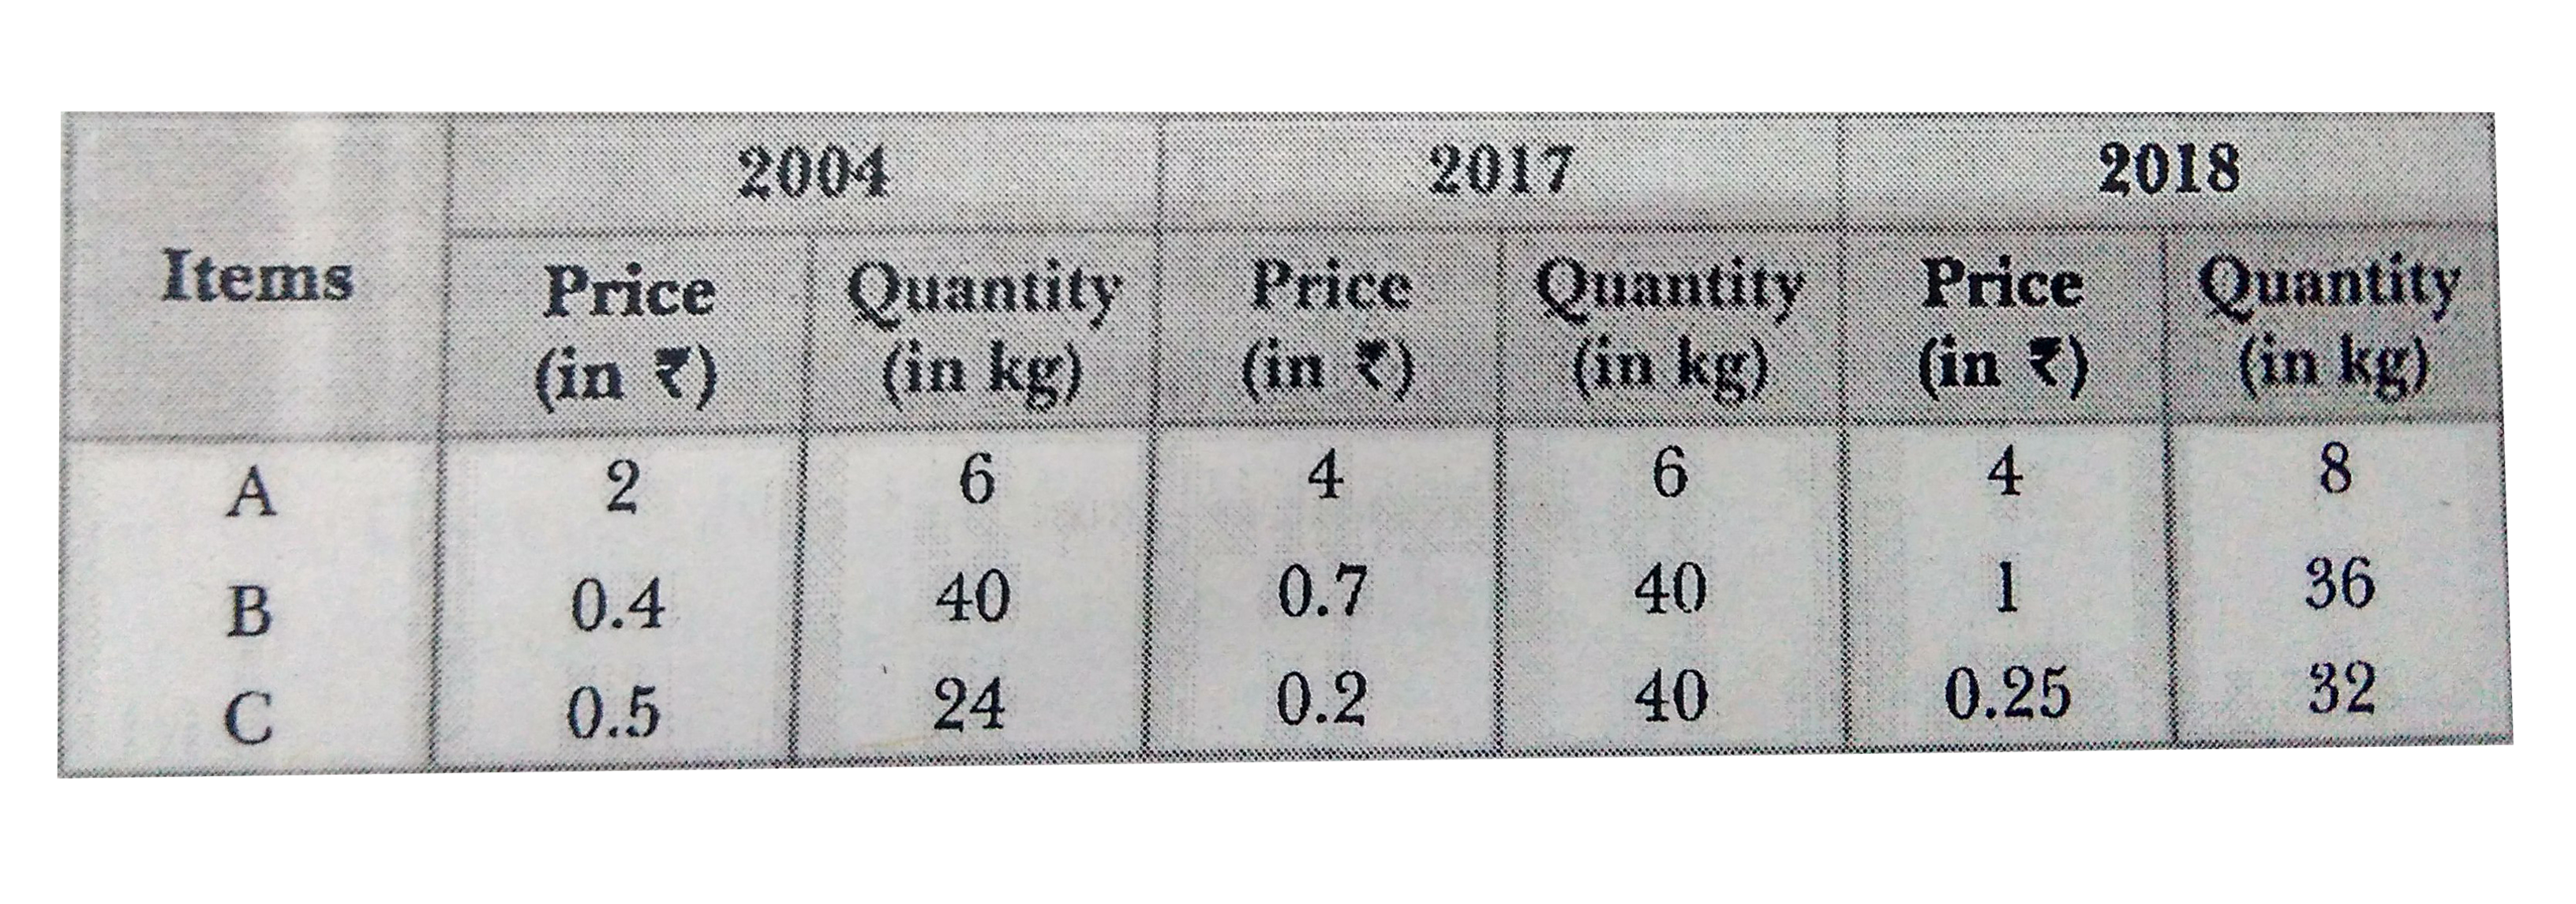
Based on the following data, construct Laspeyre's and Paasche's Price Indices for 2017 and 2018 with 2004 as base:
 View Solution
From the following data, construct frequency histogram, frequency polygon and frequency curve.
 View Solution
Construct index numbers of the following data by Fisher's Method:
 View Solution
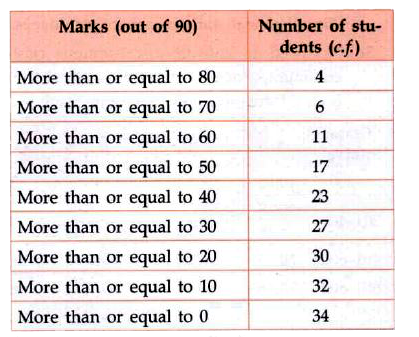
Form the frequency distribution table from the following data:
Construct the frequency distribution table for the above data.
 View Solution
From the following data, determine TR, AR and MR.
 View Solution
From the following data, find the Cost of Living Index Number of 2018 on the basis of 2004 by (i) Aggregate Expenditure Method, and (ii) Family Budget Method:
 View Solution

