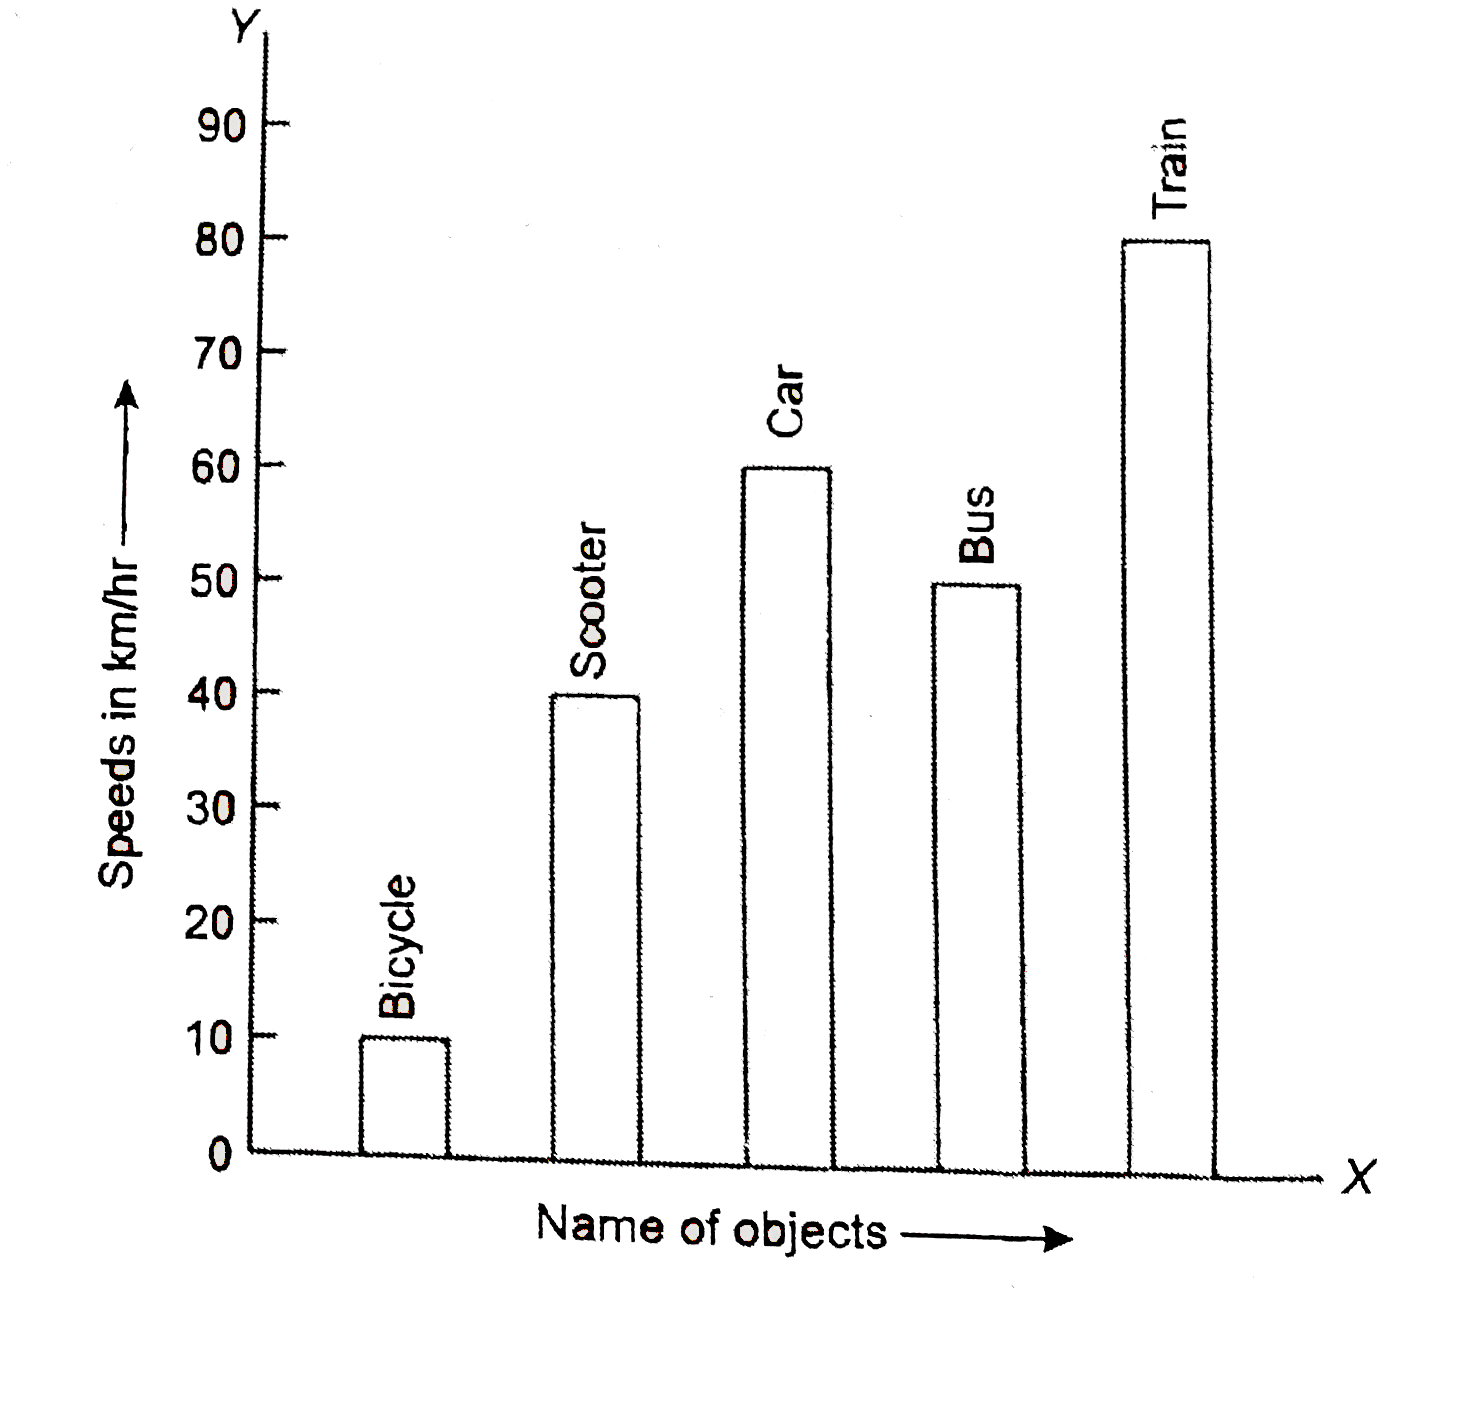
The approximate speeds of some objects are given below. Draw a bar graph to represent them:

The required bar graph is as given alongside:

Steps :
(i) Take the names of objects along X-axis and speeds along Y-axis
(ii) All the bars drawn should be of the same width.
(iii) Same spaces should be left between the consecutive bars.
Topper's Solved these Questions
- STATISTICSBOOK - NAGEEN PRAKASHANCHAPTER - STATISTICSEXERCISE - Problems From NCERT/exemplar
22 Videos
- STATISTICSBOOK - NAGEEN PRAKASHANCHAPTER - STATISTICSEXERCISE - Exercise 14a
10 Videos
- QUADRILATERALSBOOK - NAGEEN PRAKASHANCHAPTER - QUADRILATERALSEXERCISE - Revision Exercise (long Answer Questions)
5 Videos
- SURFACE AREA AND VOLUMEBOOK - NAGEEN PRAKASHANCHAPTER - SURFACE AREA AND VOLUMEEXERCISE - Revision Exercise (long Answer Questions)
10 Videos
Similar Questions
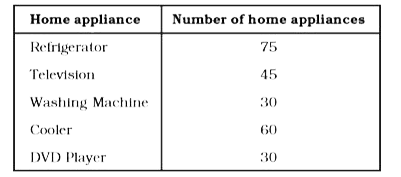
Home appliances sold by a shop in one month are given as below:

Draw a bar graph to represent the above information.
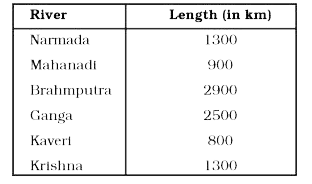
View SolutionThe lengths in km (rounded to nearest hundred) of some major rivers of India is given below:

Draw a bar graph to represent the above information.
View SolutionThe expenditure of a family of different heads in a month is given below

Draw a bar graph to represent the data above.
View SolutionThe expenditure of a family of different heads in a month is given below

Draw a bar graph to represent the data above.
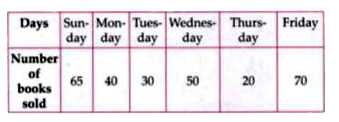
View SolutionThe number of Mathematics books sold by a shopkeeper on six consecutive days is shown below Draw a bar graph to represent the above information choosing the scale of your choice.
View SolutionThe number of Mathematics books sold by a shopkeeper on six consecutive days is shown below Draw a bar graph to represent the above information choosing the scale of your choice.
View SolutionThe percentage of marks obtained, in different subjects by Ashok Sharma (in an examination) are given below. Draw a bar graph to represent it.

View SolutionThe number of Mathematics books sold by a shopkeeper on six consecutive days is shown below :

Draw a bar graph to represent the above information choosing the scale of your choice.
View Solution70 students from a locality use different modes of transport to go to school as given below:

Draw the bar graph representing the above data.
View Solution70 students from a locality use different modes of transport to go to school as given below:
 Draw the bar graph representing the above data.
View Solution
