The number of Mathematics books sold by a shopkeeper on six consecutive days is shown below :
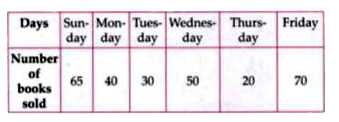
Draw a bar graph to represent the above information choosing the scale of your choice.
Step by step video & image solution for The number of Mathematics books sold by a shopkeeper on six consecutive days is shown below : Draw a bar graph to represent the above information choosing the scale of your choice. by Maths experts to help you in doubts & scoring excellent marks in Class 6 exams.
Updated on:21/07/2023Topper's Solved these Questions
- DATA HANDLING BOOK - MTG IIT JEE FOUNDATIONCHAPTER - DATA HANDLING EXERCISE - Exercise (Multiple Choice Questions) Level -1
35 Videos
- DATA HANDLING BOOK - MTG IIT JEE FOUNDATIONCHAPTER - DATA HANDLING EXERCISE - Exercise (Multiple Choice Questions) Level -2
16 Videos
- DATA HANDLING BOOK - MTG IIT JEE FOUNDATIONCHAPTER - DATA HANDLING EXERCISE - NCERT Section (Exercise 9.3)
11 Videos
- BASIC GEOMETRICAL IDEASBOOK - MTG IIT JEE FOUNDATIONCHAPTER - BASIC GEOMETRICAL IDEASEXERCISE - OLYMPIAD/HOTS CORNER
10 Videos
- DECIMALSBOOK - MTG IIT JEE FOUNDATIONCHAPTER - DECIMALSEXERCISE - OLYMPIAD/HOTS CORNER
20 Videos
Similar Questions
The number of ATMs of different banks in a city is shown below:
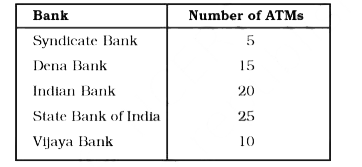
Draw a bar graph to represent the above information by choosing the scale of your choice.
View SolutionHome appliances sold by a shop in one month are given as below:
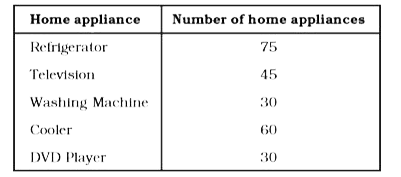
Draw a bar graph to represent the above information.
View SolutionThe number of bottles of cold drinks sold by a shopkeeper on six consecutive days is as follows:

Prepare a pictograph of the above data using an appropriate symbol
View SolutionNumber of mobile phone users in various age groups in a city is listed below:
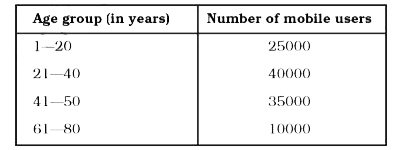
Draw a bar graph to represent the above information.
View SolutionThe lengths in km (rounded to nearest hundred) of some major rivers of India is given below:
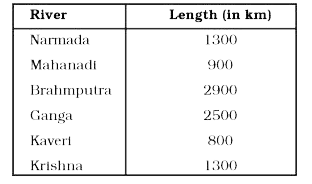
Draw a bar graph to represent the above information.
View SolutionThe sales of a shopkeeper in the first week of january 2012, are given below :

Draw a graph representing the above data.
View SolutionThe given table shows the number of tourists who visited Taj Mahal during different months. Month

Draw a bar graph to represent the above information by using appropriate scale.
View SolutionThe number of hours spent by a school boy in different activities in a day is given below:

Represent the above information using pie diagram.
View SolutionNumber of persons in various age groups in a town is given in the following tableDraw a bar graph to represent the above information and answer the following questions. (take 1 unit length = 20 thousands)(a) Which two age groups have same population?(b) All persons in the age group of 60 and above are called senior citizens. How many senior citizens are there in the town?
View SolutionThe table represents number of tourists visiting a zoo for 5 months.

Make a bar graph representing the above information.
View Solution
