The population of four major cities in India in a particular year is given below: City: Mumbai Kolkata Delhi Chennai No. of Students: 120 130 150 80 Construct a bar graph to represent the above data.
To construct a bar graph representing the number of students in four major cities in India, follow these steps:
Step 1: Prepare the Axes
1. Draw the Axes: Start by drawing two perpendicular lines to form the x-axis (horizontal) and y-axis (vertical).
2. Label the Axes:
- On the x-axis, label the cities: Mumbai, Kolkata, Delhi, and Chennai.
- On the y-axis, label the number of students.
1. Draw the Axes: Start by drawing two perpendicular lines to form the x-axis (horizontal) and y-axis (vertical).
2. Label the Axes:
- On the x-axis, label the cities: Mumbai, Kolkata, Delhi, and Chennai.
- On the y-axis, label the number of students.
Topper's Solved these Questions
Similar Questions
Given below is the data of school going students (boys and girls):

Draw the bar graph to represent the above data.View SolutionThe production of oil (in lakh tonnes) in some of the refineries in India during 2008 is given below :
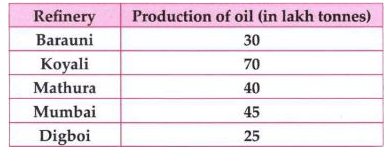
Construct a bar graph to represent the above dataView SolutionNumber of mobile phone users in various age groups in a city is listed below:
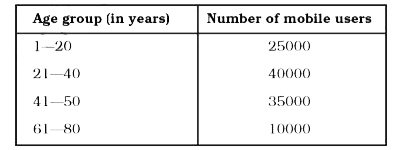
Draw a bar graph to represent the above information.View SolutionThe marks obtained (out of 100) by a class of 80 students are given below:

Construct a histogram to represent the data aboveView SolutionThe line graph shows the temperature on four sundays of three cities
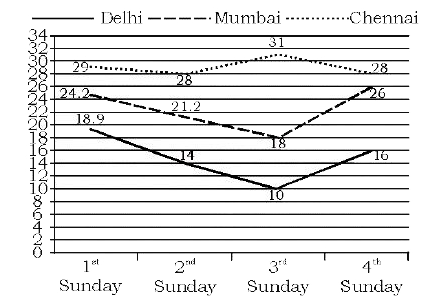
In the given line graph what was the difference in temperature between Delhi and Mumbai on the 2nd Sunday?View SolutionThe daily maximum and minimum temperature of a city during one week in the month a April is given below. Construct a double bar graph using this data
 View Solution
The daily pocket expenses of 206 students in a school are given below.

Construct a frequency polygon representing the above data.View SolutionThe daily pocket expenses of 206 students in a school are given below.

Construct a frequency polygon representing the above data.View SolutionThe lengths in km (rounded to nearest hundred) of some major rivers of India is given below:
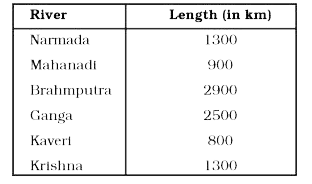
Draw a bar graph to represent the above information.View SolutionThe number of ATMs of different banks in a city is shown below:
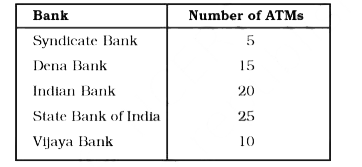
Draw a bar graph to represent the above information by choosing the scale of your choice.View Solution

