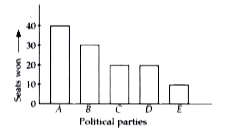
Given below are the seats won by different political parties in the polling outcome of a state assembly elections

(i) Draw a bar graph to represent the polling results.
(ii) Which political party won the maximum number of seats?
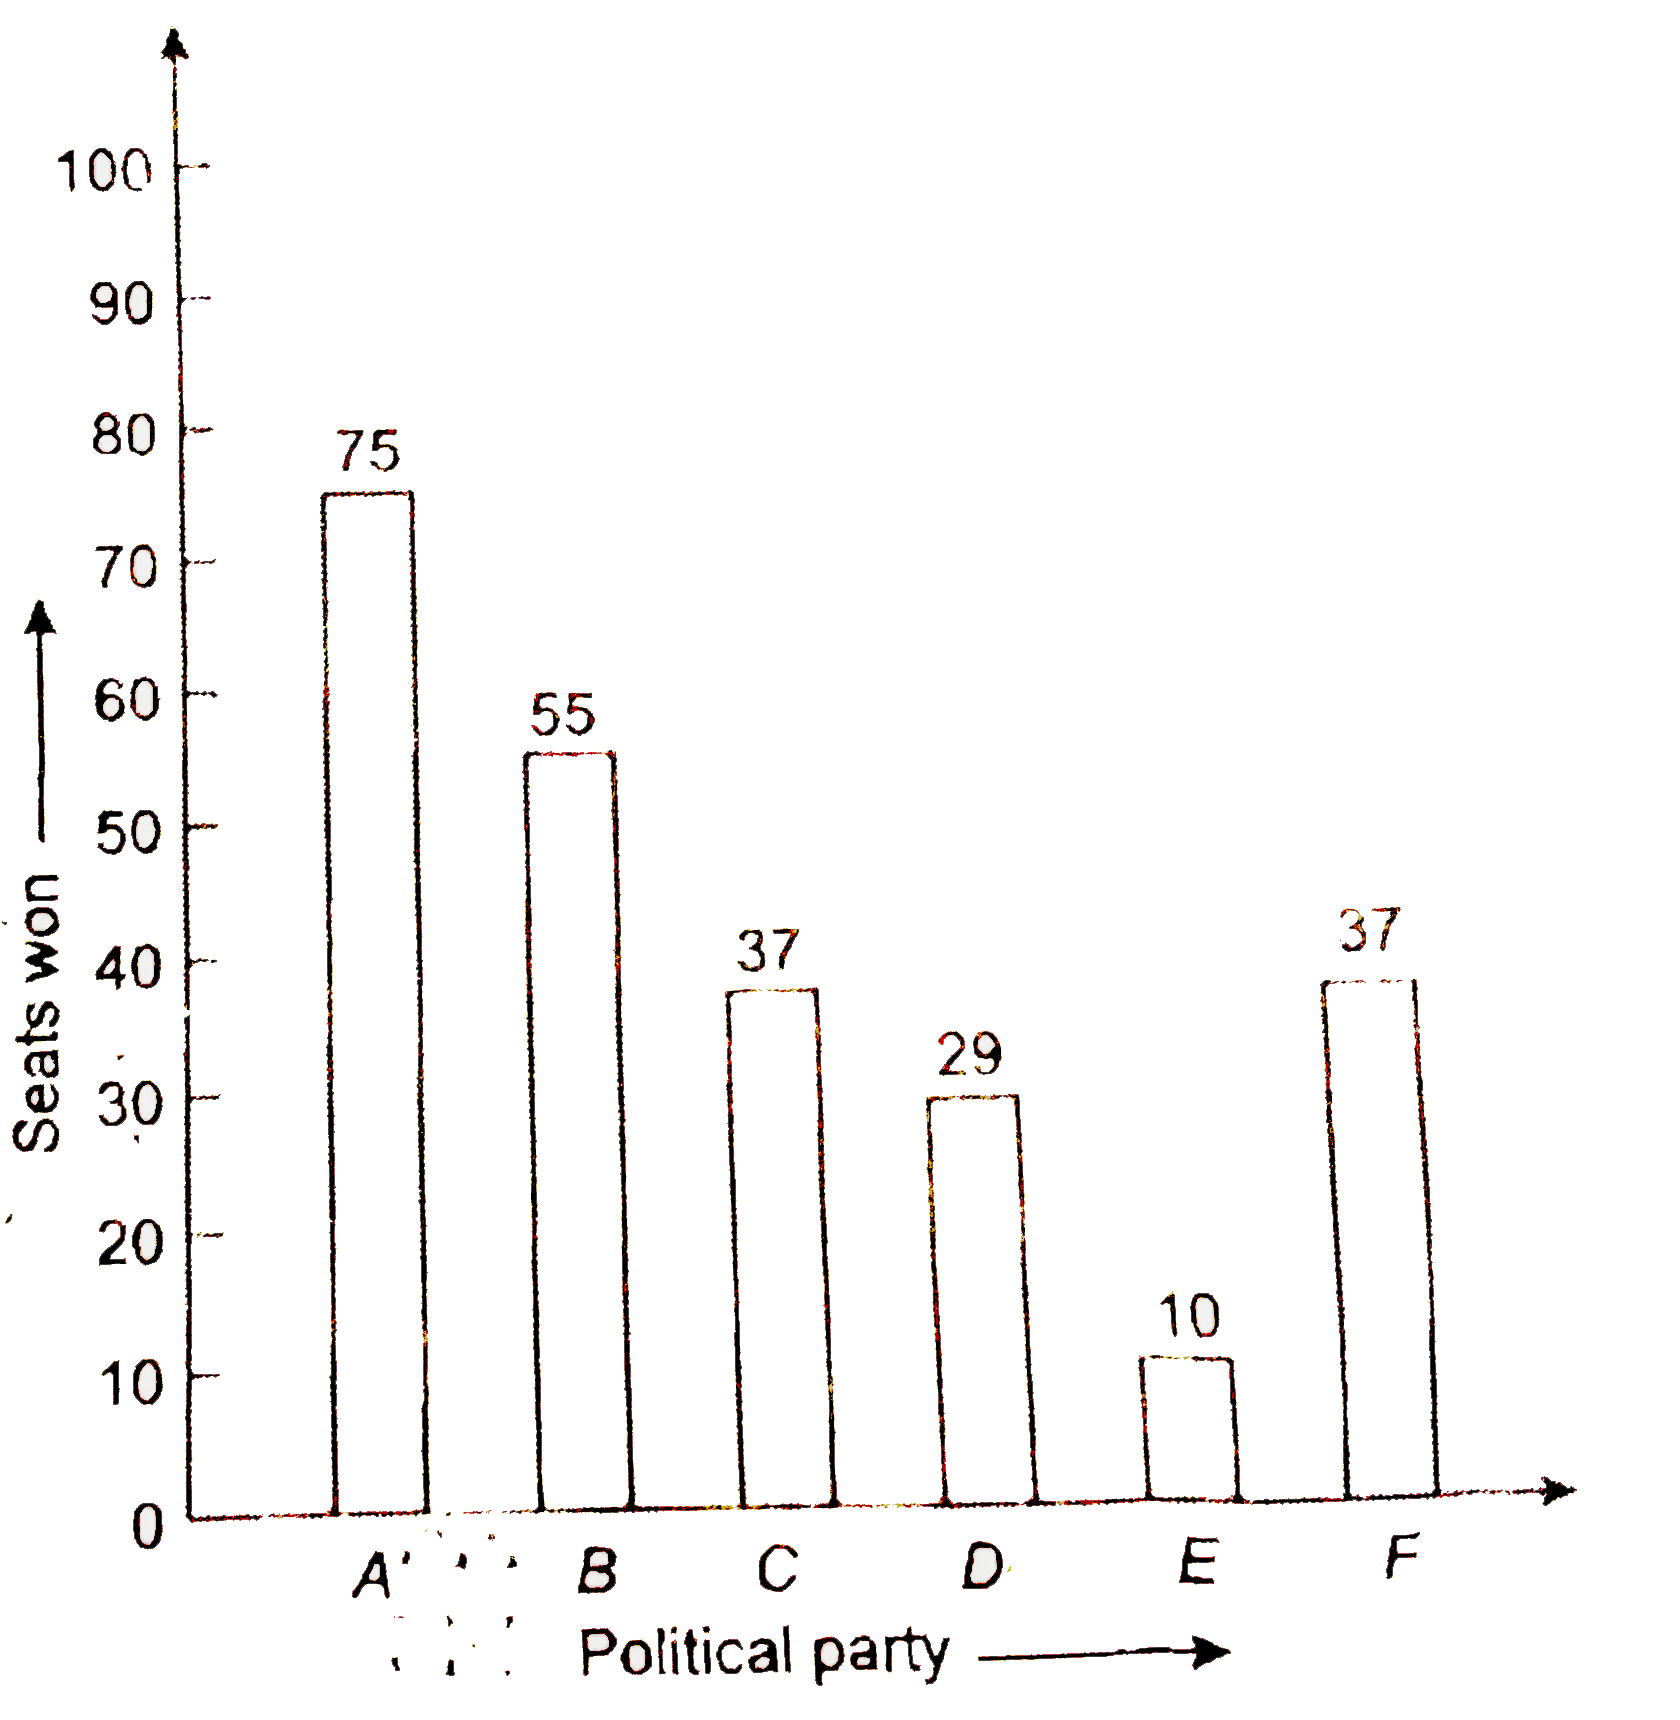
We draw the bar graph of this data, note that the unit in the second column is seats won by political party.
(i) We represent the political party on the horizontal axis choosing any scale since width of the bar is not important but for clarity, we take equal widths for all bars and maintain equal gaps in between. Let on political party be represented by one unit.
(ii) We represented the seats won on the vertical axis.
Here, we can choose the scale as 1 unit = 10
Now, the graph is drawn in figure.
Party 'A' won the maximum number of seats i.e., 75.
Topper's Solved these Questions
- STATISTICSBOOK - NAGEEN PRAKASHANCHAPTER - STATISTICSEXERCISE - Exercise 14a
10 Videos
- STATISTICSBOOK - NAGEEN PRAKASHANCHAPTER - STATISTICSEXERCISE - Exercise 14c
20 Videos
- STATISTICSBOOK - NAGEEN PRAKASHANCHAPTER - STATISTICSEXERCISE - Revision Exercise
10 Videos
- QUADRILATERALSBOOK - NAGEEN PRAKASHANCHAPTER - QUADRILATERALSEXERCISE - Revision Exercise (long Answer Questions)
5 Videos
- SURFACE AREA AND VOLUMEBOOK - NAGEEN PRAKASHANCHAPTER - SURFACE AREA AND VOLUMEEXERCISE - Revision Exercise (long Answer Questions)
10 Videos
Similar Questions
Given below are the seats won by different political parties in the polling outcome of a state assembly elections :

Which political party won the minimum number of seats?
View SolutionGiven below are the seats won by different political parties in the polling outcome of a state assembly elections :

Which political party won the maximum number of seats?
View Solution
Knowledge Check
The political party that won the majority of seats in 2017 Uttarakhand Legislative Assembly Elections is_____
ASPBBJPCRPIDBSP
Observe the bar graph and answer the following questions.
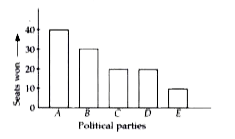
Which two political parties won the same number of seats?
View SolutionThe given bar graph represents the sale of cars in five different states in a month.
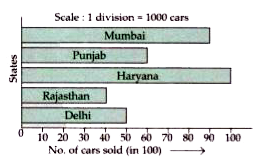
Which state sold maximum number of cars ?
View SolutionIn a botanical garden, the number of different types of plants are found as follows:
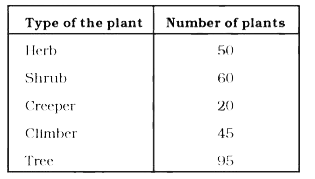
Draw a bar graph to represent the above information and answer the following question:
Which type of plant is maximum in number in the garden?
View SolutionObserve the bar graph and answer the following questions.
What is the total number of seats won by party A and party B?
View SolutionOne upon a time a round of Election to the five Legislative Assemblies of the country was in progress. The different political parties were putting in the best of their efforts to entice the people elections in these states. One of the political parties made a promise that if they came into power, they would set up such public sector enterprises in the states which will have the partnership of both the public and the government. However in these enterprises, the ownership of the government shall not be less than 51% . The setting up of these enterprises is done as per the provisions of the Indian Companies Act, 2013. The financing of these enterprises is done jointly by both, the people and the government. The second political party promised that if theyc came into power, they would set up such public sector enterprises which will be completely under the ownership of the government. The burden of financing them will not be put on the shoulders of the people, but they will be managed with the general budget. The third political party, which was contesting the elections for the first time, promised that on coming into power they will be no bar to get loan from the people to set up them. They will be set up as per the special Act passed by the Parliament or the State Legislative Assembly.
On the basis of the above para, Identify the type of public sector enterprises to be set up as being promised by the three political particles. Also state any two merits of each of them
View SolutionOnce upon a time a round of Election to the five Legislative Assemblies of the country was in progress. The different political parties were putting in the best of their efforts to entice the people through their respective promises to them. There were three main political parties contensting elections in the test states . One of the political parties made a promise that if they came into power, they would set up such public sector enterprises in the states which will have the partnership of both the public and the government . However, in these enterprises, the ownership of the government shall not be less than 51% . The setting up of these enterprises is done as per the provisions of the Indian Companies Act, 2013. The financing of these enterprises is done jointly by both , the people and the government . The second political party promised that if they came into power, they would set up such public sector enterprises which will be completely under the ownership of the government . The burden of financing them will not be put on the shoulders of the people , but they will be managed with the general budget . The third political pary, which was contesting the elections for the first time promised that on coming into power they would set up such public sector enterprises which will be fully financed by the government . However , there will no bar to get loan from the people to set up them. They will be set up as per the special Act passed by the Parliament or the State Legislative Assembly.
On the basis of the above para, identify the type of public sector enterprises to be set up to being promised by the three political parties. Also state any two merits of each of them.
View SolutionParties and the seats won by them are listed in the following table.
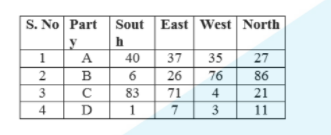
Based on the given data, the total number of candidates elected is ________ .
View Solution
