Observe the bar graph and answer the following questions.
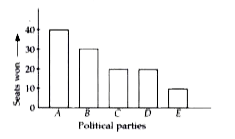
Which two political parties won the same number of seats?
C, D
C, E
D, E
B, D
The correct Answer is:A
Step by step video & image solution for Observe the bar graph and answer the following questions. Which two political parties won the same number of seats? by Maths experts to help you in doubts & scoring excellent marks in Class 6 exams.
Updated on:21/07/2023Topper's Solved these Questions
- DATA HANDLING BOOK - MTG IIT JEE FOUNDATIONCHAPTER - DATA HANDLING EXERCISE - Exercise (Match the following)
2 Videos
- DATA HANDLING BOOK - MTG IIT JEE FOUNDATIONCHAPTER - DATA HANDLING EXERCISE - Exercise (Assertion & Reason Type )
5 Videos
- DATA HANDLING BOOK - MTG IIT JEE FOUNDATIONCHAPTER - DATA HANDLING EXERCISE - Exercise (Multiple Choice Questions) Level -1
35 Videos
- BASIC GEOMETRICAL IDEASBOOK - MTG IIT JEE FOUNDATIONCHAPTER - BASIC GEOMETRICAL IDEASEXERCISE - OLYMPIAD/HOTS CORNER
10 Videos
- DECIMALSBOOK - MTG IIT JEE FOUNDATIONCHAPTER - DECIMALSEXERCISE - OLYMPIAD/HOTS CORNER
20 Videos
Similar Questions
Study the bar graph and answer the following questions.
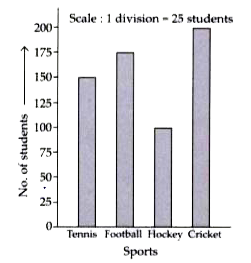
Which is the most popular sport ?
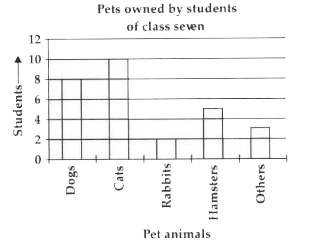
View SolutionUse the bar graph to answer the following questions
Which is the most popular pet ?
View SolutionStudy the bar graph and answer the following questions.
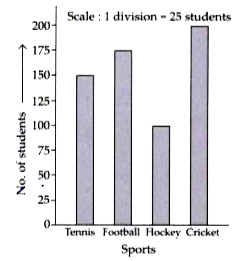
Which sport is preferred least ?
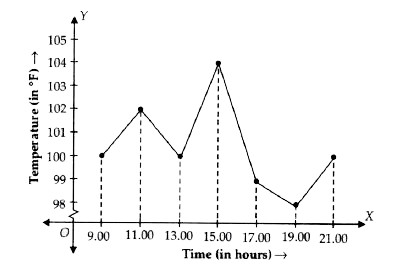
View SolutionObserve the graph and answer the following questions.
The temperature is maximum at
View SolutionThe following bar graph represents the data for different sizes of shoes worn by the students in a school. Read the graph and answer the following questions.
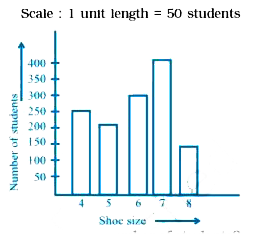
Which shoe size is worn by the maximum number of students?
View SolutionObserve the bar graph and answer the following questions.
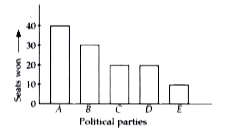
What is the total number of seats won by party A and party B?
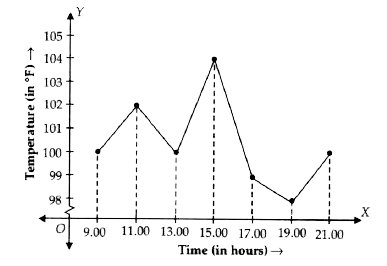
View SolutionObserve the graph and answer the following questions.
The temperature is minimum at
View SolutionLook at the bar graph and answer the following questions.
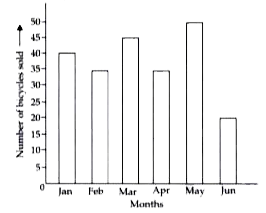
In which month 40 bicycles were sold?
View SolutionThe following bar graph shows the number of houses (out of 100) in a town using different types of fuels for cooking.
Read the bar graph and answer the following questions:
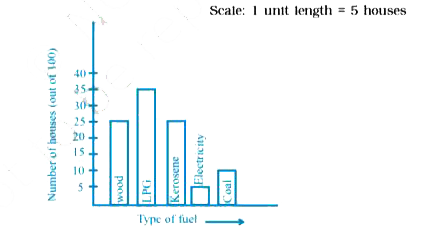
Which fuel is used in maximum number of houses?
View SolutionGiven below are the seats won by different political parties in the polling outcome of a state assembly elections

(i) Draw a bar graph to represent the polling results.
(ii) Which political party won the maximum number of seats?
View Solution
