The ends of a metal bar of constant cross-sectional area are maintained at temperatures T1andT2 which are both higher than the temperature of the surroundings. If the bar is unlagged, which one of the following sketches best represents the variation of temperature with distance along the bar ?
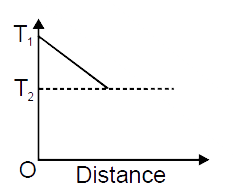
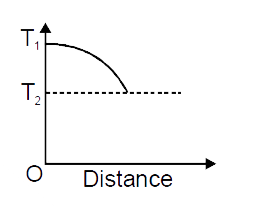
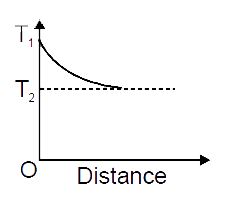
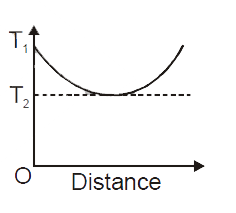
The correct Answer is:C
Step by step video, text & image solution for The ends of a metal bar of constant cross-sectional area are maintained at temperatures T_1 and T_2 which are both higher than the temperature of the surroundings. If the bar is unlagged, which one of the following sketches best represents the variation of temperature with distance along the bar ? by Physics experts to help you in doubts & scoring excellent marks in Class 12 exams.
Topper's Solved these Questions
- BOOK - MOTIONCHAPTER - HEAT - 1EXERCISE - EXERCISE -2 (Level - I) Objective Problems | JEE Main24videos
HEAT - 1
- BOOK - MOTIONCHAPTER - HEAT - 1EXERCISE - EXERCISE -2 (Level - II) Multiple Correct | JEE Advanced16videos
HEAT - 1
- BOOK - MOTIONCHAPTER - HEAT - 1EXERCISE - EXERCISE -4 (Level - II) Previous Year | JEE Advanced22videos
HEAT - 1
- BOOK - MOTIONCHAPTER - GRAVITATIONEXERCISE - Exercise - 4 Section - B Previous Years Problems15videos
GRAVITATION
- BOOK - MOTIONCHAPTER - HEAT TRANSFER & THERMAL EXPANSION EXERCISE - Exercise - 3 Section-B19videos
HEAT TRANSFER & THERMAL EXPANSION
Similar Questions
Knowledge Check
- Question 1 - Select One
Which of the following curve represent variation of density of water with temperature best-
A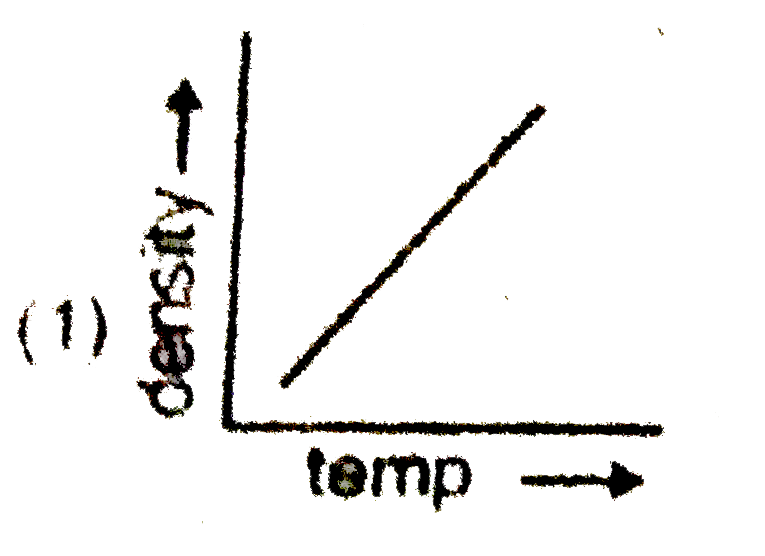 B
B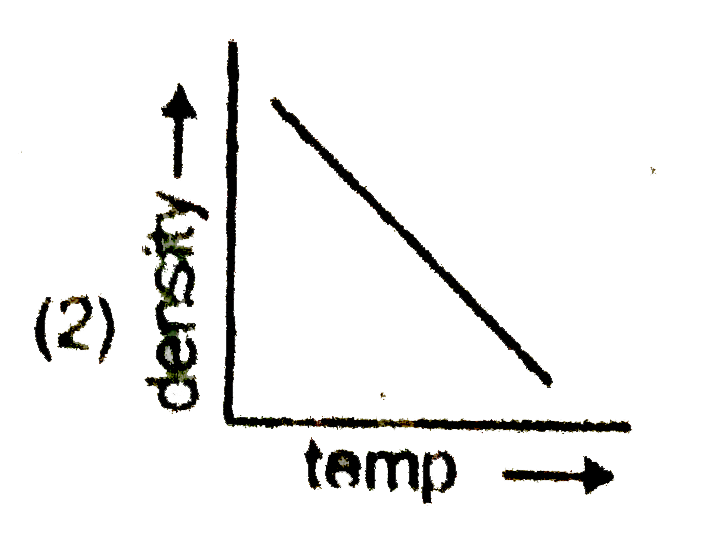 C
C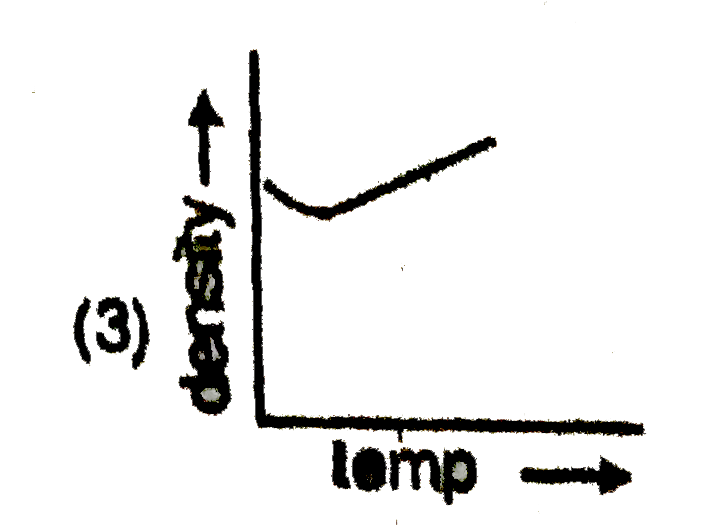 D
D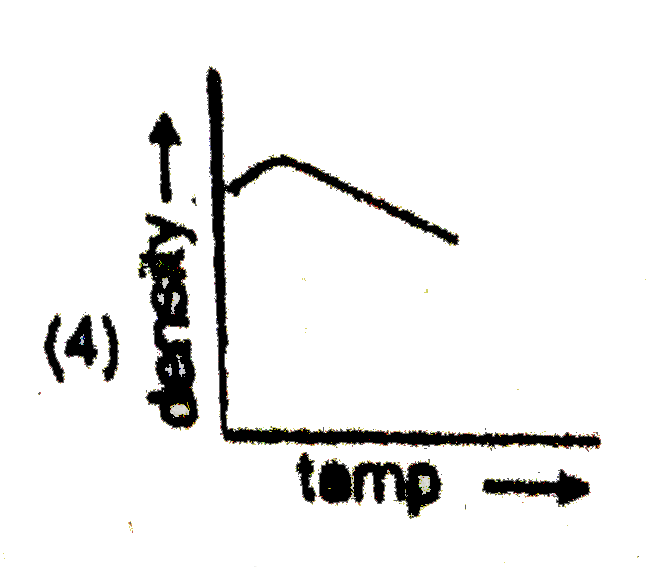
- Question 2 - Select One
Which one of the following represents correctly the variations of surface tension with temperature θ ?
AT∝θBT∝θ−1CT∝θ2DT∝θ−2 - Question 3 - Select One
which of the following graph represents the variation of resistivity (ρ) with temperature (T) for copper?
A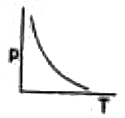 B
B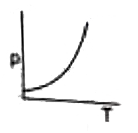 C
C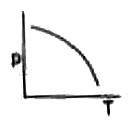 D
D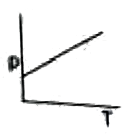
Which one of the following given graphs represents the variation of rate constant (k) with temperature (f) for an endothermic reaction ?
View SolutionArrhenius equation is :
k=Ae−E/RT
Which of the following graphs represents the variation of rate constant k against temperatureT ?View SolutionA thin piece of thermal conductor of constant thermal conductivity insulated on the lateral sides connects two reservoirs which are maintained at temperatures T1 and T2 as shown. Assuming that the system is in steady state, which of the following plots best represents the dependence of the rate of change of entropy of the ratio of temperatures T1/T2
 View Solution
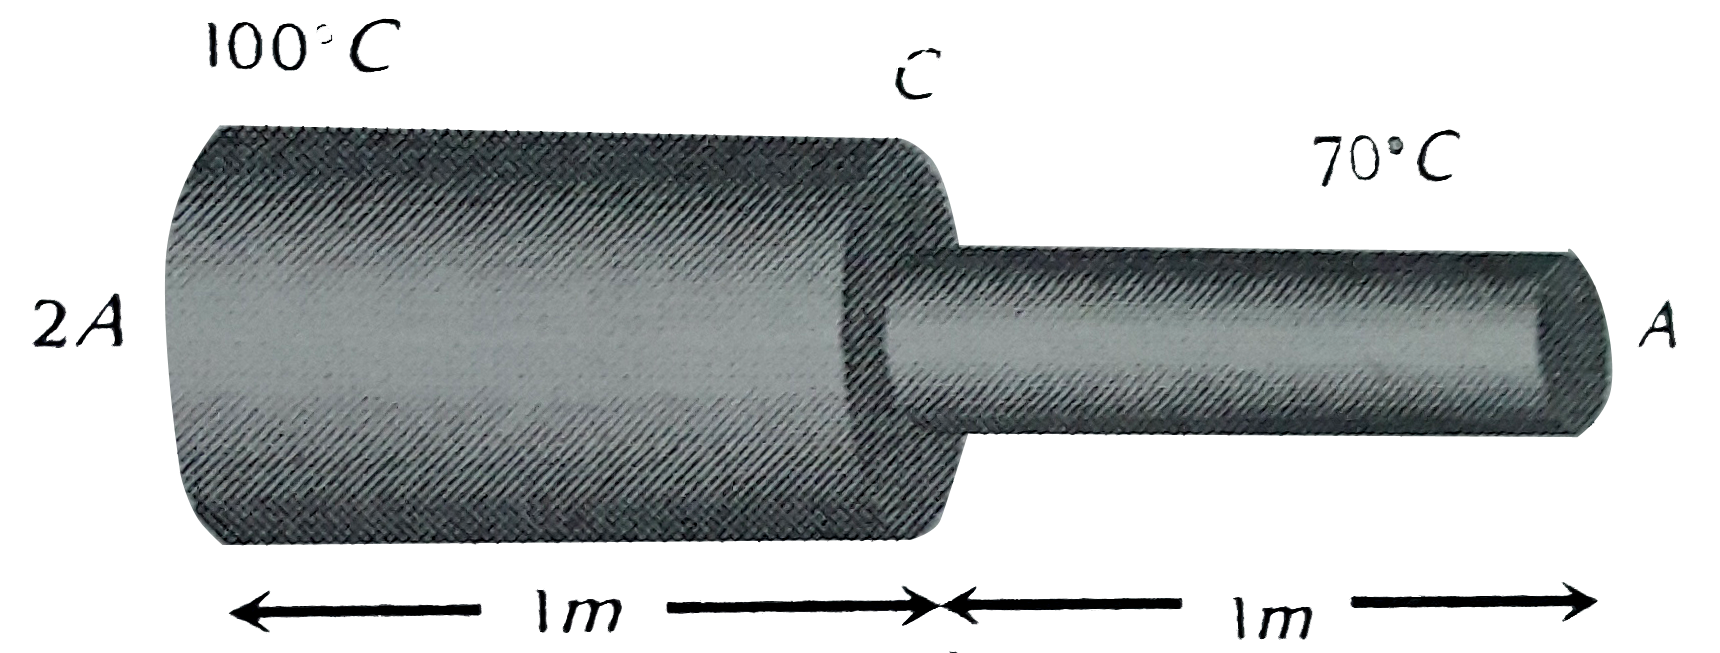
A metal rod of length 2 m has cross sectional areas 2 A and A as shown in figure. The ends are maintained at temperatures 100° C and 70° C . The temperature at middle point C is
 View Solution
The given curve represents the variation of temperatue as a function of volume for one mole of an ideal gas. Which of the following curves best represents the variation of pressure as a function of volume ?
(##DCP_V03_C20_E01_099_Q01##).View Solution

