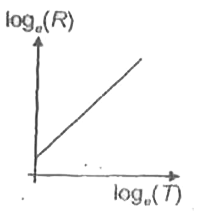
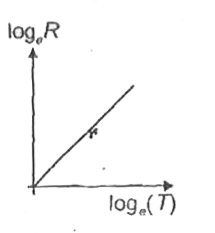
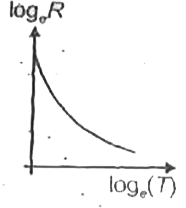
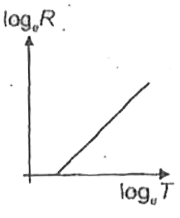
If an object at absolute temperature (1) radiates energy at rate R, then select correct graph showing the variation of loge R with loge (T).
To solve the problem of determining the correct graph showing the variation of logeR with logeT, we will follow these steps:
1. Understand the relationship: According to Stefan-Boltzmann law, the rate of energy radiation R from a body is proportional to the fourth power of its absolute temperature T. This can be expressed mathematically as:
R=σ⋅A⋅T4
where σ is the Stefan-Boltzmann constant and A is the surface area of the object.
2. Rearranging the equation: We can express R in terms of T:
R=k⋅T4
where k=σ⋅A is a constant.
3. Taking logarithms: To analyze the relationship between R and T, we take the natural logarithm (base e) of both sides:
logeR=loge(k⋅T4)
4. Applying logarithmic properties: Using the properties of logarithms, we can expand the right-hand side:
logeR=logek+loge(T4)
logeR=logek+4logeT
5. Identifying the graph: This equation can be rearranged to fit the linear form y=mx+c:
logeR=4logeT+logek
Here, y=logeR, x=logeT, the slope m=4, and the y-intercept c=logek.
6. Graph characteristics: Since the relationship is linear, the graph of logeR versus logeT will be a straight line with a slope of 4. The line will intersect the y-axis at logek (a positive value since k is positive).
7. Conclusion: The graph will have a positive slope and will be a straight line. The correct graph that represents this relationship is the one that shows a straight line with a slope of 4.
R=σ⋅A⋅T4
where σ is the Stefan-Boltzmann constant and A is the surface area of the object.
R=k⋅T4
where k=σ⋅A is a constant.
logeR=loge(k⋅T4)
logeR=logek+loge(T4)
logeR=logek+4logeT
logeR=4logeT+logek
Here, y=logeR, x=logeT, the slope m=4, and the y-intercept c=logek.
Similar Questions
Knowledge Check
The correct graph which shows the variation of paramagnetic susceptibility S with temperature T is
A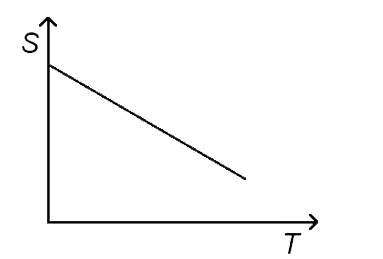 B
B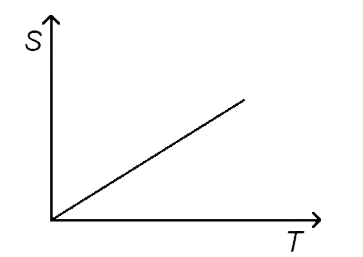 C
C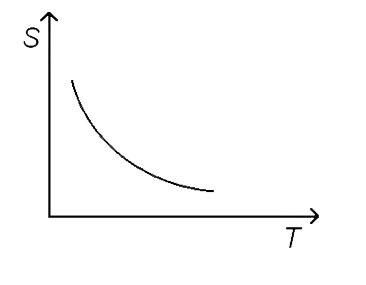 D
D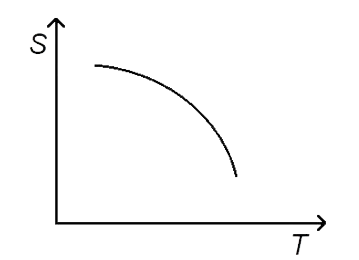
Draw the graph of y=1logex
View SolutionDraw the graph of y=|loge|x||.
View SolutionDraw the graph of y=loge(sinx).
View SolutionDifferentiation of loger logexw.r.t.log15x is
View SolutionDraw the graph of y=|loge(x+3)|.
View SolutionDraw the graph of y=(logex)2
View SolutionOn the same draw the graphs of exandlogex.
View Solution
