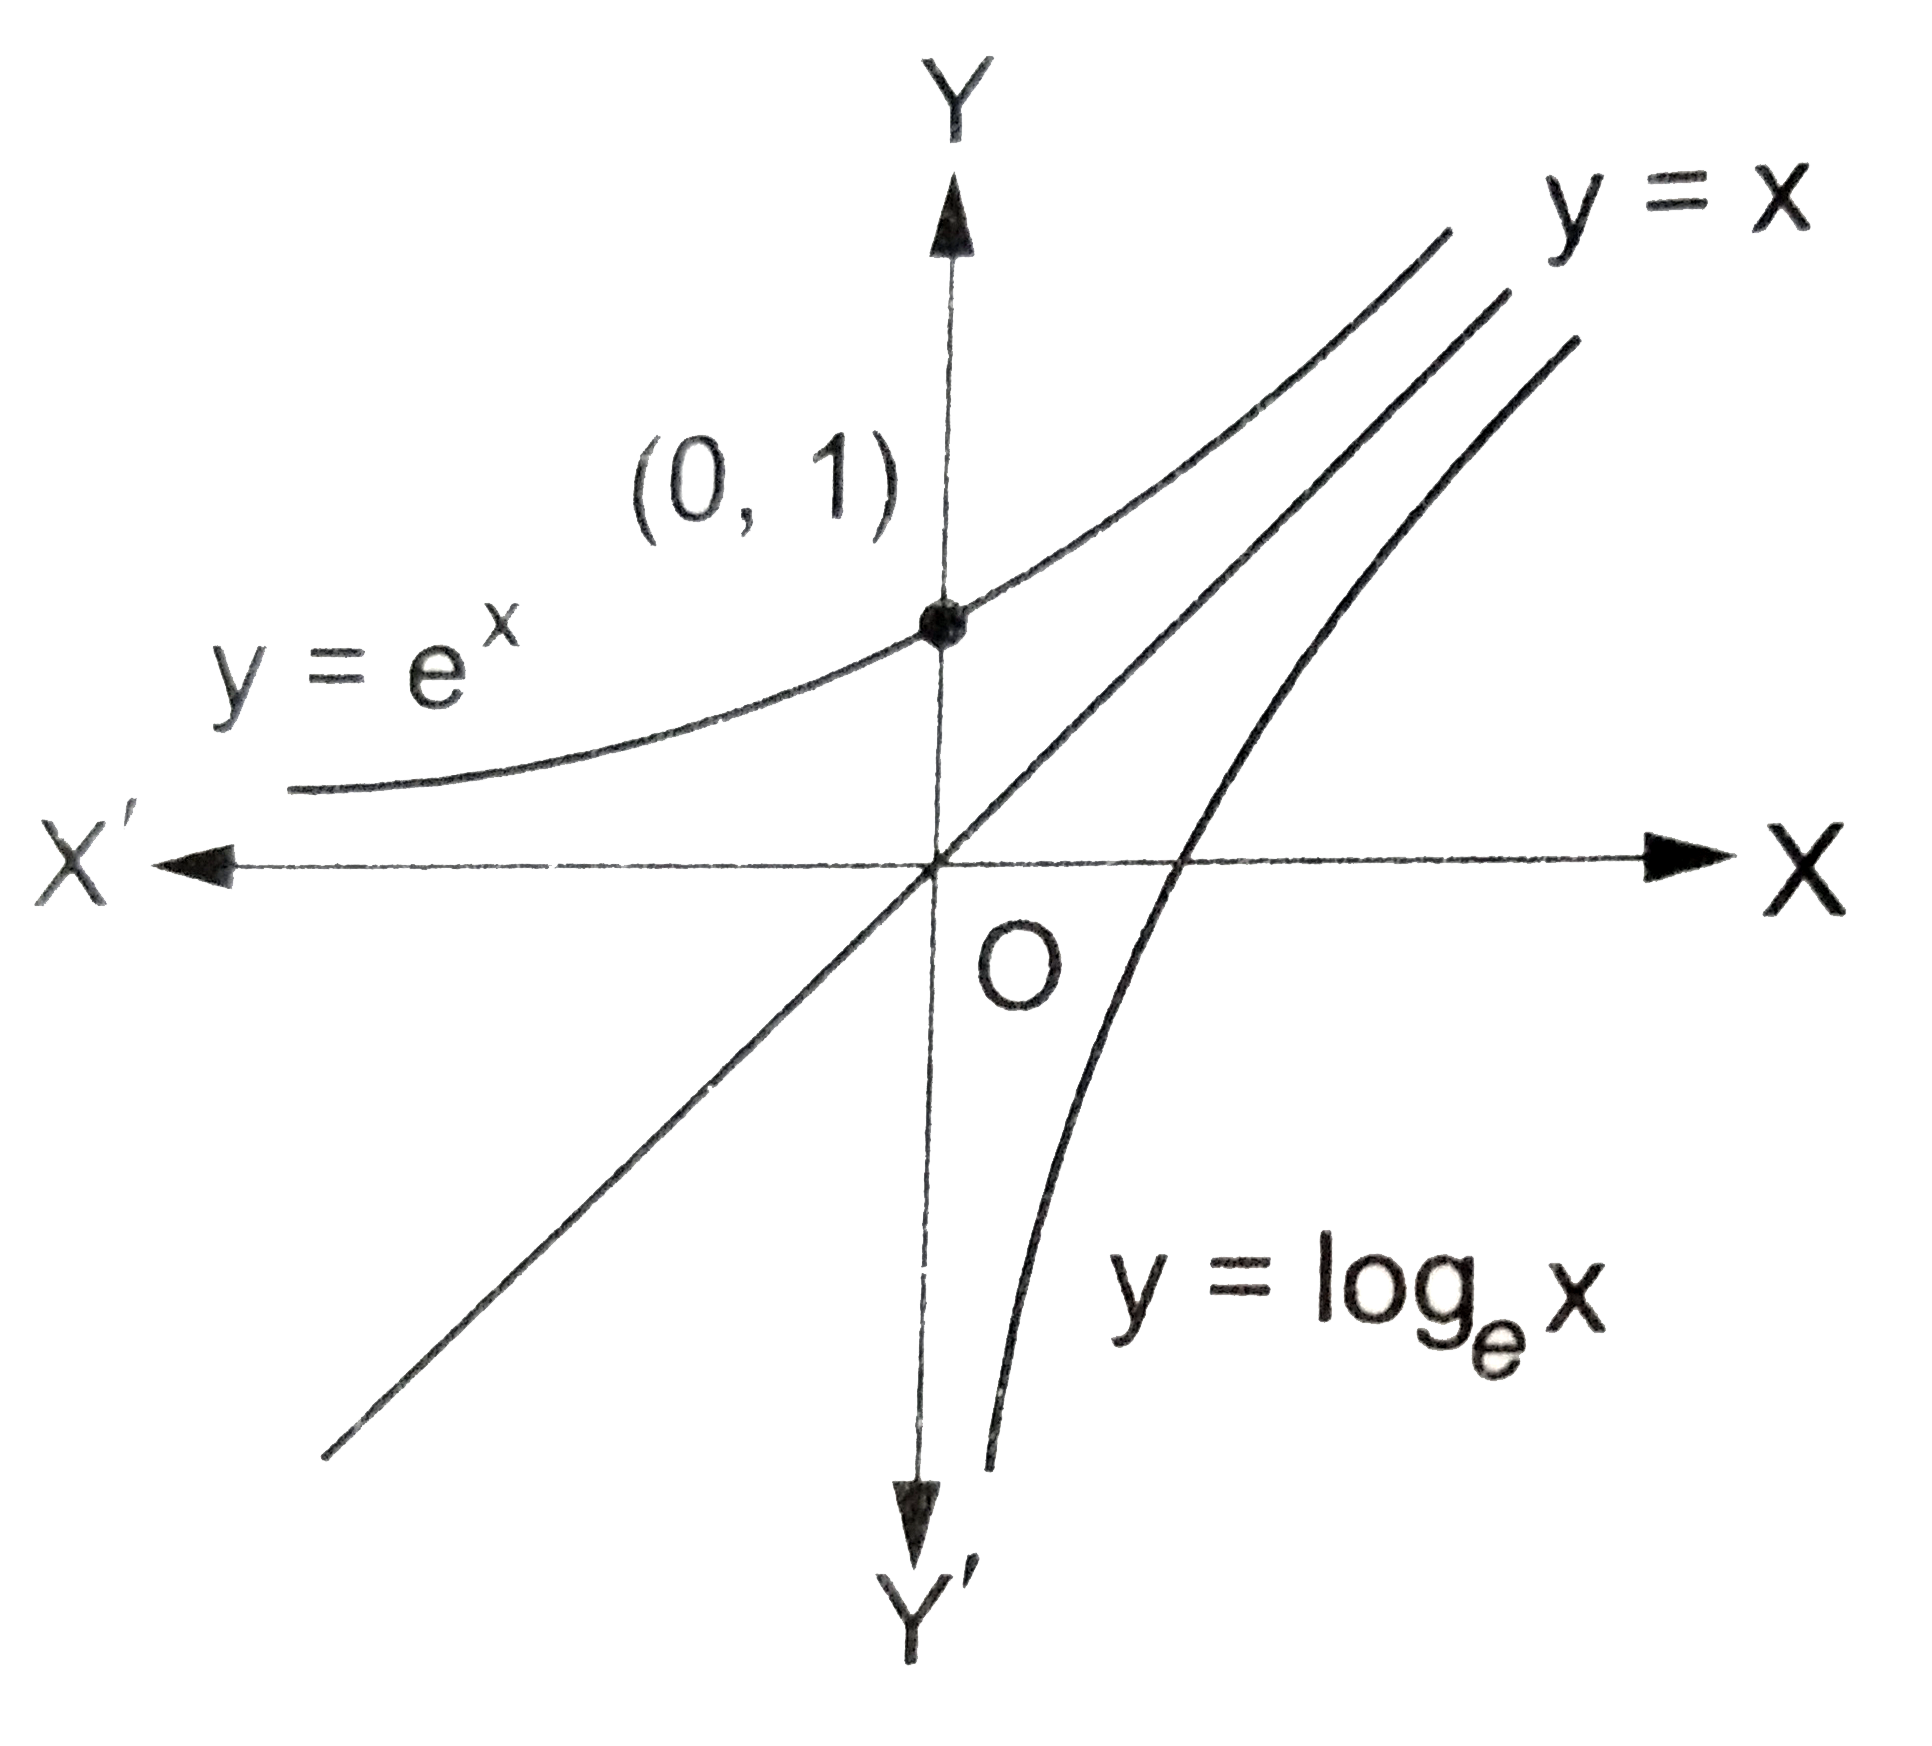
On the same draw the graphs of exandlogex.
Video Solution
Text Solution
Since e lies between 2 and 3. it follows that e>1. So, it is a particular case of ax), where a>1 , the function ex is strictly increasing . Also, its range is R. So, the funcation is one-one onto and therefore invertible.
The graph passes through the point (0,1) and comes closer and closer to the x-axis and the values of x decrease. thus , the grraph of ex may be drawn as shown in the figure. its reflection in the line y=x gives of loge x.

|
Topper's Solved these Questions
- CONTINUITY AND DIFFERENTIABILITYBOOK - RS AGGARWALCHAPTER - CONTINUITY AND DIFFERENTIABILITYEXERCISE - Exercise 9A
27 Videos
- CONTINUITY AND DIFFERENTIABILITYBOOK - RS AGGARWALCHAPTER - CONTINUITY AND DIFFERENTIABILITYEXERCISE - Exercise 9B
11 Videos
- BINARY OPERATIONSBOOK - RS AGGARWALCHAPTER - BINARY OPERATIONSEXERCISE - Exercise 3B
8 Videos
- CROSS,OR VECTOR, PRODUCT OF VECTORSBOOK - RS AGGARWALCHAPTER - CROSS,OR VECTOR, PRODUCT OF VECTORSEXERCISE - Exercise 24
26 Videos
Similar Questions
Draw the graph of f(x)=sgn(logex).
View SolutionDraw the graph of y=loge(sinx).
View SolutionDraw the graph of y=x1logex.
View SolutionDraw the graph of f(x)=sgn(log0.5x).
View SolutionDraw the graph of y=ex+e−2x
View SolutionDraw the graph of f(x)=esinx.
View SolutionFor the following functions write the piecewise definition and draw the graph
(i) f(x)= sgn (logex) (ii) f(x)= sgn (sinx)
View SolutionDraw the graph of y=x/ln x
View SolutionDraw the graph of y=−logex.
View SolutionDraw the graph of y=(logex)2
View Solution
