The heights of 50 students , measured to the nearest centimetres, have been found to be as follows :
161150154165168161154162150151162164171165158154156172160170153159161170162165166168165164154152153156158162160161173166161159162167168159158153154159
(i) Represent the data given above by a grouped frequency distribution table, taking the class intervals as 160-165,165-170 ,etc. Solution in Kannada
Step by step video & image solution for The heights of 50 students , measured to the nearest centimetres, have been found to be as follows : {:(161,150,154,165,168,161,154,162,150,151),(162,164,171,165,158,154,156,172,160,170),(153,159,161,170,162,165,166,168,165,164),(154,152,153,156,158,162,160,161,173,166),(161,159,162,167,168,159,158,153,154,159):} (i) Represent the data given above by a grouped frequency distribution table, taking the class intervals as 160-165,165-170 ,etc. by Maths experts to help you in doubts & scoring excellent marks in Class 9 exams.
Updated on:21/07/2023Topper's Solved these Questions
- STATISTICSBOOK - CPC CAMBRIDGE PUBLICATIONCHAPTER - STATISTICSEXERCISE - EXERCISE 14.3
9 Videos
- STATISTICSBOOK - CPC CAMBRIDGE PUBLICATIONCHAPTER - STATISTICSEXERCISE - EXERCISE 14.4
6 Videos
- STATISTICSBOOK - CPC CAMBRIDGE PUBLICATIONCHAPTER - STATISTICSEXERCISE - EXERCISE 14.4
6 Videos
- QUADRILATERALSBOOK - CPC CAMBRIDGE PUBLICATIONCHAPTER - QUADRILATERALSEXERCISE - EXERCISE 7.2
7 Videos
- SURFACE AREAS AND VOLUMES BOOK - CPC CAMBRIDGE PUBLICATIONCHAPTER - SURFACE AREAS AND VOLUMES EXERCISE - EXERSICE 13.8
10 Videos
Similar Questions
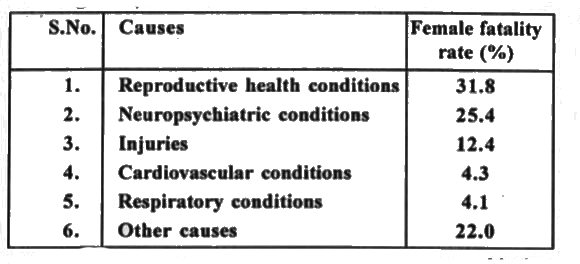
A survey conducted by an organisation for the cause of illness nad death among the women between the ages 15-44 (in years) worldwide, found the following figures (in %) :

(ii) Which condition is the major cause of women's ill health and death worldwide ?
View SolutionThe following number of goals was scored by a team in a series of 10 matches : 2,3,4,5,0,1,3,3,4,3
Find the mean, median and mode of these scores.
View SolutionThe following number of goals was scored by a team in a series of 10 matches : 2,3,4,5,0,1,3,3,4,3
Find the mean, median and mode of these scores.
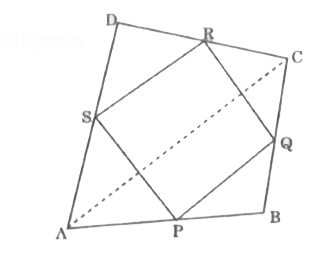
View SolutionABCD is a quadrilateral in which P,Q,R and S are mid points of the sides AB,BC,CD and DA. AC is a diagonal Show that:
SR∣∣ACandSR=12AC
PQ=SR
PQRS is a parallelogram

View SolutionFind the volume of a sphere whose radius is
(i) 7 cm,
(ii) 0.63m
View SolutionThe heights of 50 students, measured to the nearest centimetres, have been found to be as follows: 161,150,154,165,168,161,154,162,150,151,162,164,171,165,158,154,156,172,160,170,153,159,161,170,162,165,166,168,165,164,154,152,153,156,158,162,160,161,173,166,161,159,162,167,168,159,158,153,154,159,
(i) Represent the data given above by a grouped frequency distribution table, taking the class intervals as 160−165,165−170, etc.
(ii) What can you conclude about their heights from the table?
View SolutionThe heights (in cm) of 30 students of class VIII are given below: 155,158,154,158,160,148,149,150,153,159,161,148,157, 153,157,162,159,151,154,156,152,156,160,152,147,155,163,155, 157,153 Prepare a frequency distribution table with 160-164 as one of the class intervals.
View SolutionThe heights of 50 students, measured to the nearest centimetres have been found to be as follows:

(i) Represent the data given above by a grouped frequency distribution table, taking class intervals as 160-165, 165-170 etc.
(ii) What can you conclude about their heights from the table ?
View Solutionनिकटतम सेंटीमीटर में मापी गई 50 विद्यार्थियों की लंबाइयाँ ये है :
1611501541651681611541621501511621641711651581541561721601701531591611701621651661681651641154152153156158162160161173166161159162167168159158153154159
(i) 160 - 165, 165 - 170 आदि का वर्ग अंतराल लेकर ऊपर दिए गए आंकड़ों को एक वर्गीकृत बारम्बारता बंटन सारणी के रूप में निरूपित कीजिए ।
(ii) इस सारणी की सहायता से आप विद्यार्थियों की लम्बाइयों के संबंध के क्या निष्कर्ष निकल सकते है ?
View Solutionनिकटतम सेन्टीमीटरों में मापी गई 50 विद्यार्थियों की लंबाइयाँ निम्नांकित आँकड़े में दर्शाई गई है -
161161151150154158170153159172154162170160156168165161152162165153164165166158165171159161162154166173158162167154164153159161159154160168156162150168
160-165, 165-170 आदि तरह के वर्ग लेकर इन आंकड़ों की एक वर्गीकृत बारंबारता बंटन सारणी तैयार करें | बताएँ कि
165 सेमि से कम लंबाई के कितने छात्र हैं |
View Solutionनिकटतम सेन्टीमीटरों में मापी गई 50 विद्यार्थियों की लंबाइयाँ निम्नांकित आँकड़े में दर्शाई गई है -
161161151150154158170153159172154162170160156168165161152162165153164165166158165171159161162154166173158162167154164153159161159154160168156162150168
160-165, 165-170 आदि तरह के वर्ग लेकर इन आंकड़ों की एक वर्गीकृत बारंबारता बंटन सारणी तैयार करें | बताएँ कि
170 सेमी से अधिक लंबाई के कितने छात्र हैं |
View SolutionThe heights of 50 students , measured to the nearest centimetres, have been found to be as follows :
161150154165168161154162150151162164171165158154156172160170153159161170162165166168165164154152153156158162160161173166161159162167168159158153154159
(i) Represent the data given above by a grouped frequency distribution table, taking the class intervals as 160-165,165-170 ,etc.
View SolutionThe heights of 50 students, measured to the nearest centimetres, have been found to be as follows: 161 150 154 165 168 161 154 162 150 151162 164 171 165 158 154 156 172 160 170153 159 161 170 162 165 166 168 165 164154 152 153 156 158 162 160 161 173 166161 159 162 167 168 159 158 153 154 159 (i) Represent the data given above by a grouped frequency distribution table, taking the class intervals as 160 - 165, 165 - 170, etc.(ii) What can you conclude about their heights from the table?
View SolutionGiven below is a cumulative frequency distribution showing the mars secured by 50 students of a class

From the frequency distribution table for the data.
View SolutionThe heights (in cm) of 30 students of class VIII are given below:
155,158,154,158,160,148,149,150,153,159,161,148,157,153,157,162,159,151,154,156,152,156,160,152,147,155,163,155,157,153
Prepare a frequency distribution table with 160−164 as one of the class intervals.
View SolutionGiven below is the frequency distribution of the heights of 50 students of a class: Class Interval:, 140-145, 145-150, 150-155, 155-160, 160-165 Frequency:, 8, 12, 18, 10, 5 Draw a histogram representing the above data.
View Solution
