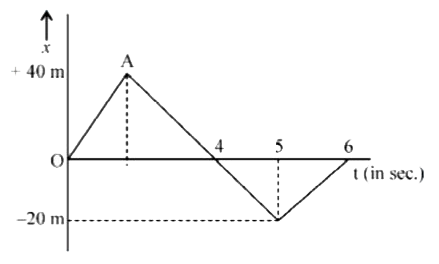
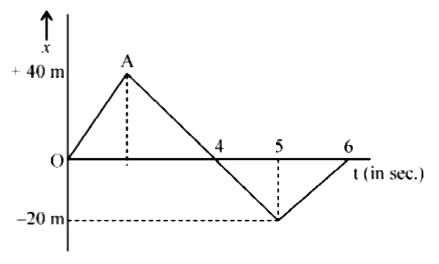
s-t graph of a particle in motion is shown in Fig. Calculate
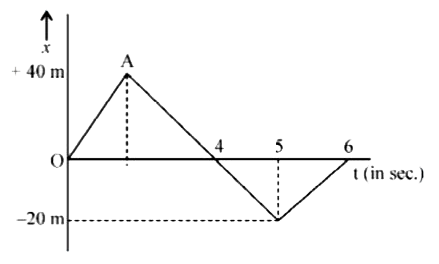
Average speed
20 mfs
Similar Questions
Knowledge Check
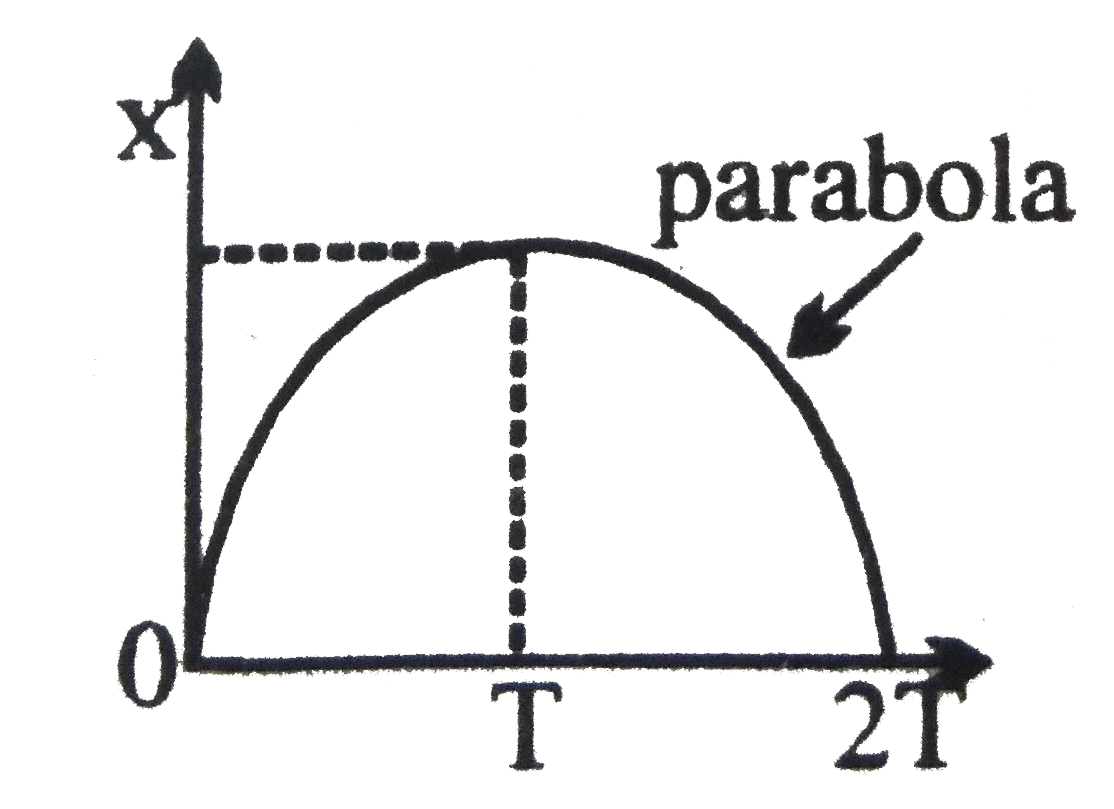
The x-t graph of a particle moving along a straight line is shown in figure
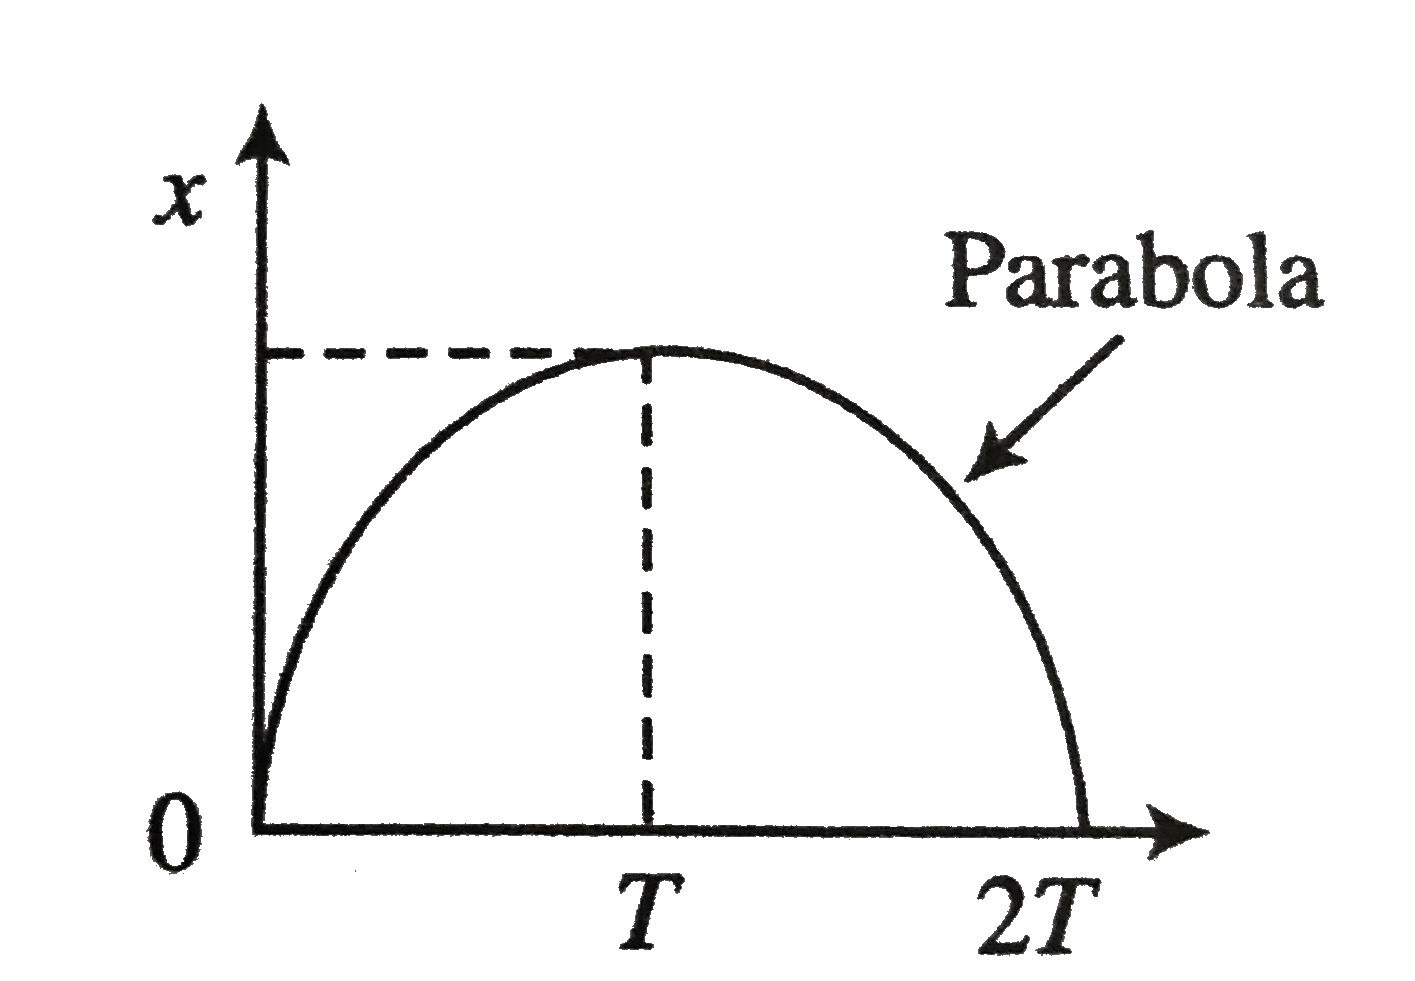
The speed-time graph of the particle is correctly shown byA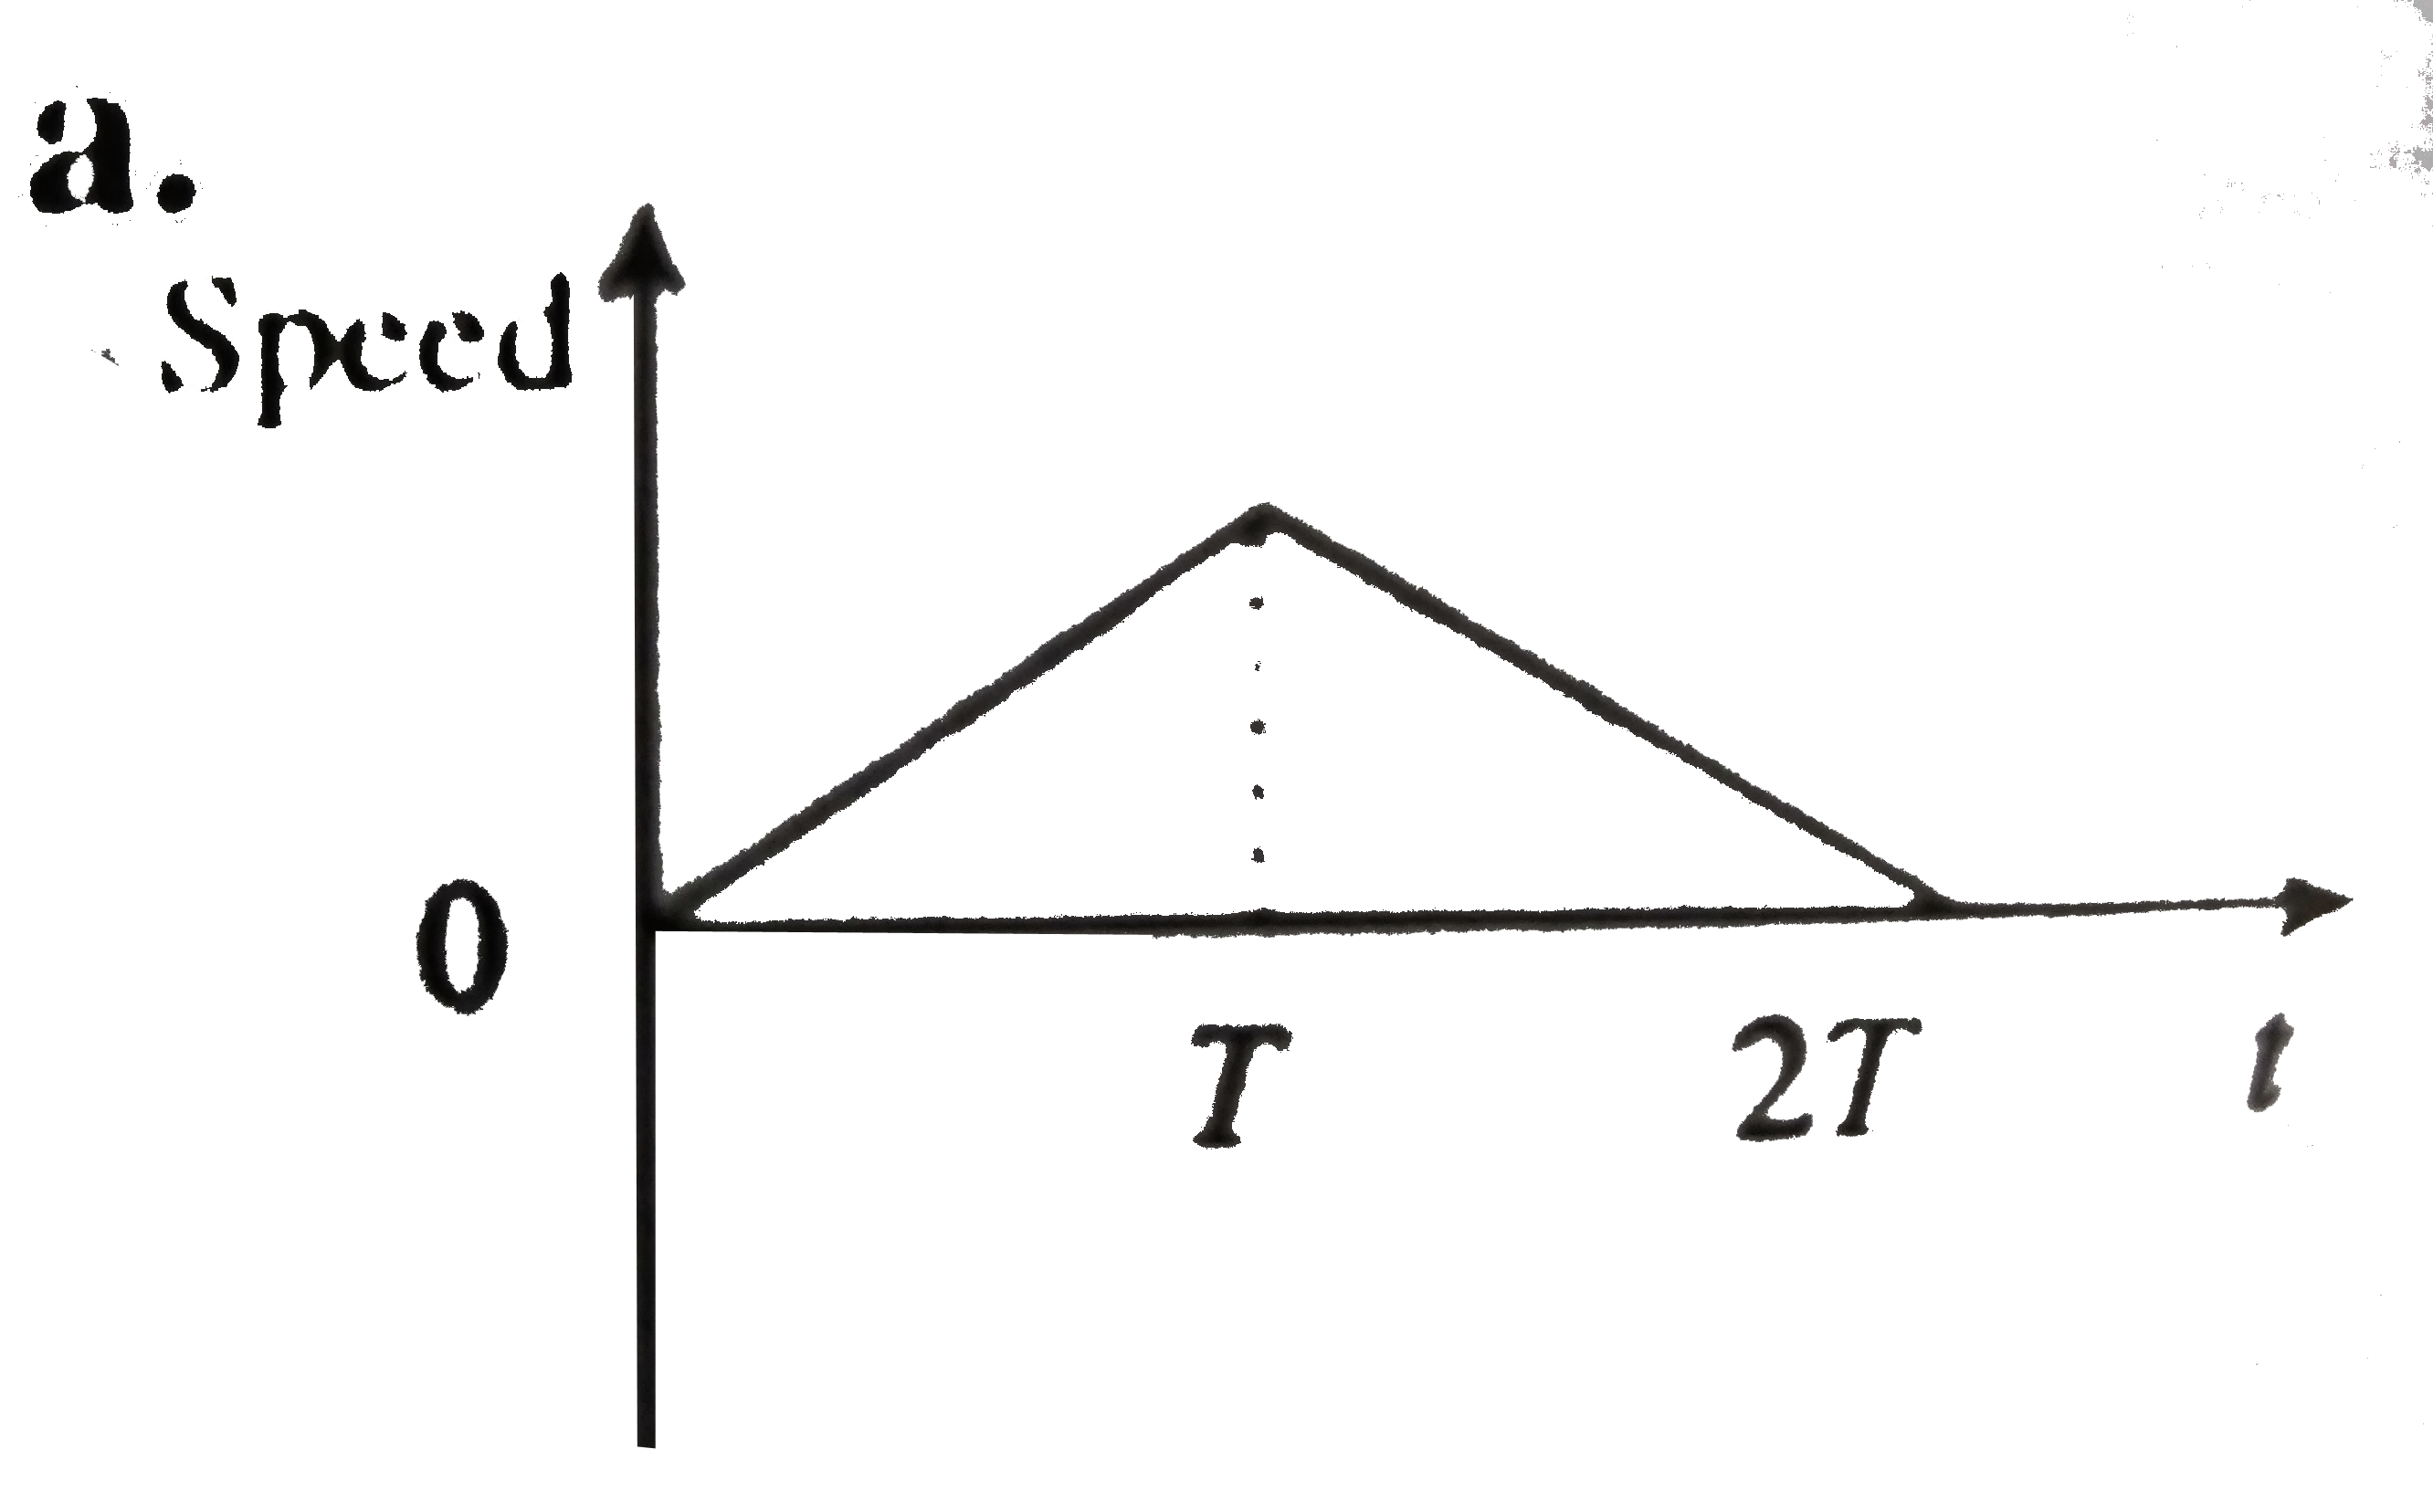 B
B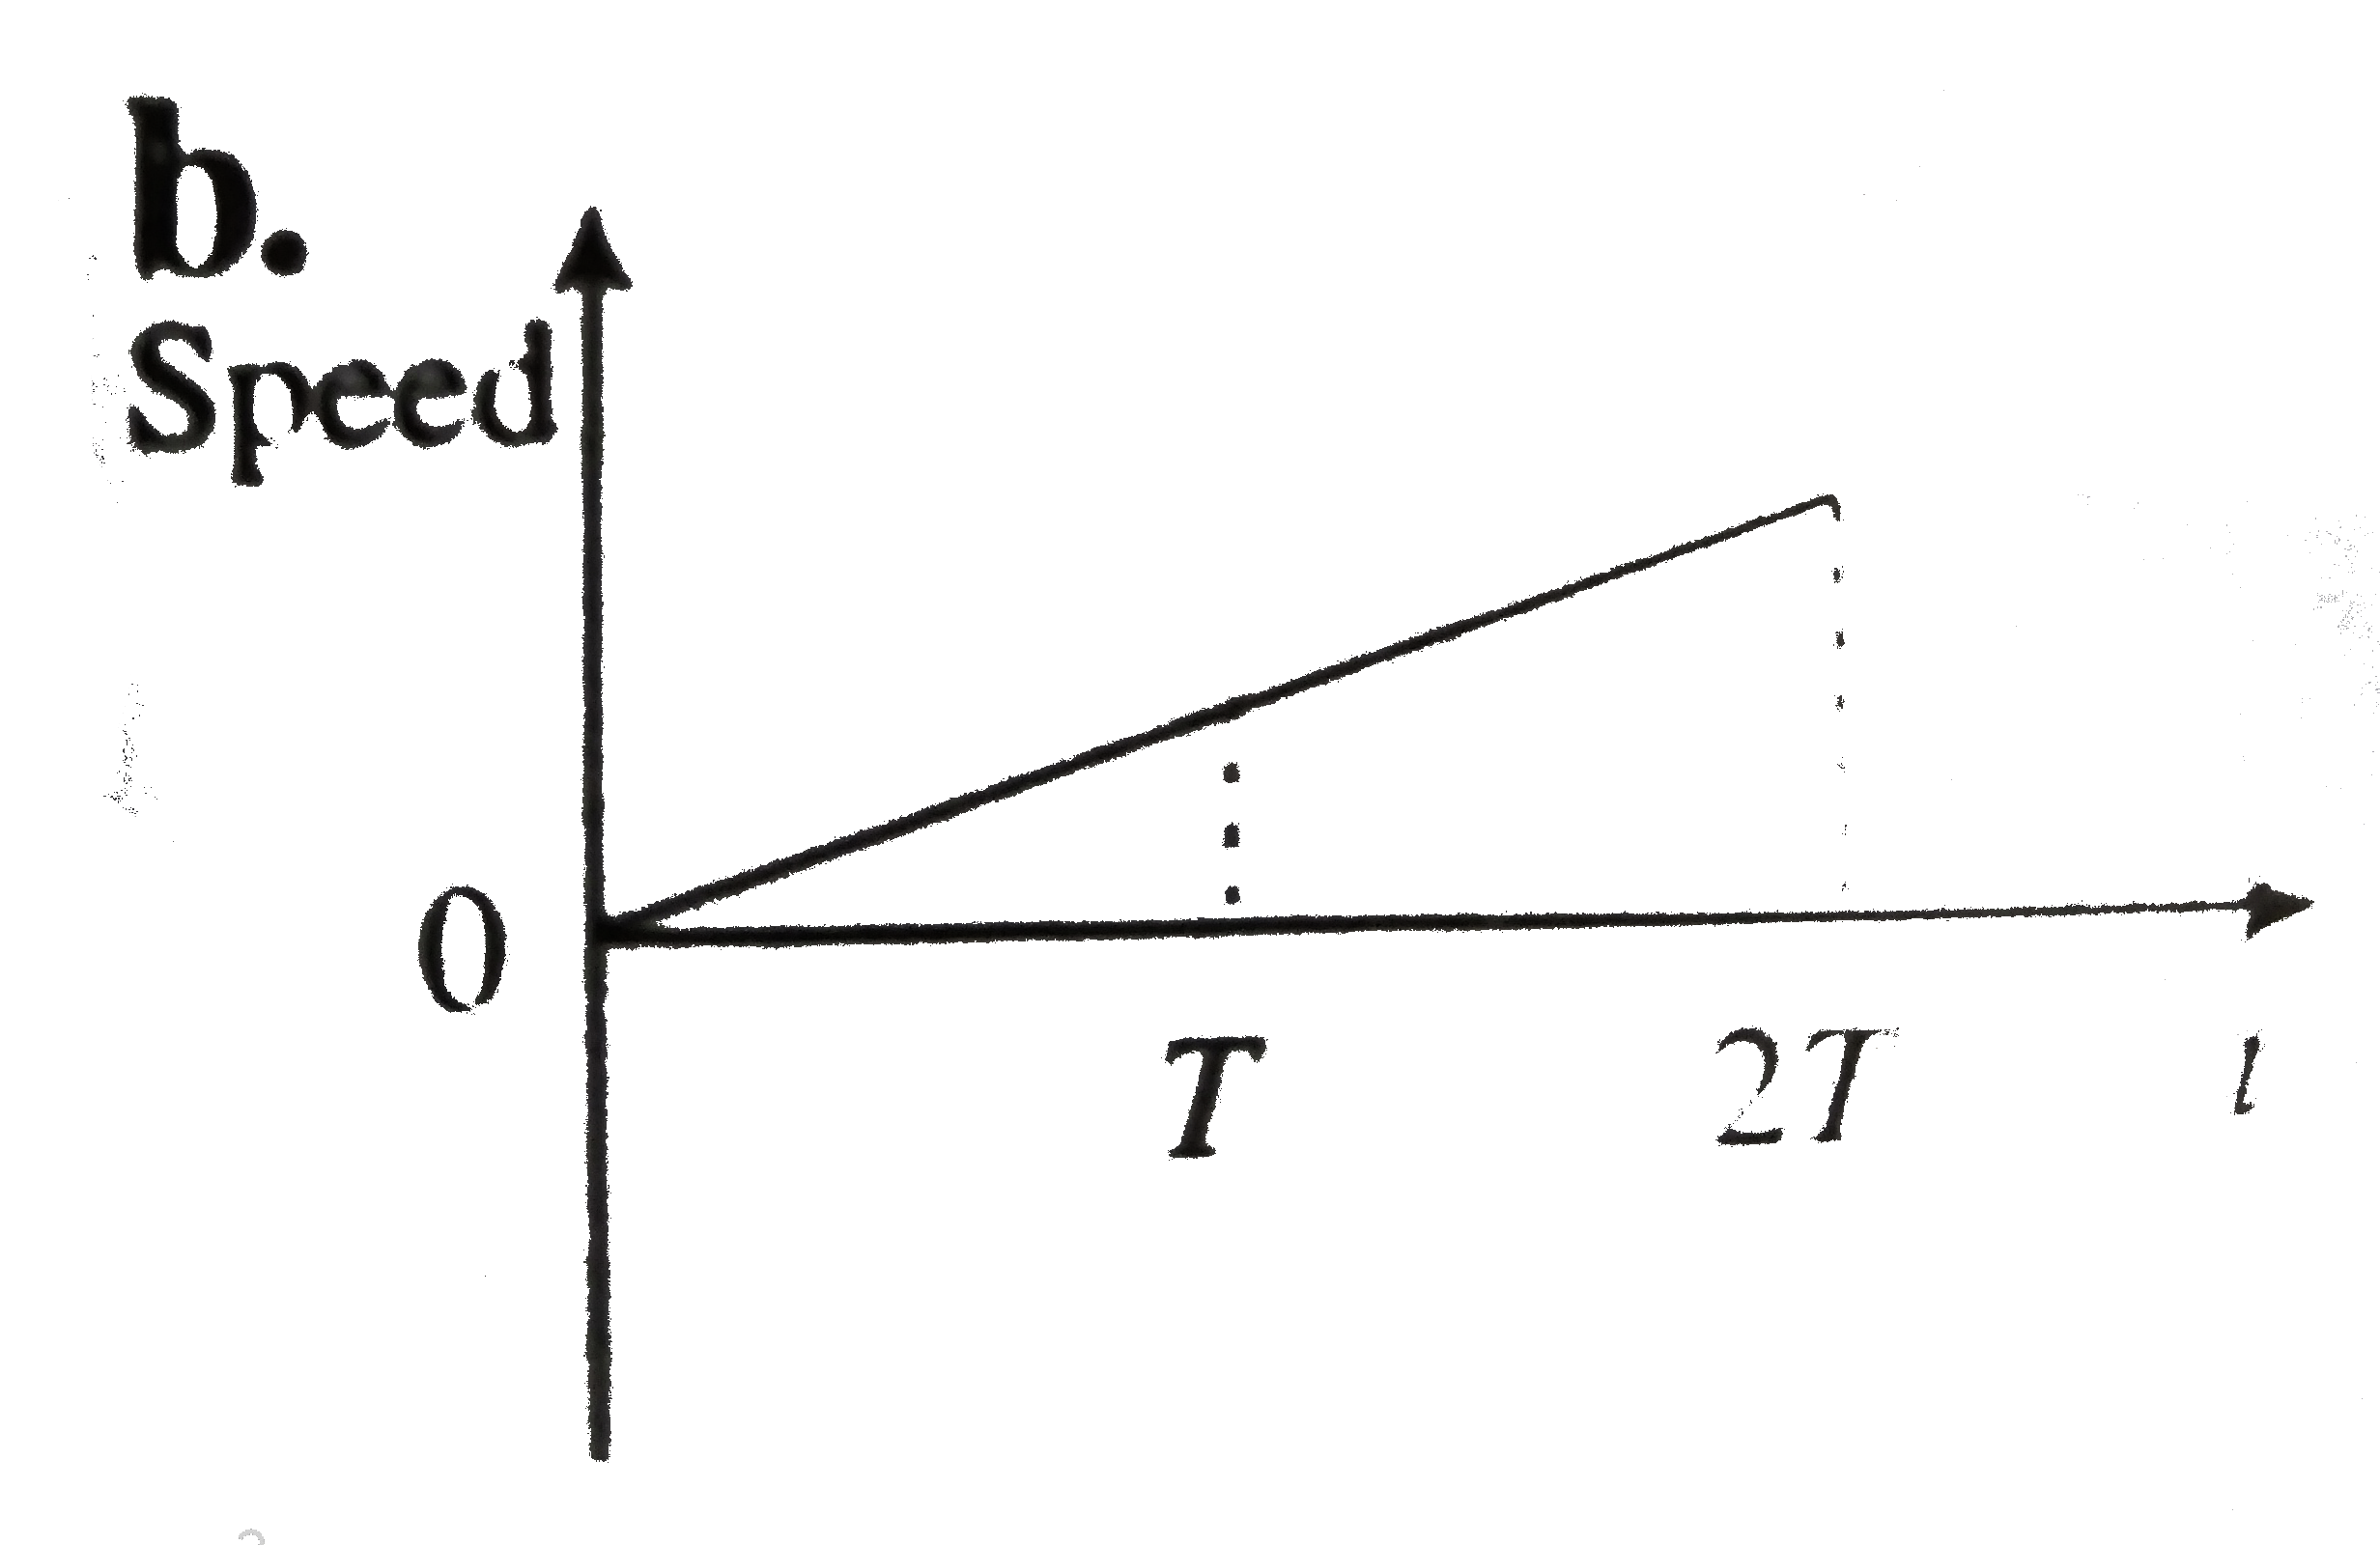 C
C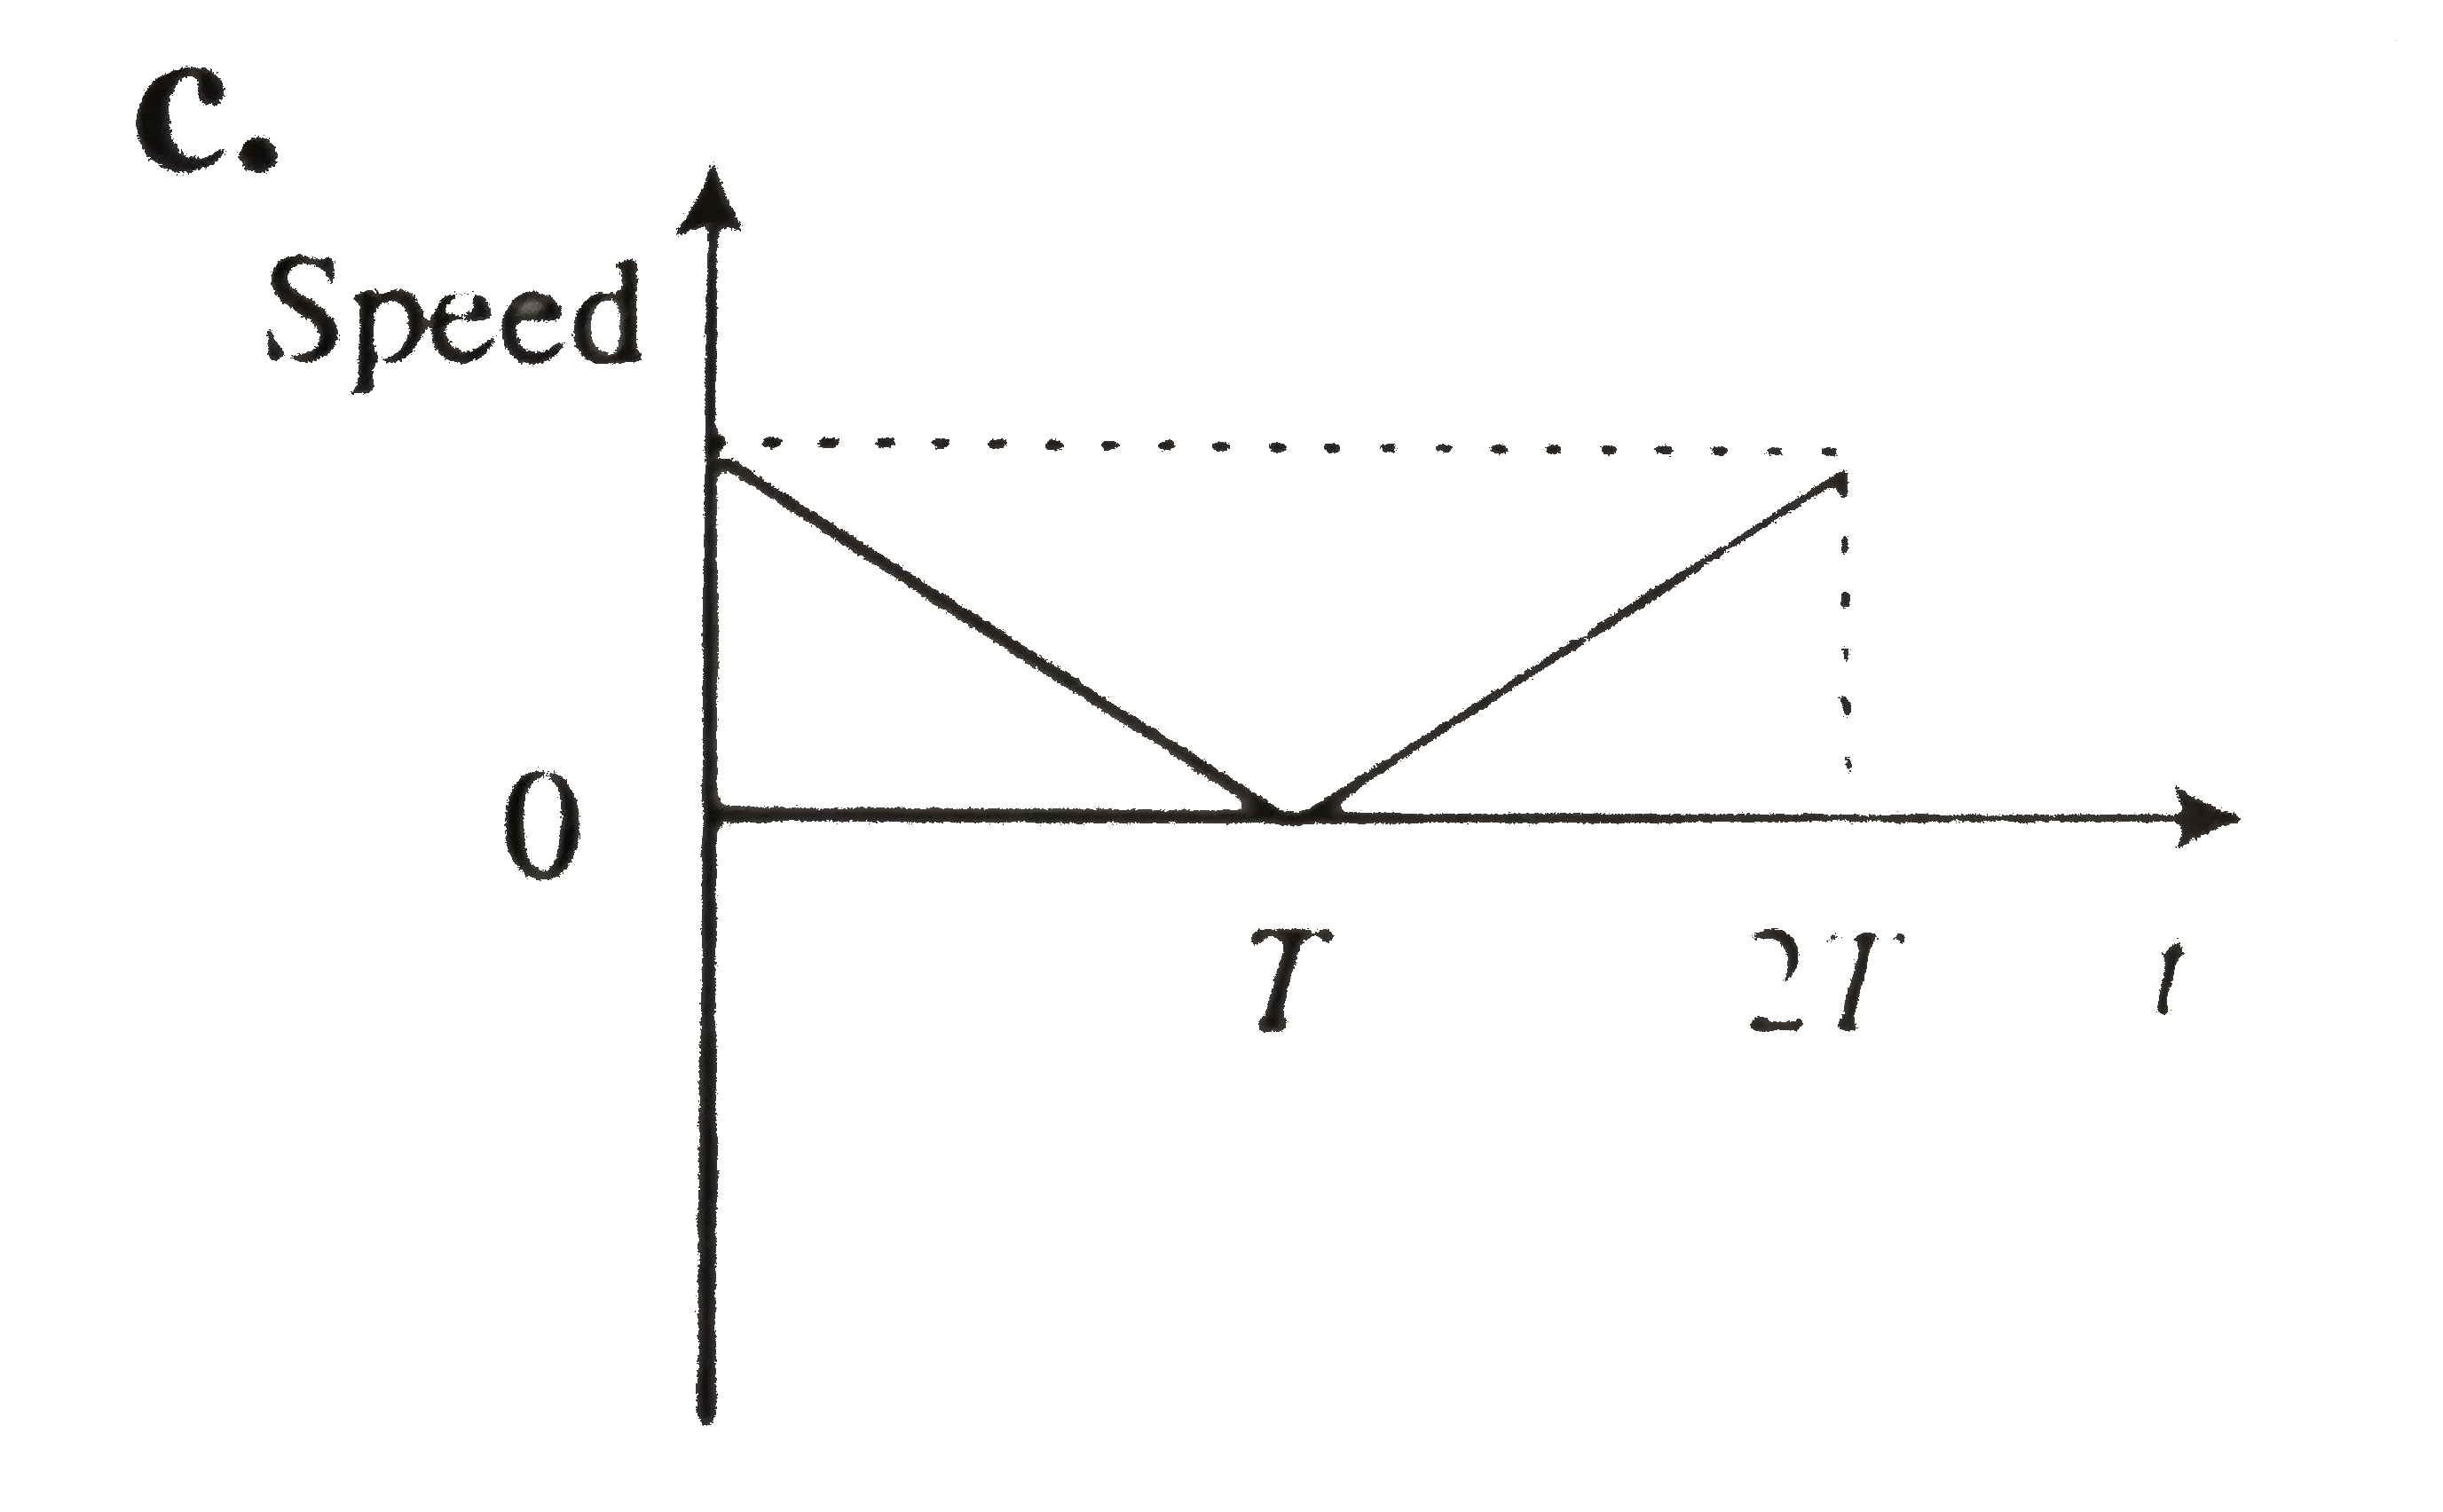 D
D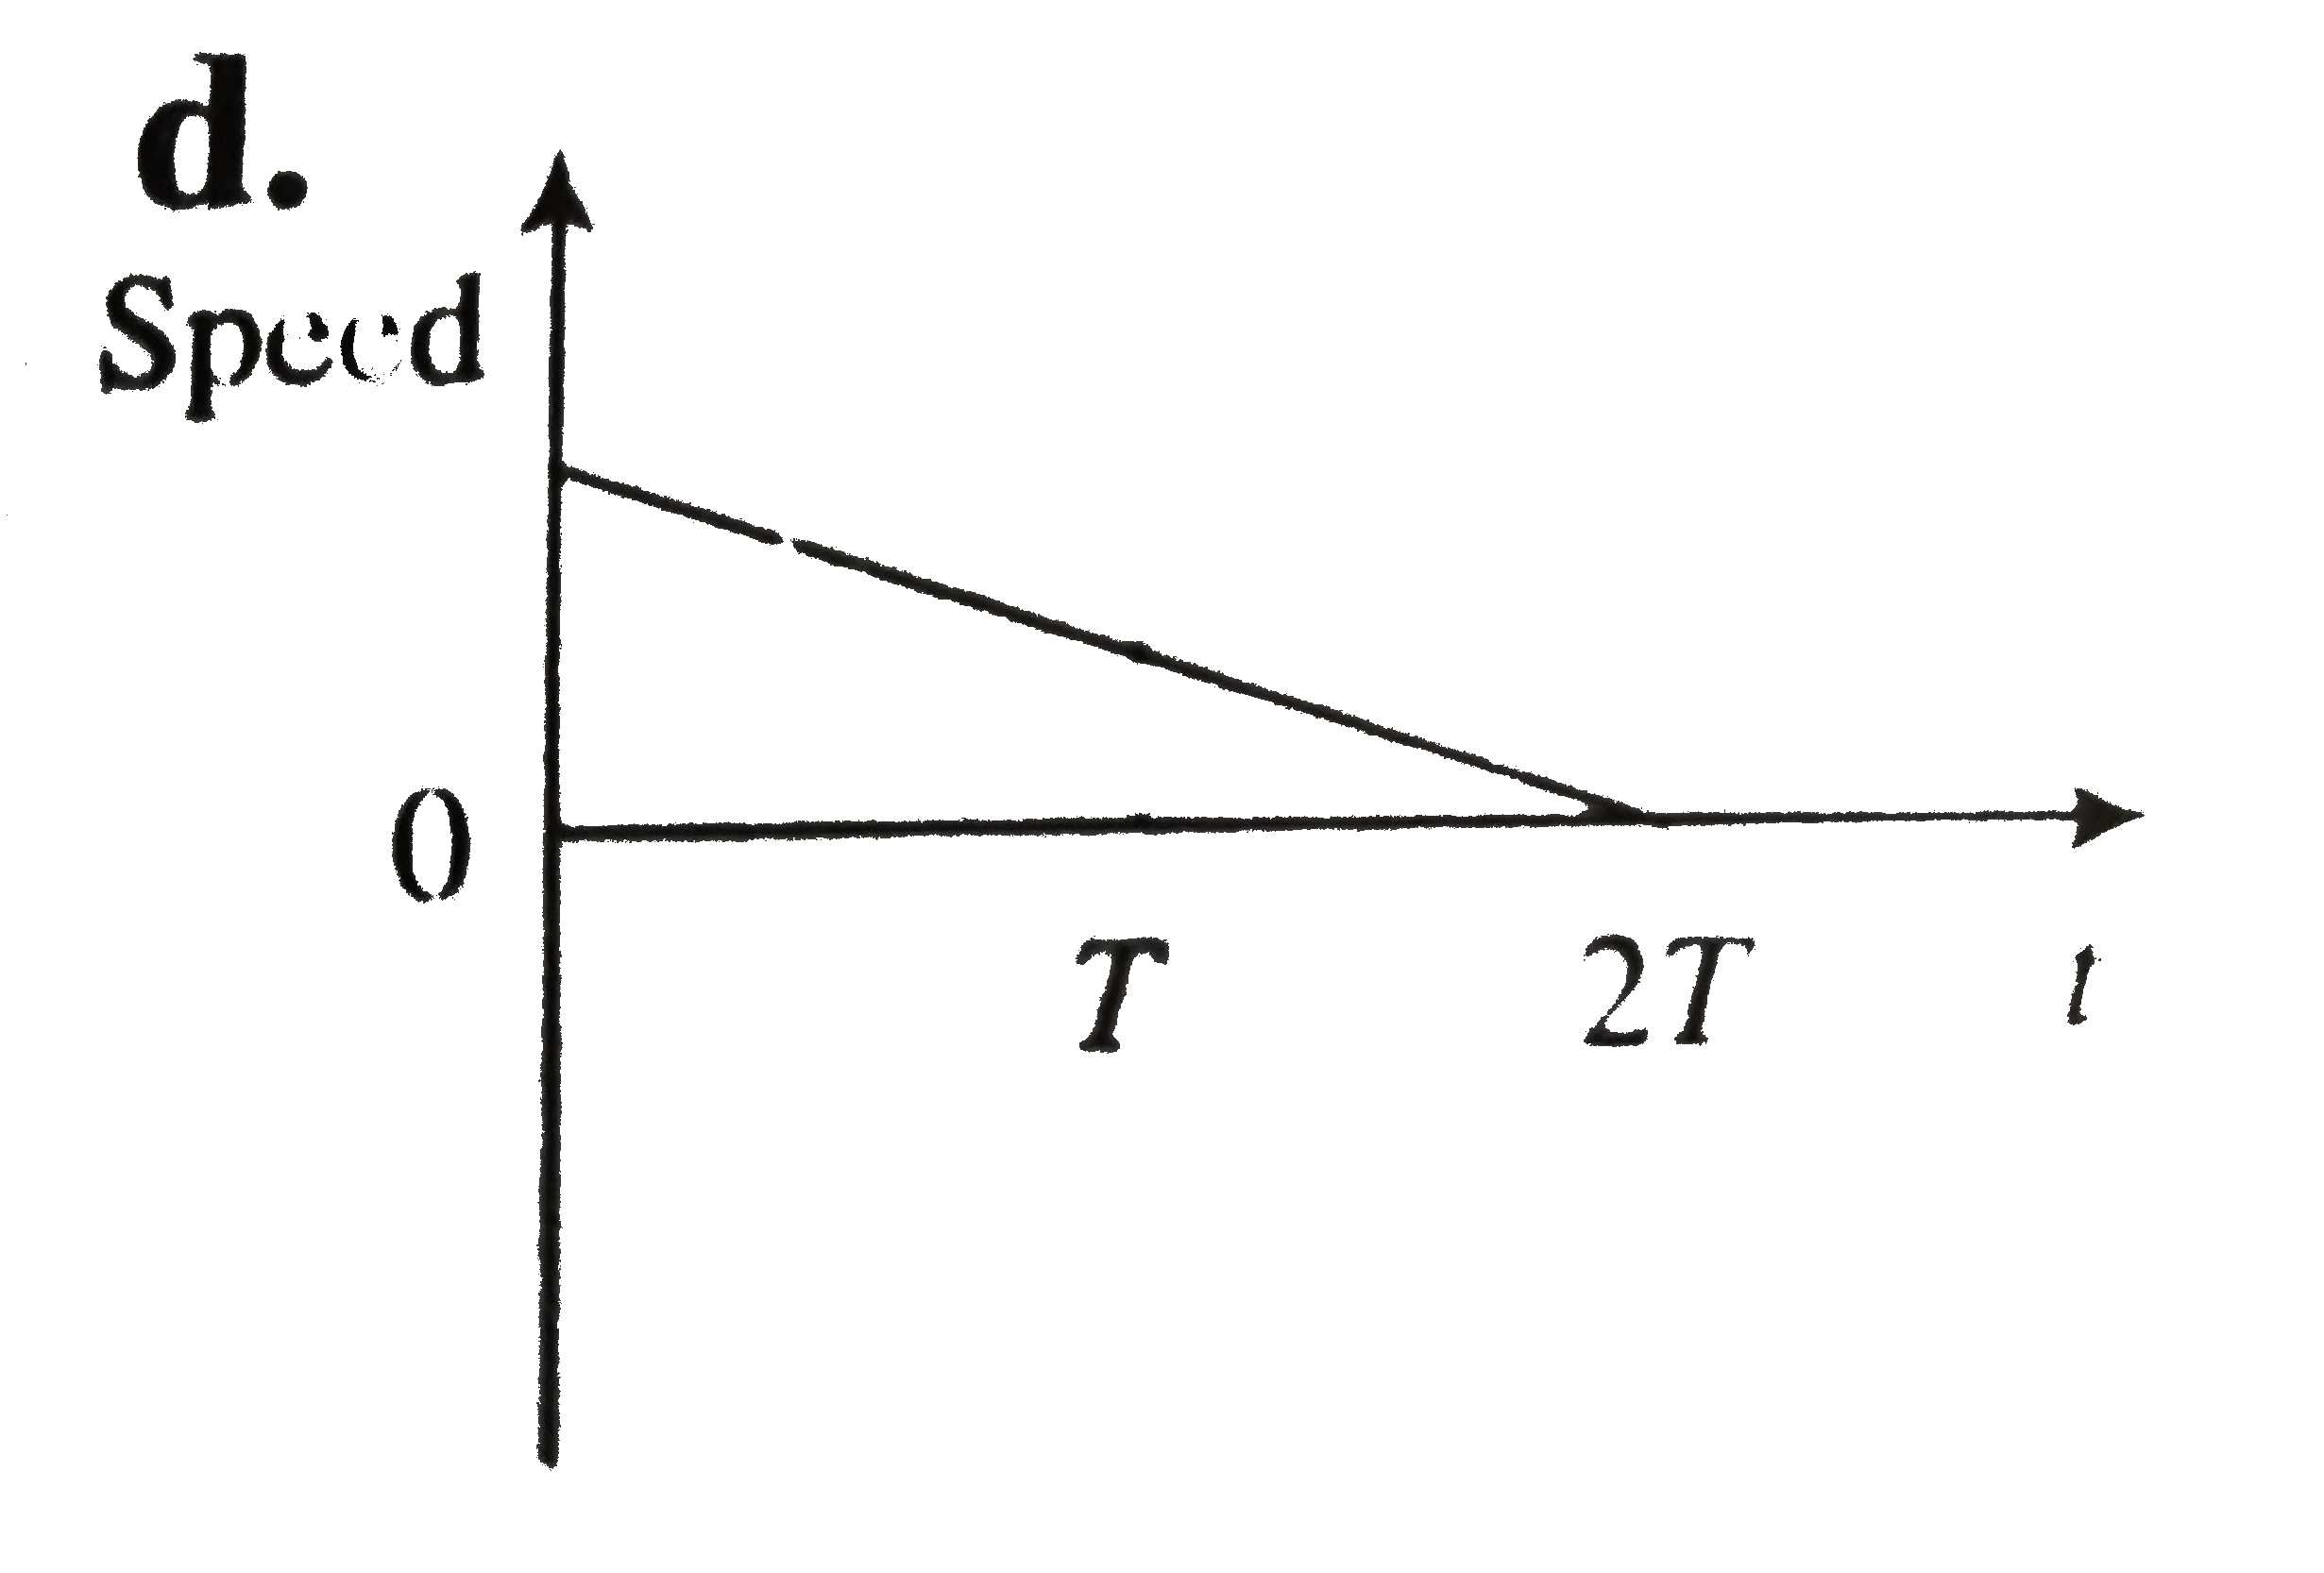
The x−t graph of particle moving along a straight line is shown in figure
The speed-time graph of the particle si correctly shown byA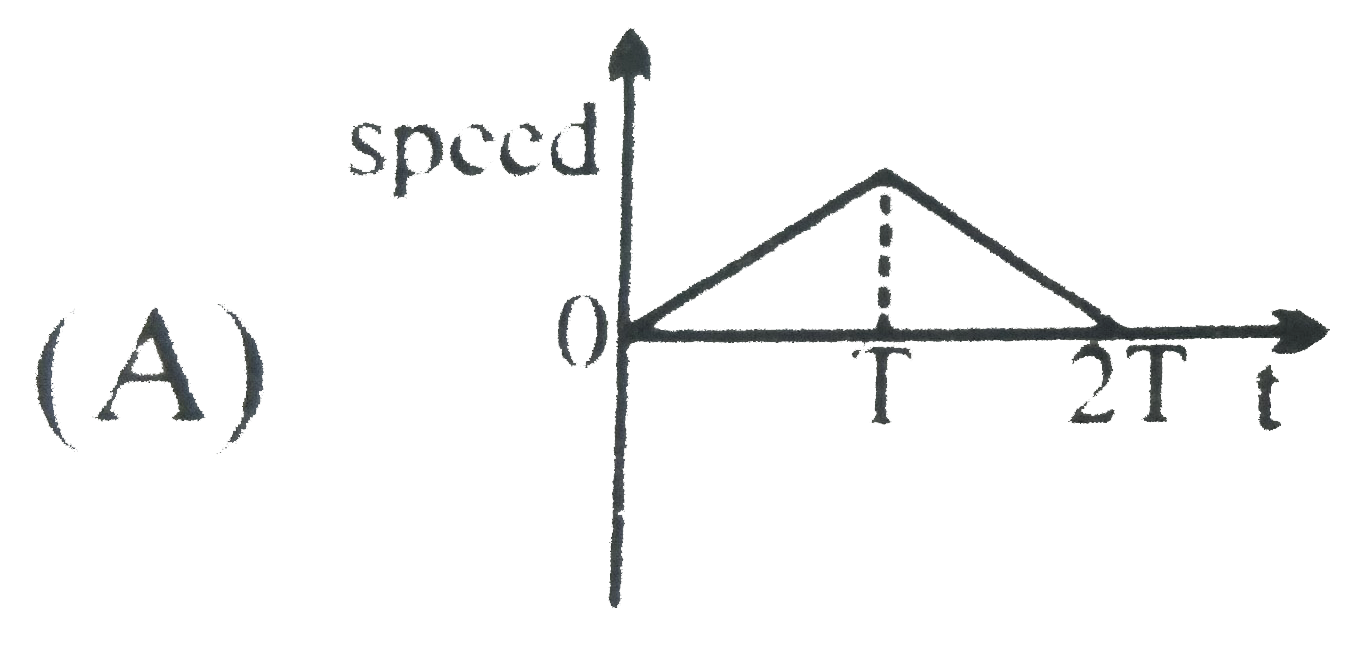 B
B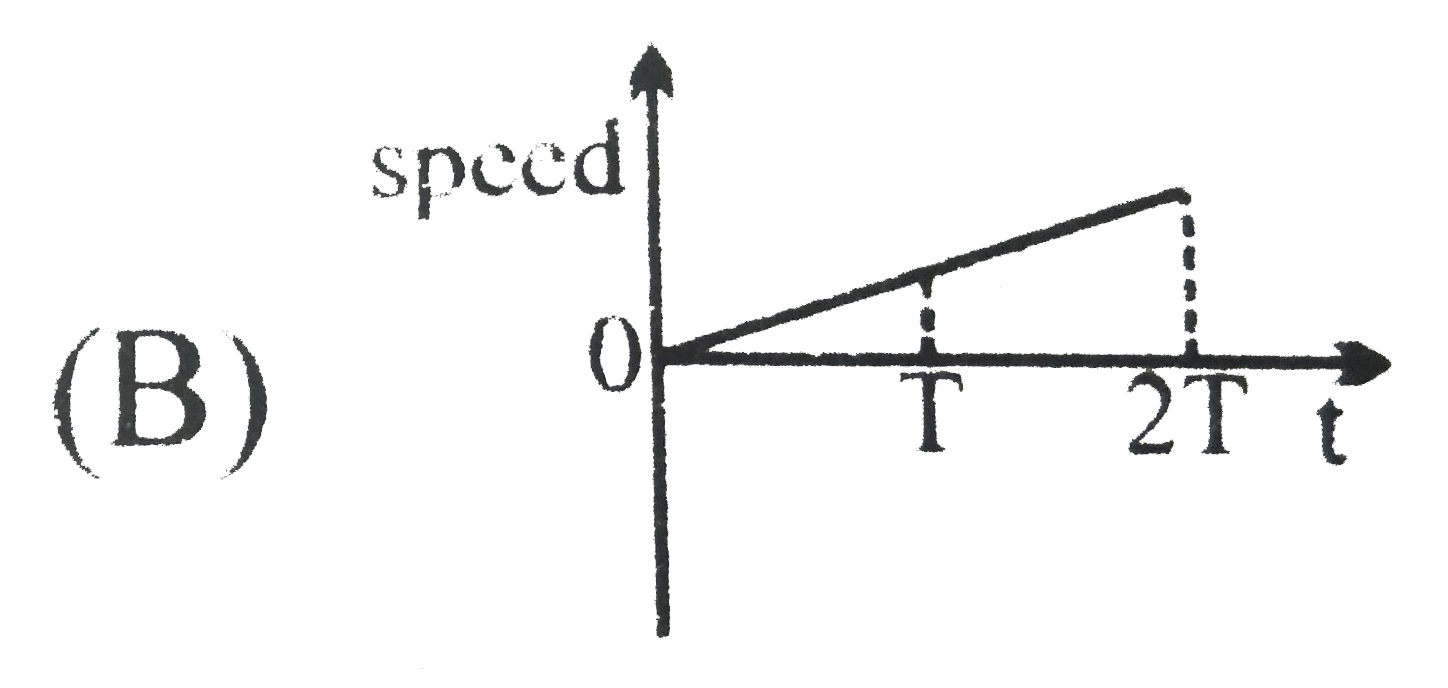 C
C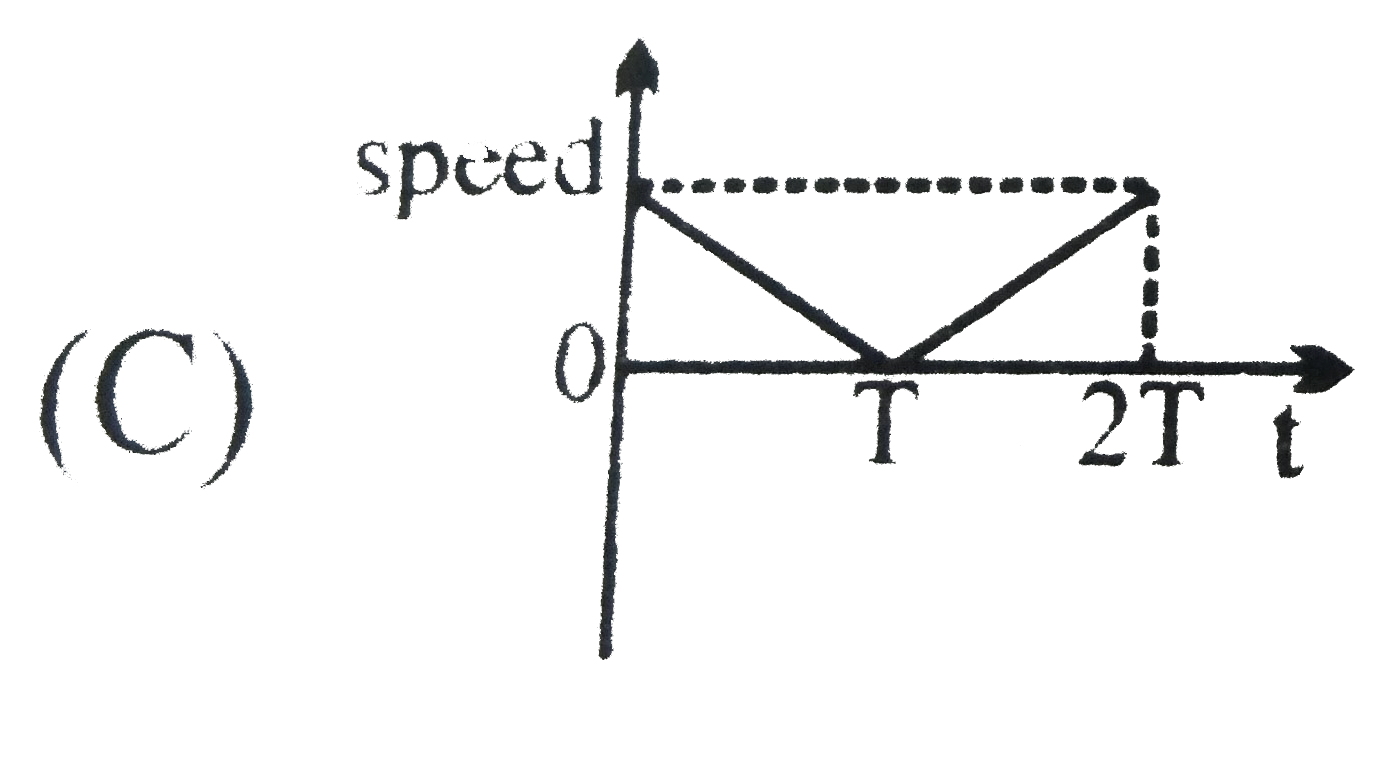 D
D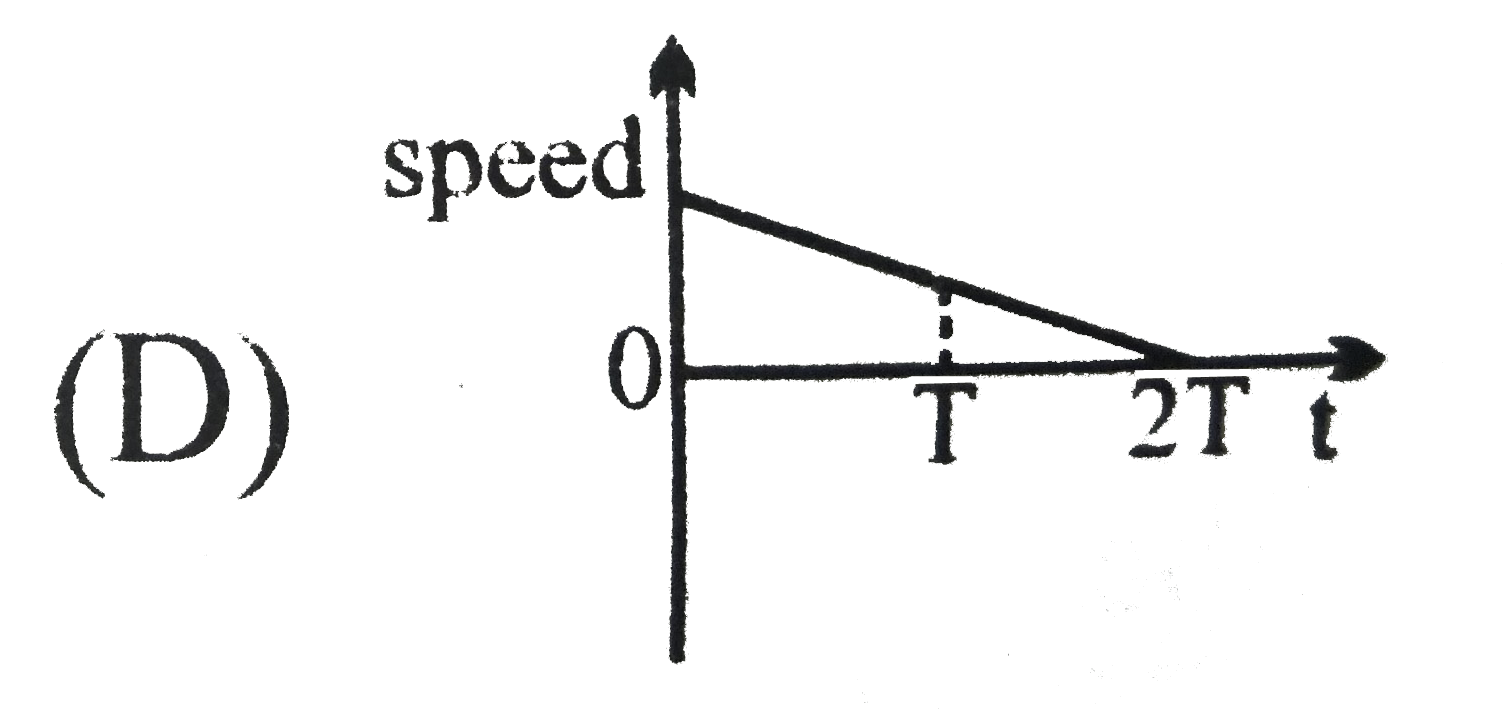
Velocity time graph for the motion of a particle along a straight line is as shown in figure.
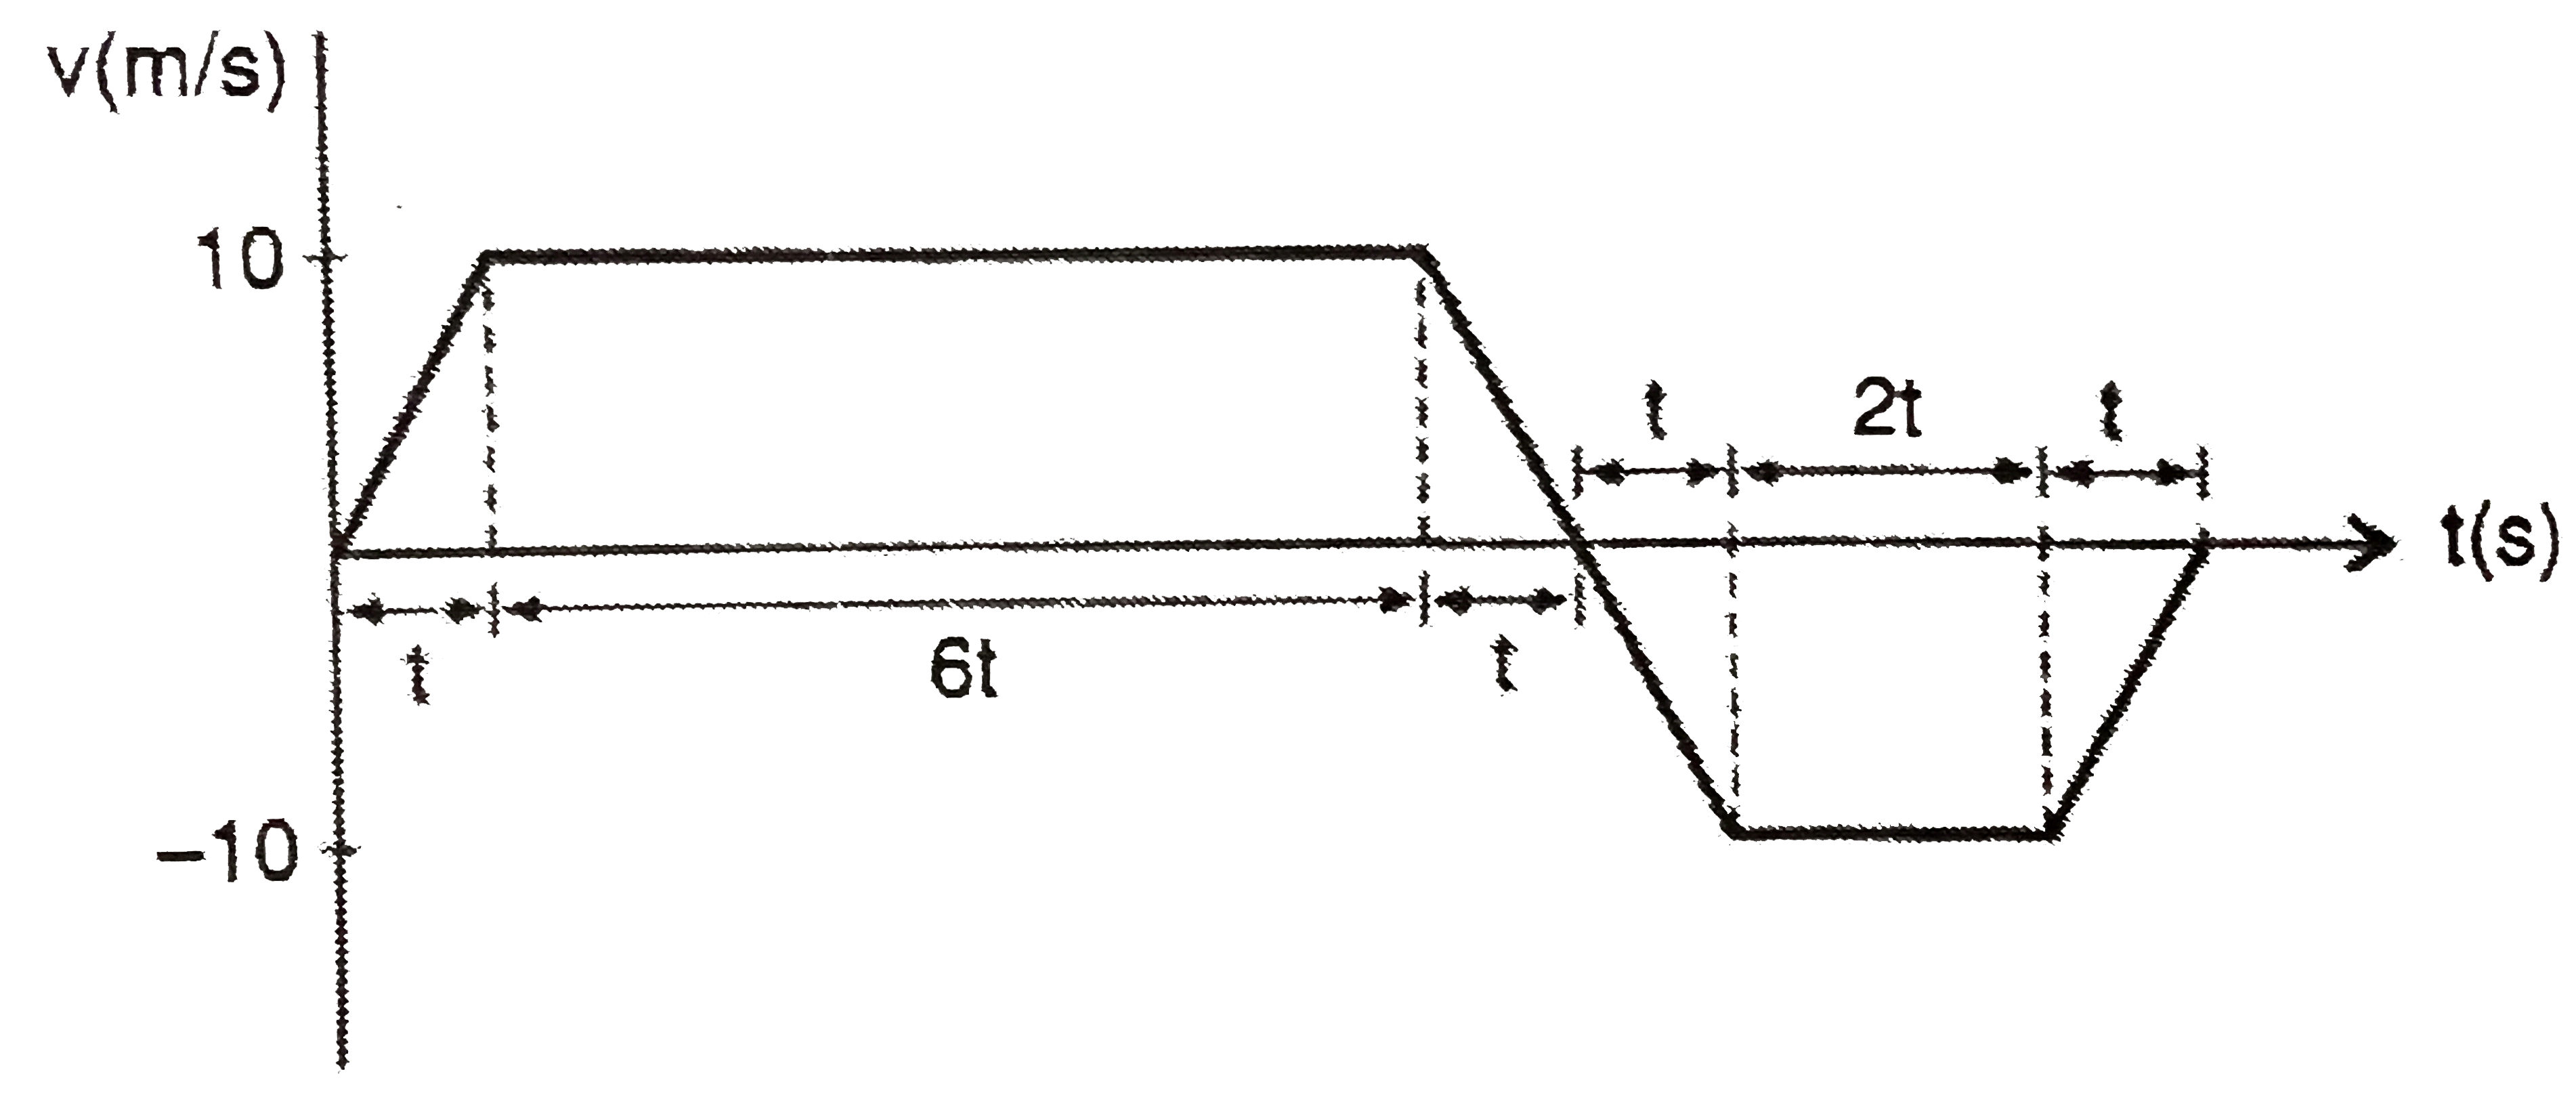
Average speed of the particle for the whole motion is:A9.6 m/sB7.2 m/sC8.3 m/sD6.5 m/s
s-t graph of a particle in motion is shown in Fig. Calculate
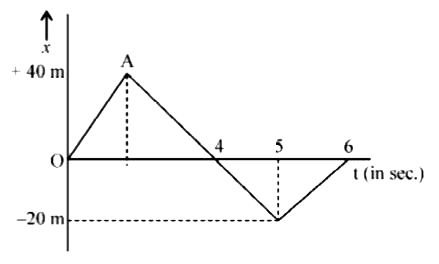
Displacement
View SolutionPosition-time graph of a particle in motion is shown in fig. Calculate -
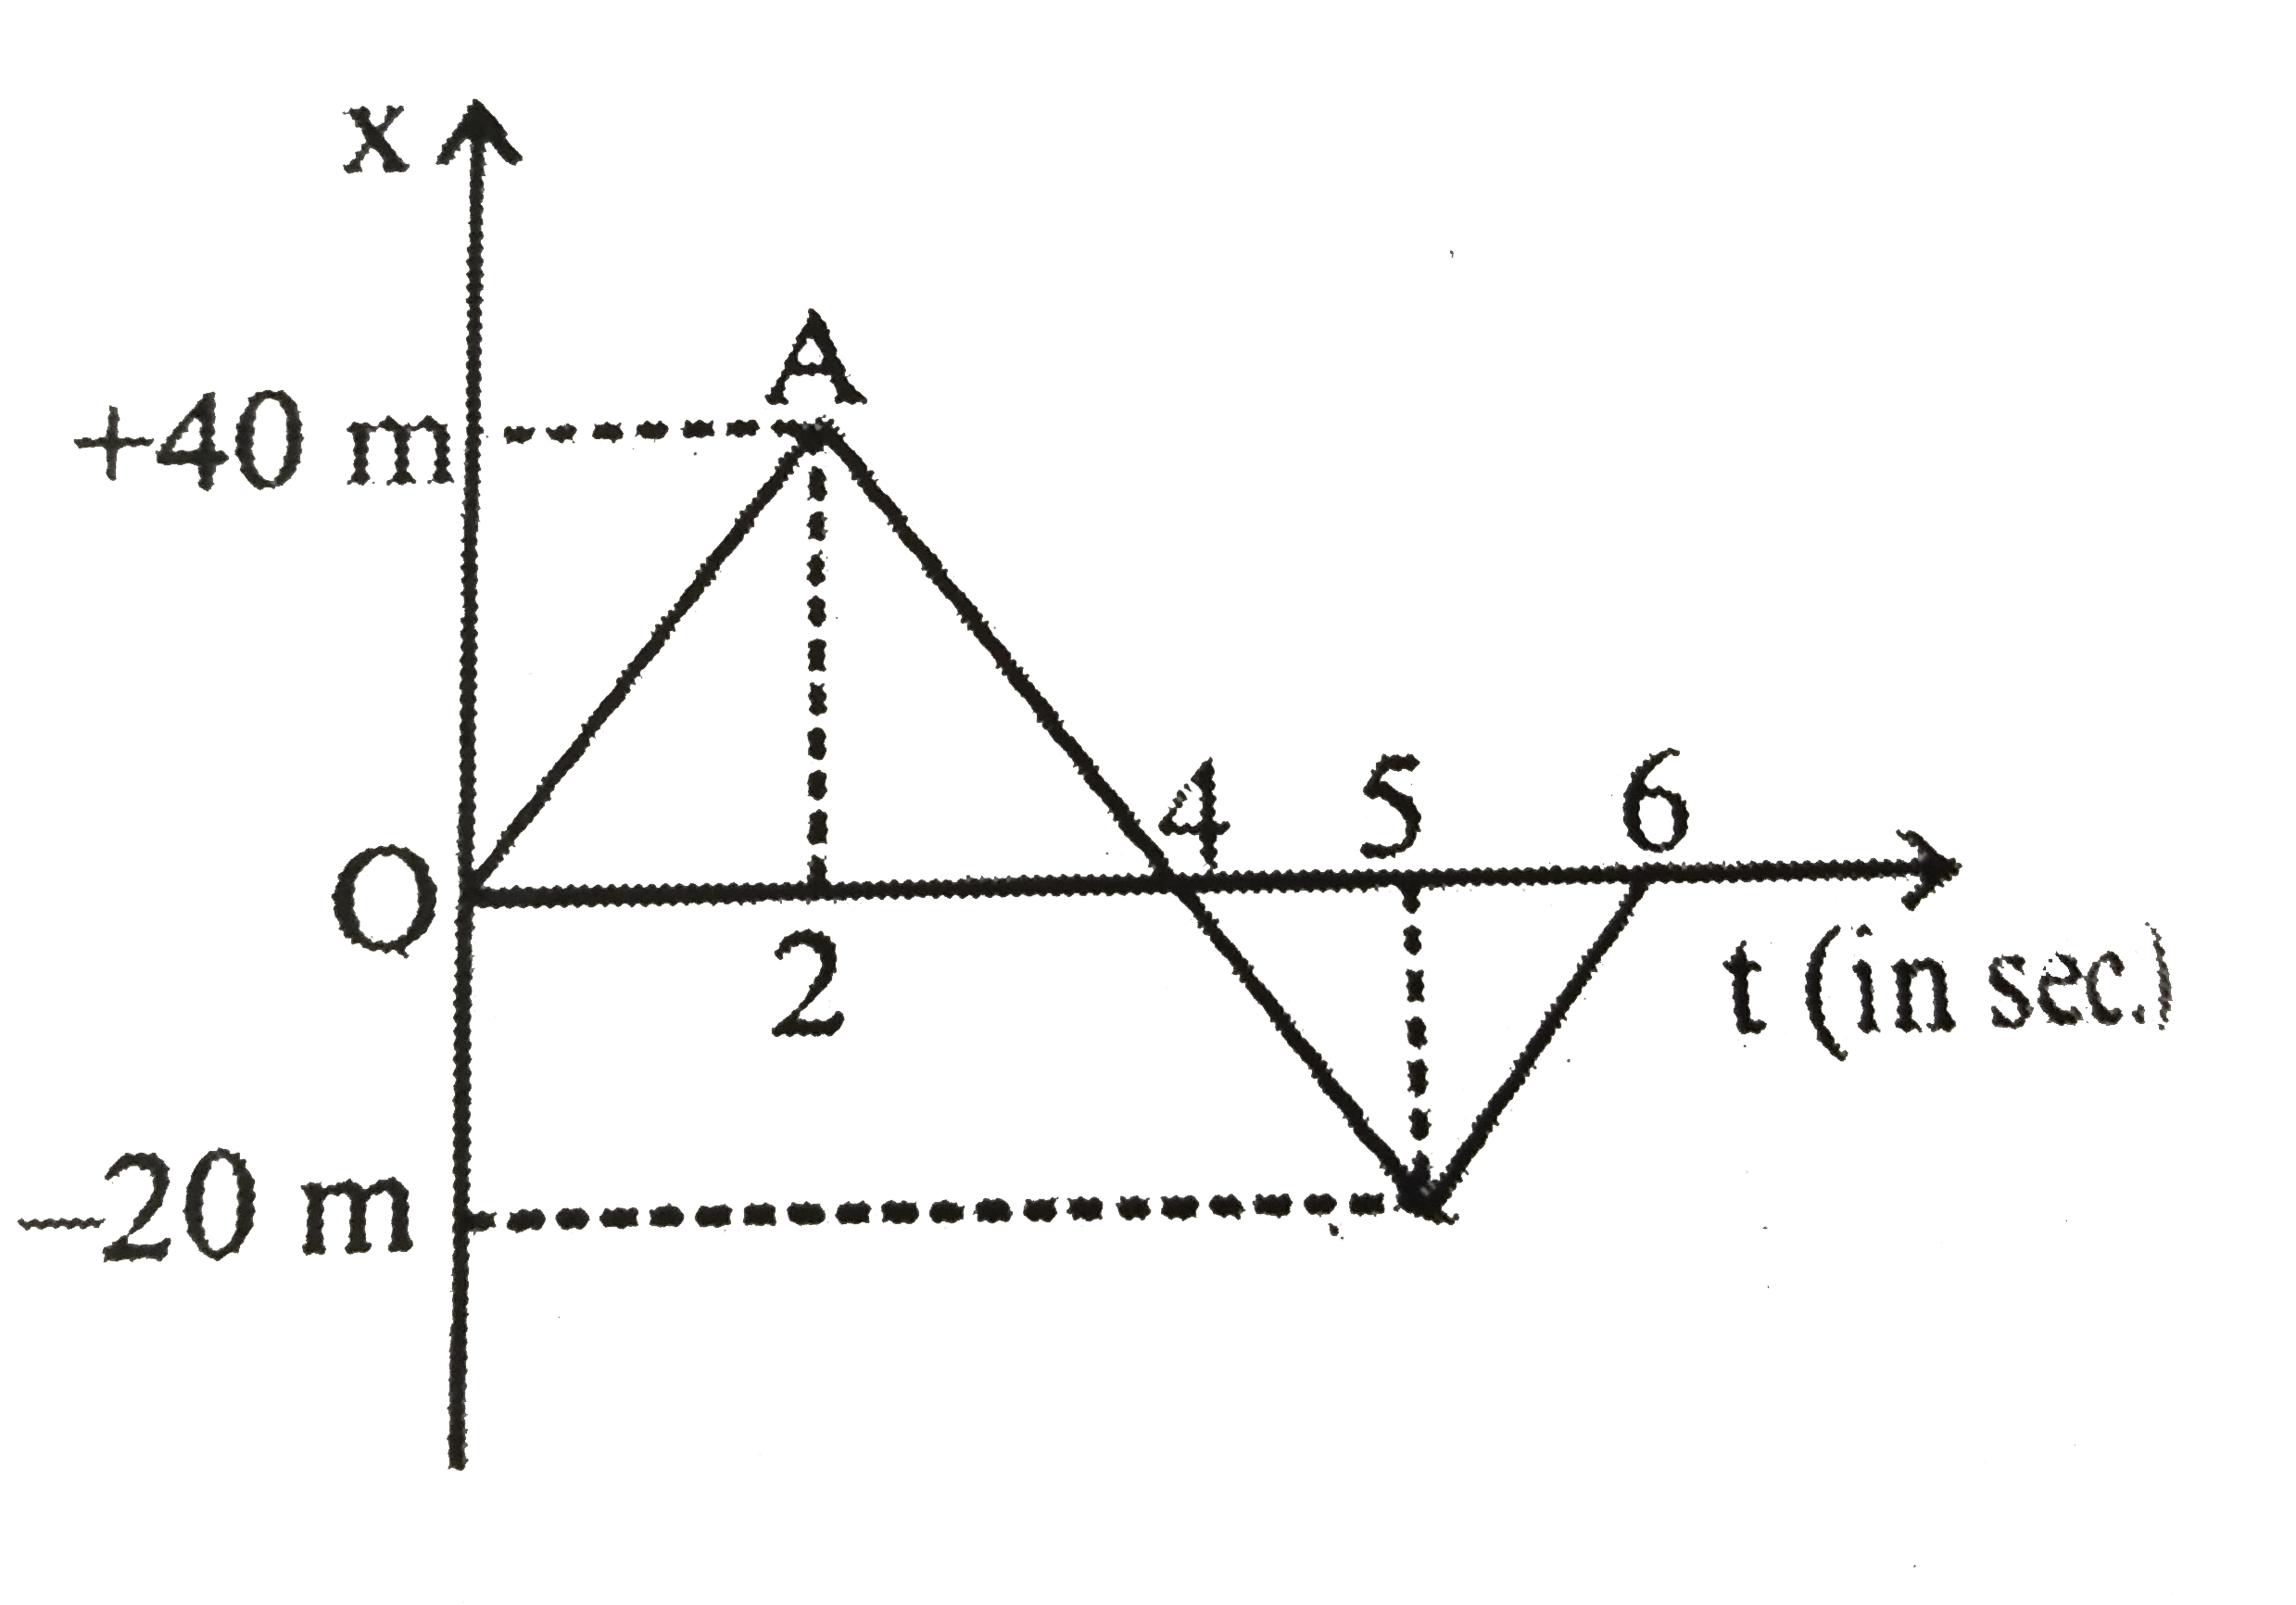
(i) Total distance covered
(ii) Displacement
(iii) Average speed
(iv) Average velocity.
View Solutions-t graph of a particle in motion is as shown below.

(a) State, whether the given graph represents a uniform motion or not.
(b) Find velocity of the particle.
View SolutionThe velocity-time graph of a particle in straight line motion is veloity-time graph of a particle in straight line motion is shown in. The particle starts its motion from origin.
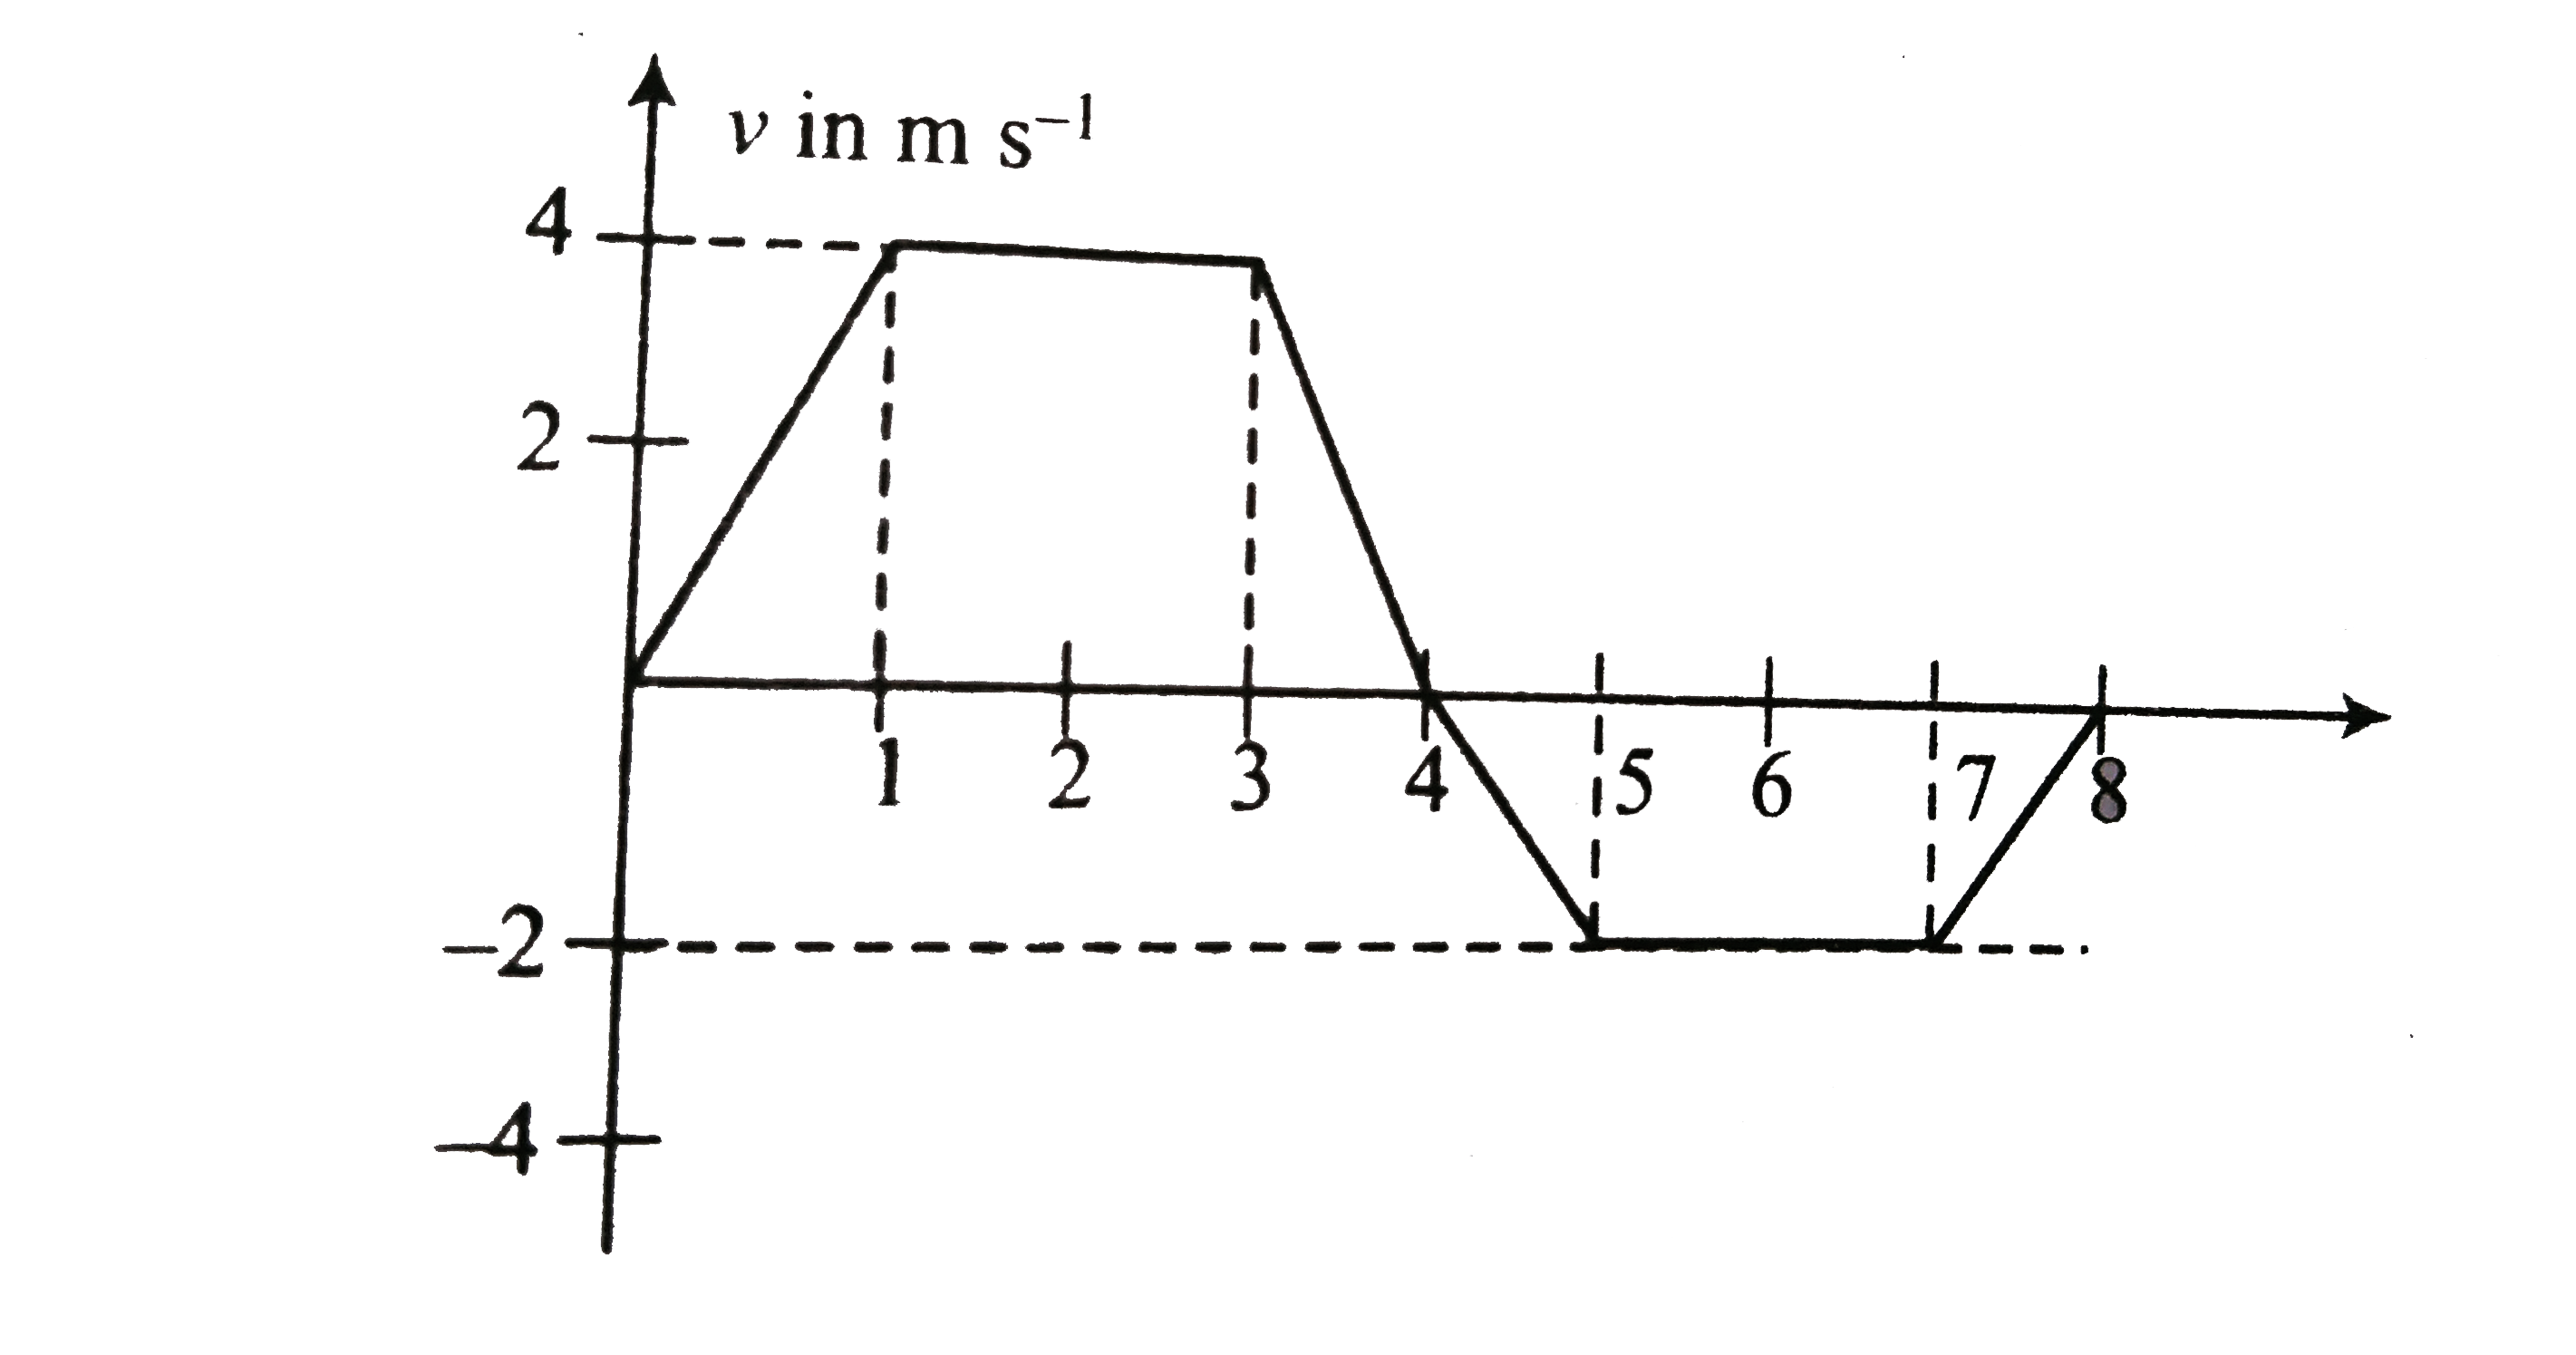 .
.
Find the average acceleration from 2s to 6s.
View SolutionThe velocity-time graph of a particle in straight line motion is veloity-time graph of a particle in straight line motion is shown in. The particle starts its motion from origin.
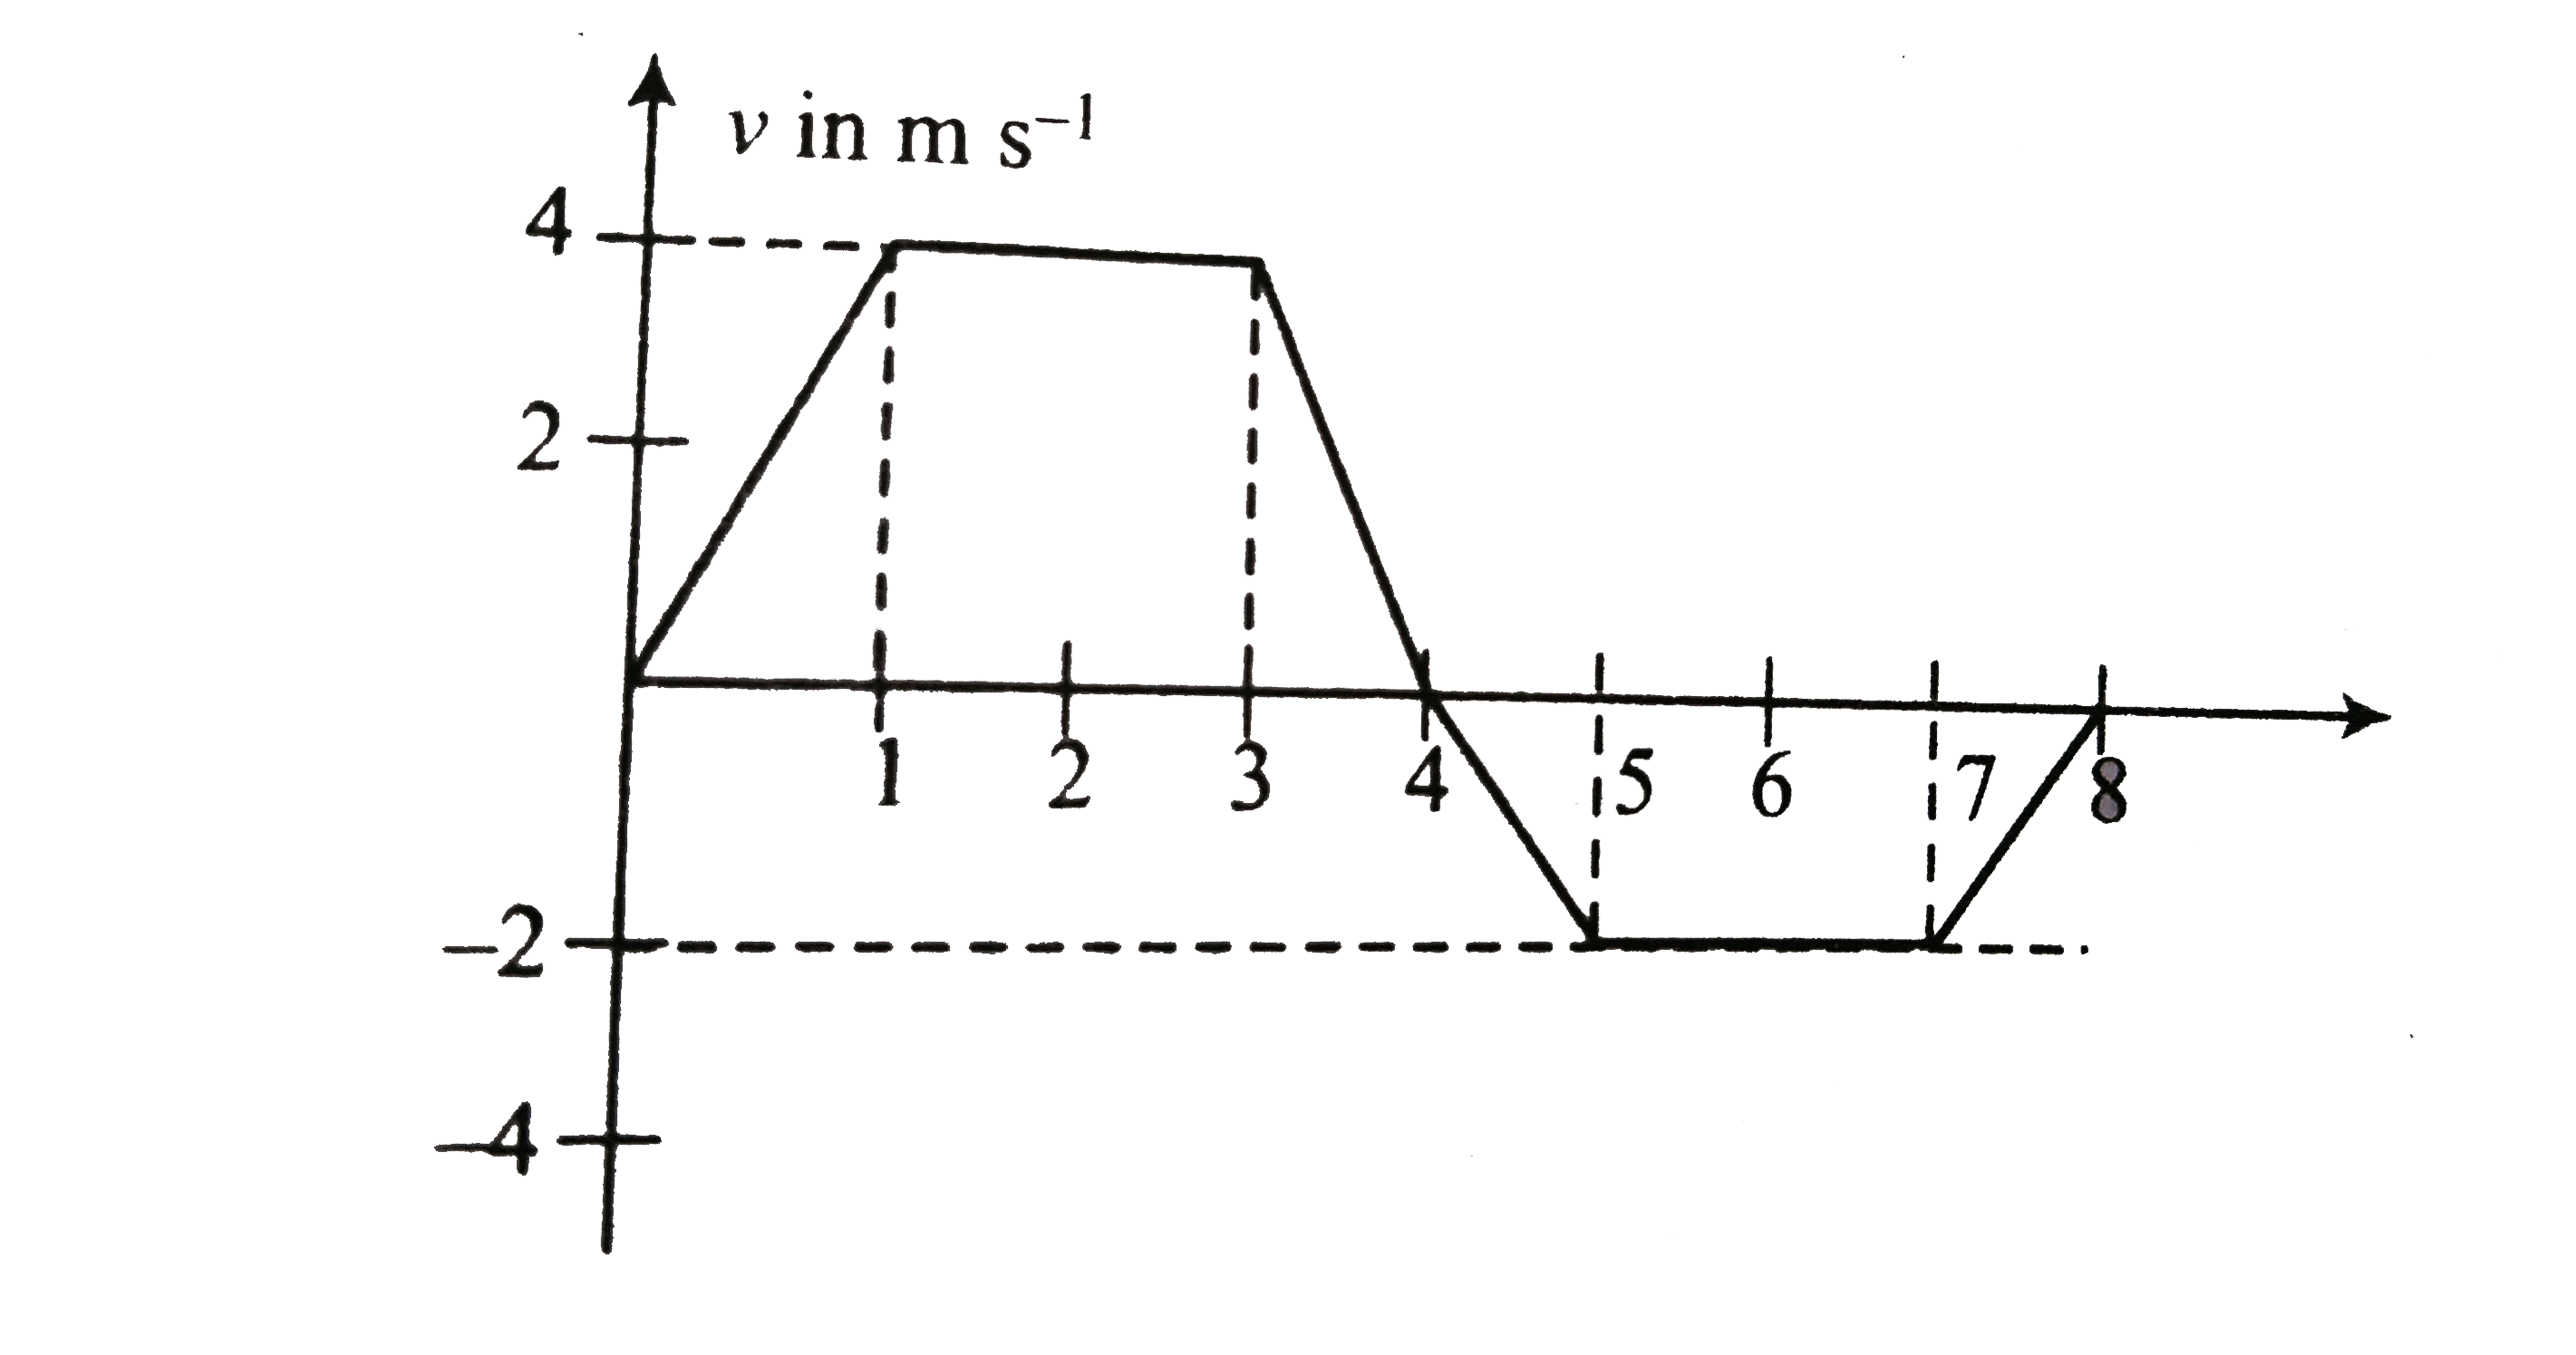 .
.
The distance of the particle from the origin after 8s is .
View Solution

