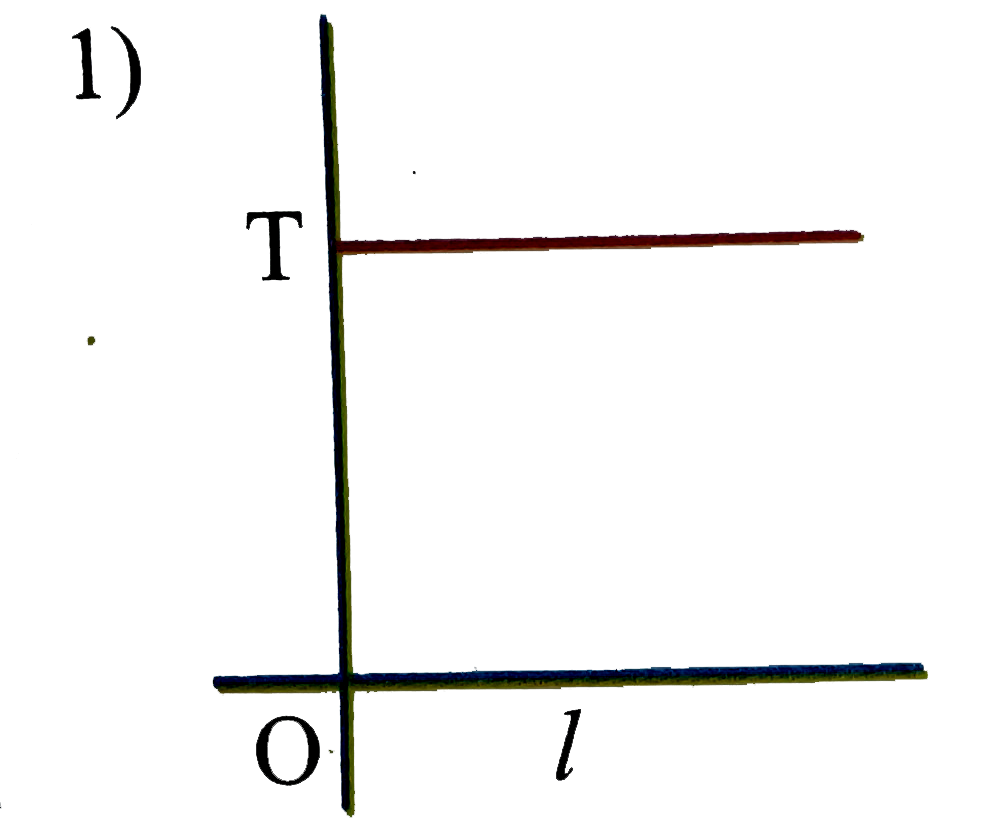
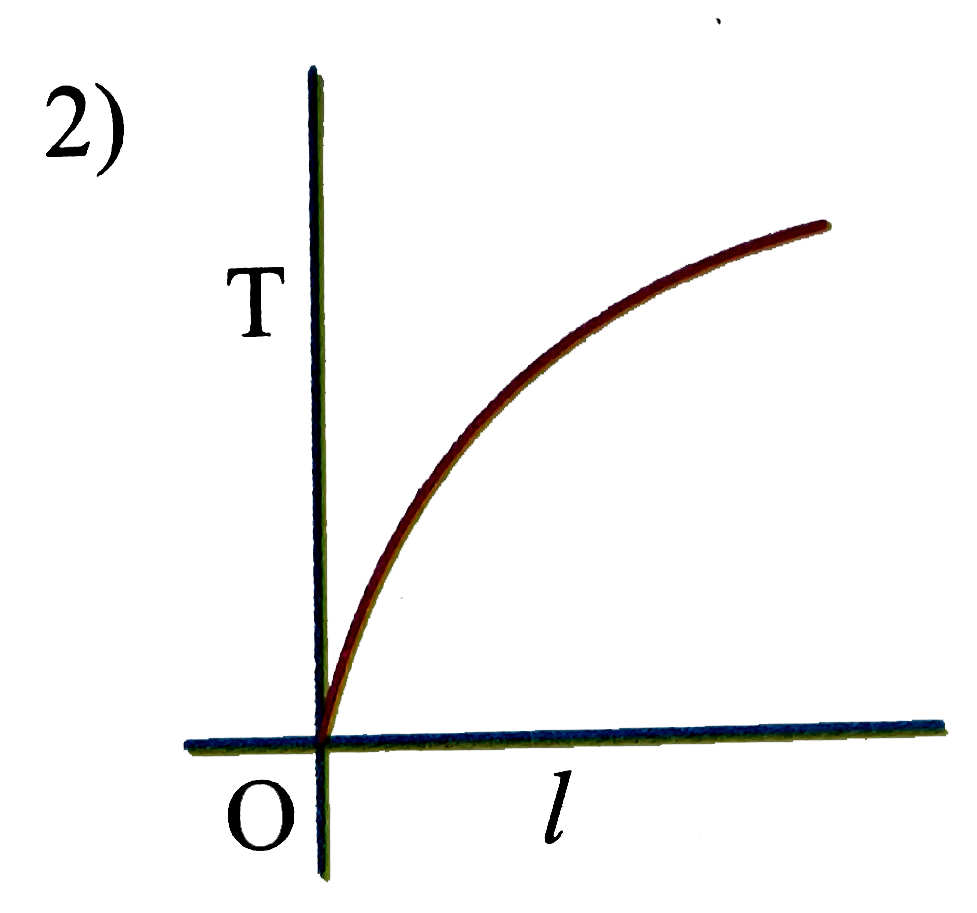
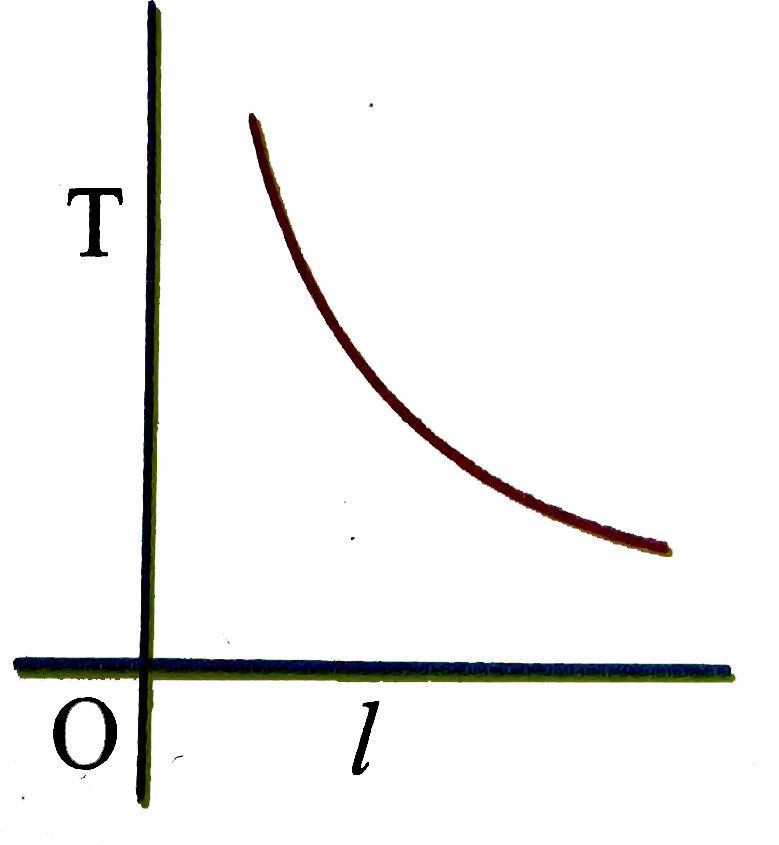
Which one of the following graphs indicates the variations of time period (T) of a simple pendulum to with the its length (l) is :
A

B

C

D

Text Solution
The correct Answer is:B
For a simple pendulum,
T∝√l
T2∝l
Graph between T and l will be a parabola symmetic about T-axis.
|
Topper's Solved these Questions
- OSCILLATIONS BOOK - PREMIERS PUBLISHERSCHAPTER - OSCILLATIONS EXERCISE - OTHER IMPORTANT QUESTIONS & ANSWERS ( VERY SHORT ANSWER QUESTIONS )
28 Videos
- OSCILLATIONS BOOK - PREMIERS PUBLISHERSCHAPTER - OSCILLATIONS EXERCISE - OTHER IMPORTANT QUESTIONS & ANSWERS ( SHORT ANSWER QUESTIONS )
46 Videos
- OSCILLATIONS BOOK - PREMIERS PUBLISHERSCHAPTER - OSCILLATIONS EXERCISE - EVALUATION TEXTBOOK QUESTIONS AND ANSWERS ( NUMERICAL PROBLEMS )
24 Videos
- NATURE OF PHYSICAL WORLD AND MEASUREMENTBOOK - PREMIERS PUBLISHERSCHAPTER - NATURE OF PHYSICAL WORLD AND MEASUREMENTEXERCISE - OTHER IMPORTANT QUESTIONS & ANSWERS (III. Short Answer Questions.)
24 Videos
- PROPERTIES OF MATTERBOOK - PREMIERS PUBLISHERSCHAPTER - PROPERTIES OF MATTEREXERCISE - OTHER IMPORTANT QUESTION & ANSWERS (NUMERICAL PROBLEMS)
56 Videos
Similar Questions
Knowledge Check
The graph of time period (T) of simple pendulum versus its length (l) is
A B
B C
C D
D
The graph between the length and square of the period of a simple pendulum is a
AcircleBparabolaCstraight lineDhyperbolaThe graph between time period (T) and length (l) of a simple pendulum is
A B
B C
C D
D
The graph between the length and square of the period of a simple pendulum is a
View SolutionThe graph between time period (T) and length (l) of a simple pendulum is
View SolutionDraw a graph (not to the scale) representing the variation of square of time period (T2) with the length (l) of a pendulum.
View SolutionThe graph of l against T for a simple pendulum is
View SolutionSimple pendulum is executing simple harmonic motion with time period T. If the length of the pendulum is increased by 21%, then the increase in the time period of the pendulum of the increased length is:
View Solution
