The graph of l against T for a simple pendulum is
a curve
a straight line
a parabola
an ellipse
The correct Answer is:C
Step by step video, text & image solution for The graph of l against T for a simple pendulum is by Physics experts to help you in doubts & scoring excellent marks in Class 12 exams.
Topper's Solved these Questions
Similar Questions
The graph of time period (T) of a simple pendulum versus its length (I) is
View SolutionThe time T of oscillation of a simple pendulum of length l is given by T=2π.√lg.
Find the percentage error in T corresponding to
(i) on increase of 2% in the value of l.
(ii) decrease of 2% in the value of l.View Solution
Knowledge Check
- Question 1 - Select One
The graph of time period (T) of simple pendulum versus its length (l) is
A B
B C
C D
D
- Question 2 - Select One
The time period of oscillation of a simple pendulum is given by T=2π√l/g
The length of the pendulum is measured as l=10±0.1 cm and the time period as T=0.5±0.02s. Determine percentage error in te value of g.A5%B8%C7%DNone of these - Question 3 - Select One
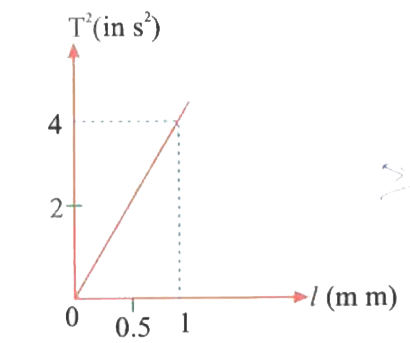
The l−T2 graph of a simple pendulum is an shown in the figure. The time period of the pendulum of length 0.5 mm is
 A1sB1.2 sC√2 sD1√2s
The ratio of the time period of a simple pendulum of length l0 with a pendulum of infinite length is :
(Where, R is the radius of earth)View SolutionIf the speed (v) of the bob in a simple pendulum is plotted against the tangential acceleration (a), the correct graph will be represented by
 View Solution
The time T of oscillation of as simple pendulum of length l is given by T=2π√lg. The percentage error in T corresponding to an error of 2% in the value of l is
View SolutionThe period (T) of a simple pendulum is measured for different length (L), then graph of Log T against log L is
View SolutionThe periodic time T of a simple pendulum are observed , for different length L if a graph of 'log T' against 'log L' is plotted , the slope of the graph at T = 2 s is
View Solution

