Liquid oxygen at 50K is heated to 300K at constant pressure of 1atm. The rate of heating is constant. Which of the following graphs represents the variation of temperature with time?


The correct Answer is:C
Step by step video, text & image solution for Liquid oxygen at 50 K is heated to 300 K at constant pressure of 1 atm. The rate of heating is constant. Which of the following graphs represents the variation of temperature with time? by Physics experts to help you in doubts & scoring excellent marks in Class 12 exams.
Updated on:21/07/2023Topper's Solved these Questions
- THERMODYNAMICSBook:AAKASH INSTITUTEChapter:THERMODYNAMICSExercise:ASSIGNMENT (SECTION -C) (Previous Year Questions)
Explore 54 Videos
- THERMODYNAMICSBook:AAKASH INSTITUTEChapter:THERMODYNAMICSExercise:ASSIGNMENT (SECTION -D) (Assertion - Reason Type Questions)
Explore 10 Videos
- THERMODYNAMICSBook:AAKASH INSTITUTEChapter:THERMODYNAMICSExercise:ASSIGNMENT (SECTION -A) (Objective Type Questions)
Explore 39 Videos
- THERMAL PROPERTIES OF MATTERBook:AAKASH INSTITUTEChapter:THERMAL PROPERTIES OF MATTERExercise:Assignment (Section-J) Akash Challengers Questions
Explore 7 Videos
- UNITS AND MEASUREMENTSBook:AAKASH INSTITUTEChapter:UNITS AND MEASUREMENTSExercise:ASSIGNMENT (SECTION - D)
Explore 15 Videos
Similar Questions
Which one of the following given graphs represents the variation of rate constant (k) with temperature (f) for an endothermic reaction ?
View SolutionWhich one of the following given graphs represents the variation of rate constant (k) with temperature (t) for an endothermic reaction ?
View Solution
Knowledge Check
Liquid oxygen at 50K is heated to 300K at constant pressure of 1atm. The rate of heating is constant. Which of the following graphs represents the variation of temperature with time?
A B
B C
C D
D
Arrhenius equation is :
k=Ae−E/RT
Which of the following graphs represents the variation of rate constant k against temperatureT ?A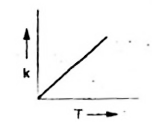 B
B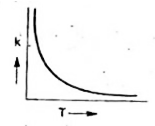 C
C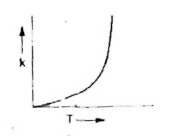 D
D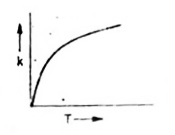
Arrehnius equation is :
k=Ae−Ea/RT
Which of the following graphs represents the variation of rate constant k against temerature T?A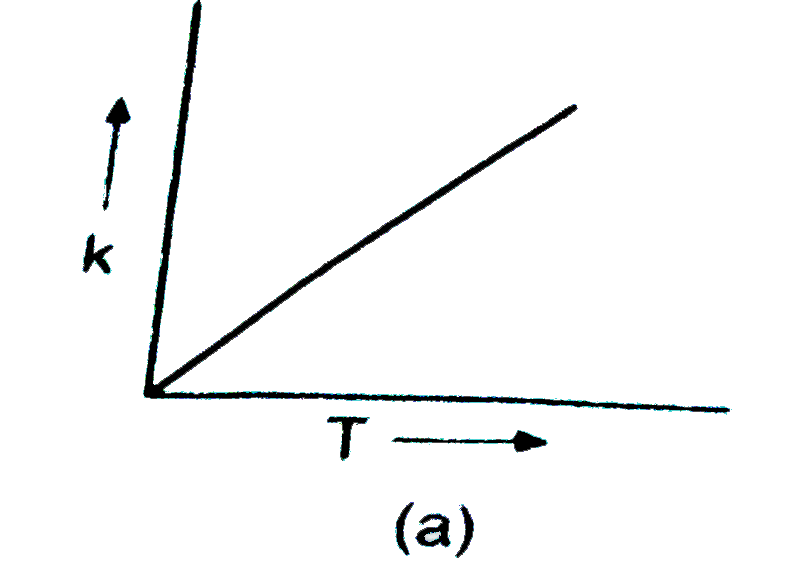 B
B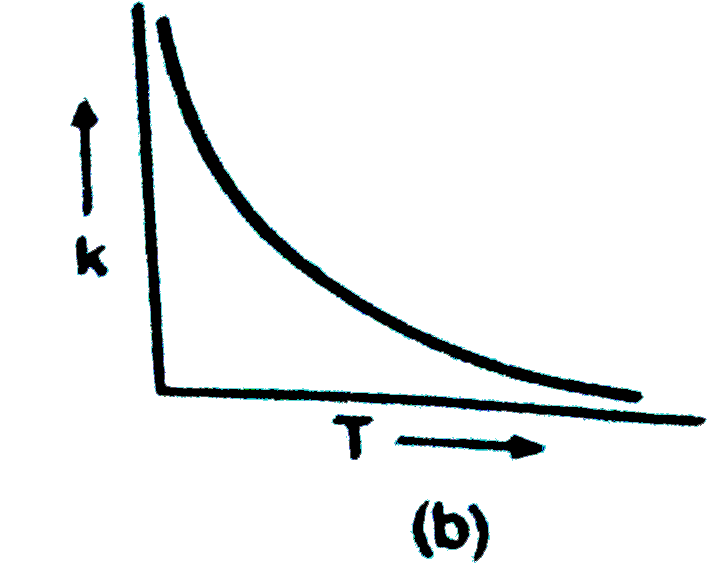 C
C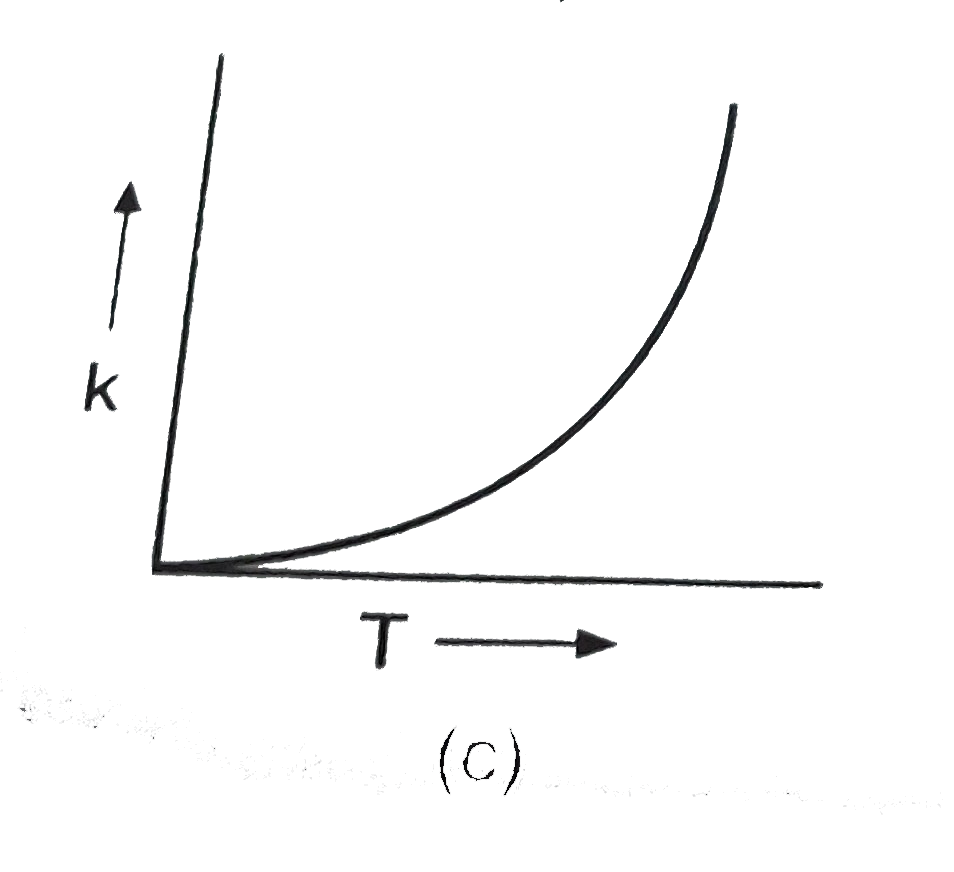 D
D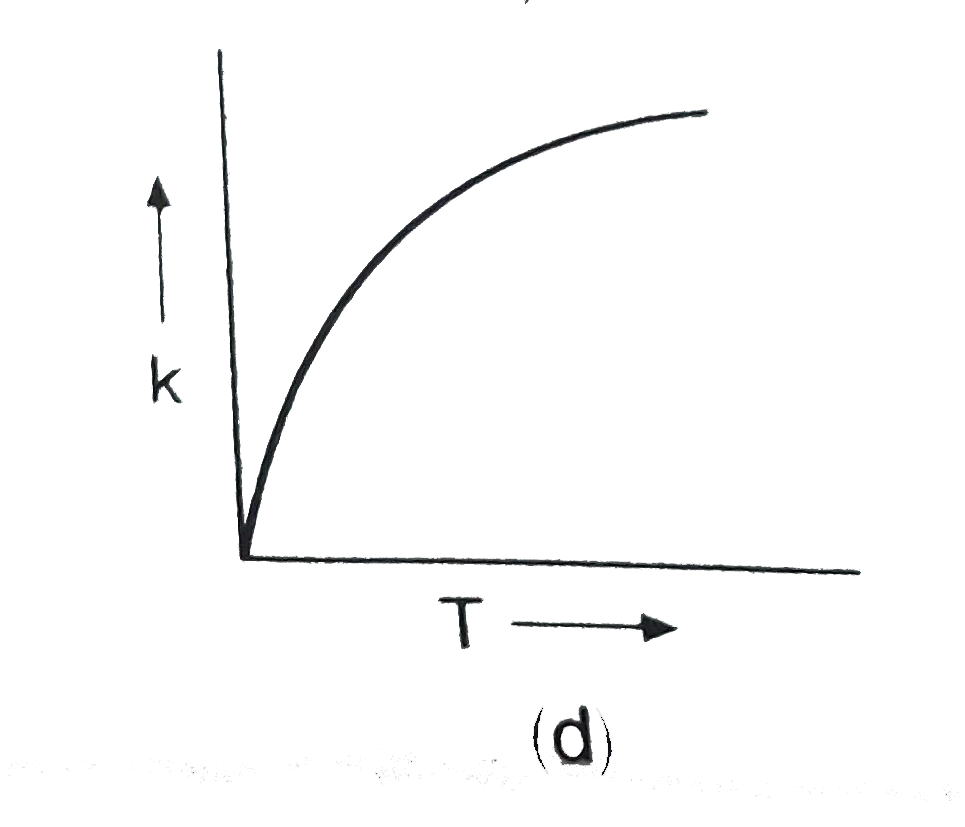
Which one of the following graphs represents variation of specific heat capacity of water with temperature?
View SolutionIf heat energy is given to an ideal gas at constant pressure, then select the graph which best represents the variation of VT with temperature (T).
View SolutionAt a constant pressure, of the following graphs that one which represents the variation of the density of an ideal gas with the absolute temperature T, is
View SolutionAccording to Arrheneius equation rate constant k is equal to Ae−Ea/RT. Which of the following options represents the graph of ln k vs 1T?
View SolutionOne mole of an ideal gas requires 207 J heat to raise the temperature by 10K When heated at constant pressure. If the same gas is heated at constant volume to raise the temperature by 5K, then the heat required is
View Solution
