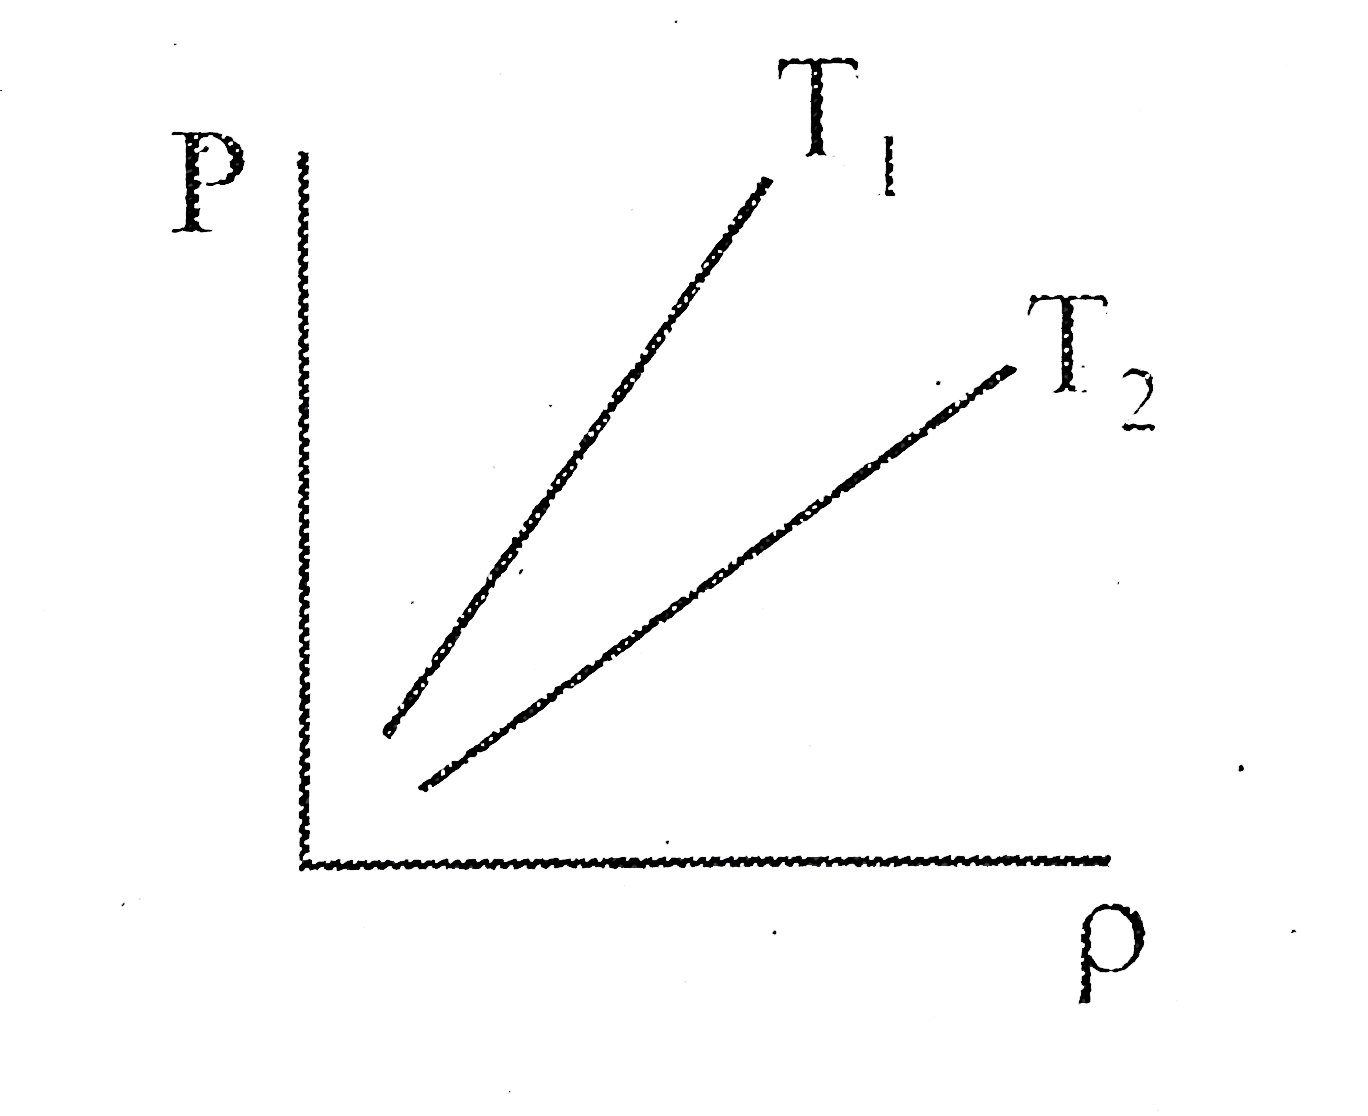
The adjoining figure shows graph of pressure and volume of a gas at two temperatures T1andT2 . Which of the following inferences is correct ?

A
T1=T2
B
T1<T2
C
T1>T2
D
None of these
Text Solution
The correct Answer is:C
For a given pressure , then volume will be more if temperature is more (Charles' law)

From the graph it is clear that V2>V1⇒T1>T2.
|
Topper's Solved these Questions
- KINETIC THEORY OF GASESBOOK - PREMIERS PUBLISHERSCHAPTER - KINETIC THEORY OF GASESEXERCISE - OTHER IMPORTANT QUESTIONS & ANSWERS (III. Short Answer Questions.)
16 Videos
- KINETIC THEORY OF GASESBOOK - PREMIERS PUBLISHERSCHAPTER - KINETIC THEORY OF GASESEXERCISE - OTHER IMPORTANT QUESTIONS & ANSWERS (IV. Long Answer Questions.)
6 Videos
- KINETIC THEORY OF GASESBOOK - PREMIERS PUBLISHERSCHAPTER - KINETIC THEORY OF GASESEXERCISE - TEXTBOOK QUESTIONS & ANSWERS (III. Long Answer Questions.)
16 Videos
- KINEMATICS BOOK - PREMIERS PUBLISHERSCHAPTER - KINEMATICS EXERCISE - Other important questions & answers (V. Numerical problems).
166 Videos
- LAW OF MOTION BOOK - PREMIERS PUBLISHERSCHAPTER - LAW OF MOTION EXERCISE - OTHER IMPORTANT QUESTIONS & ANSWERS (VI Numerical Problems)
62 Videos
Similar Questions
Knowledge Check
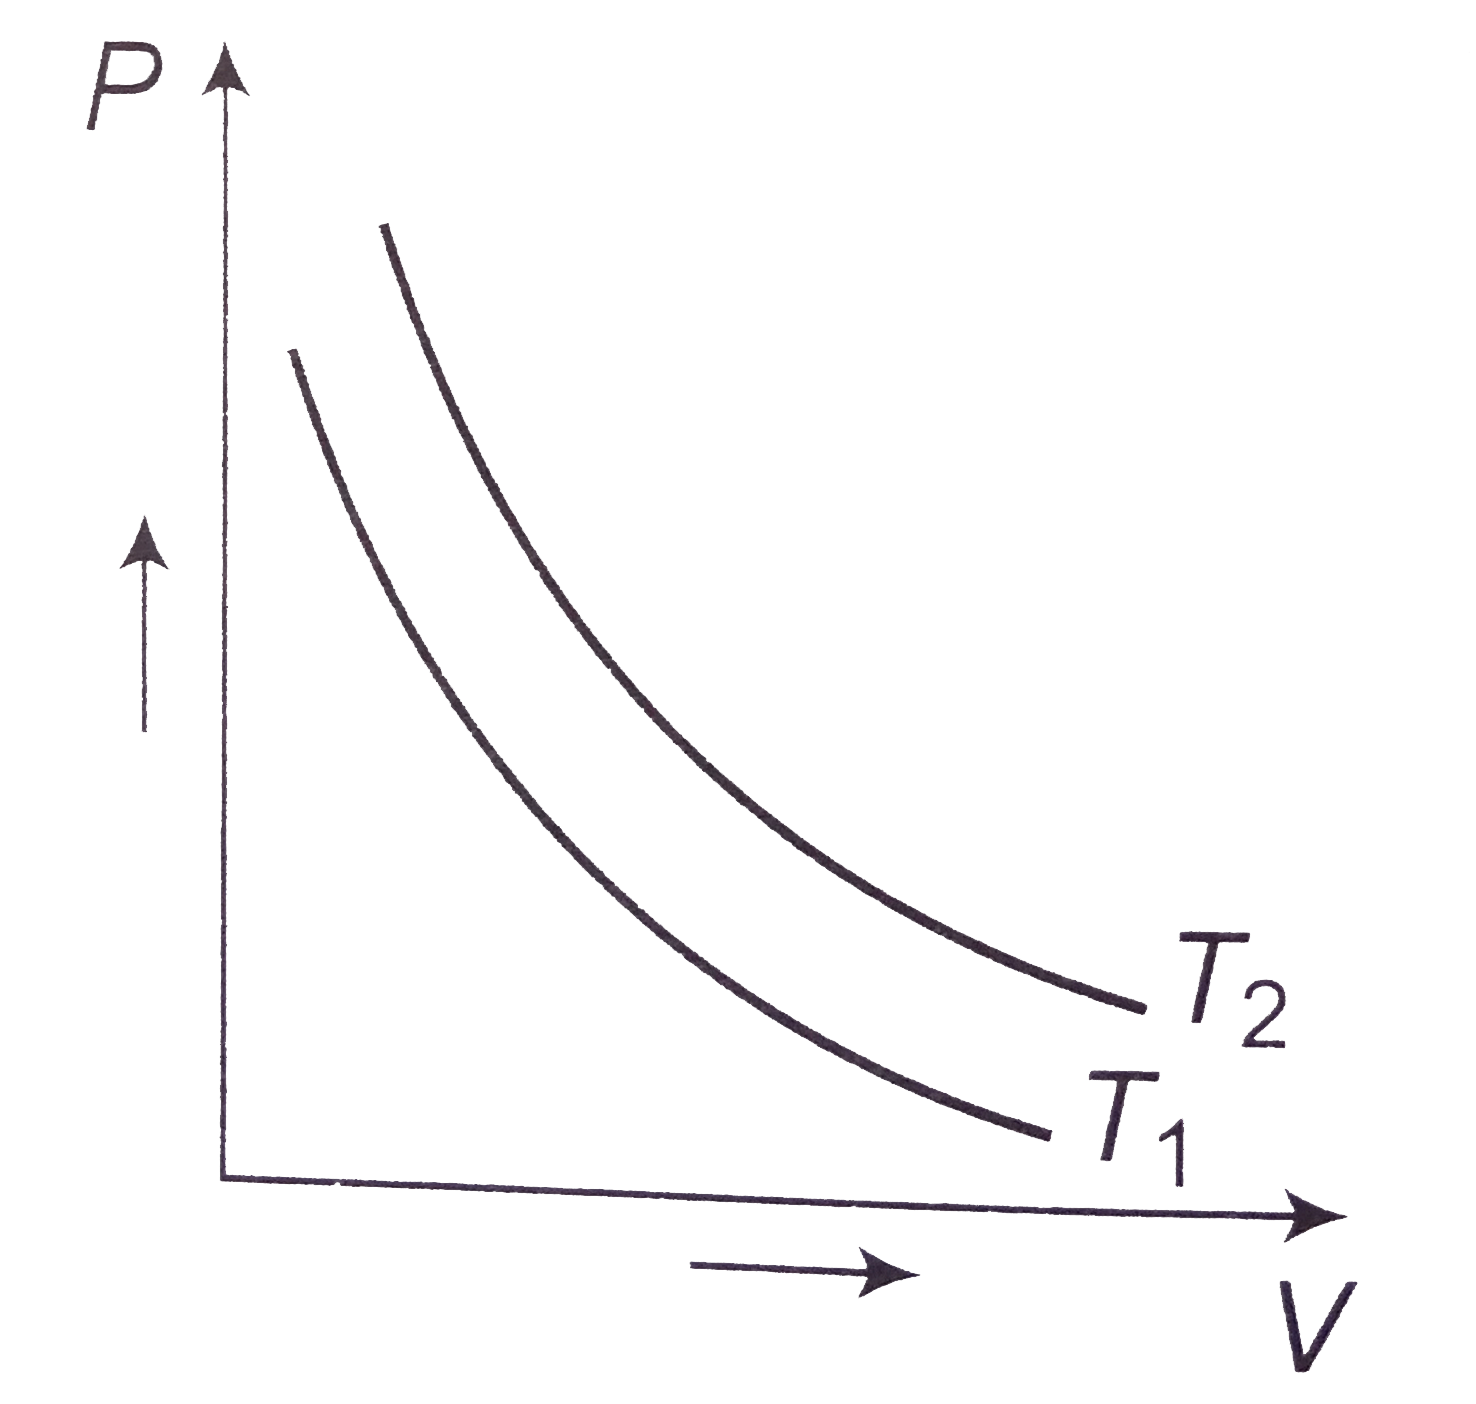
The adjoining figure shows graphs of pressure and volume of a gas at two temperature T1 and T2 Which of the following inferences is correct?AT1>T2BT1=T2CT1<T2DnoneThe adjoining fgure shows graph of pressure and volume of a gas at two temperatures T1 and T2 Which one the following is correct
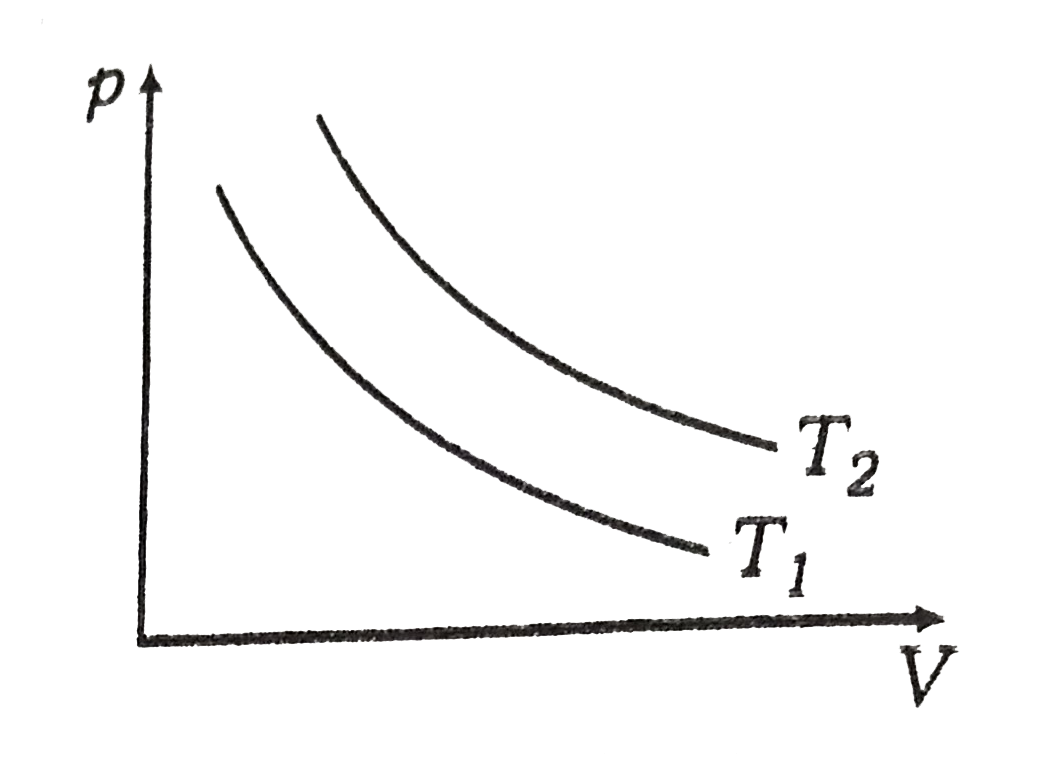 AT1>T2BT1=T2CT1<T2DNothing can be said about temperatures
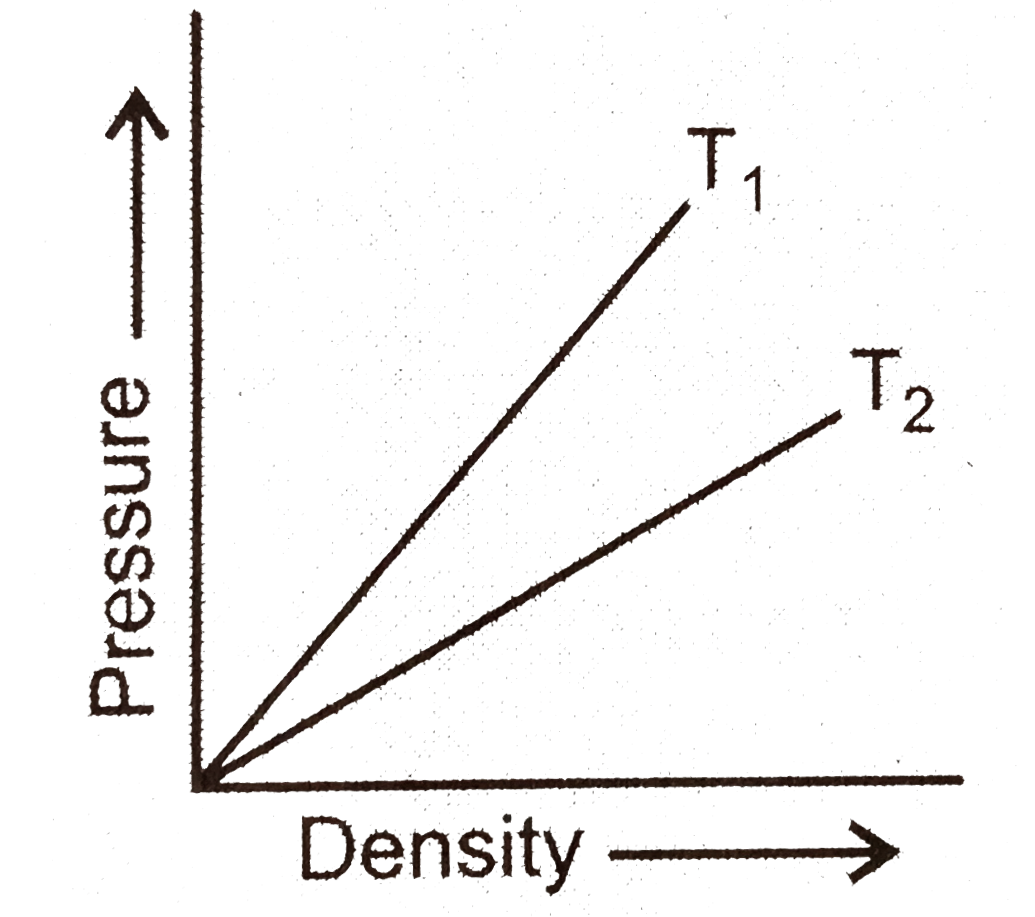
Figure shows graphs of pressure vs density for an ideal gas at two temperature T1andT2. Which of the following is correct?
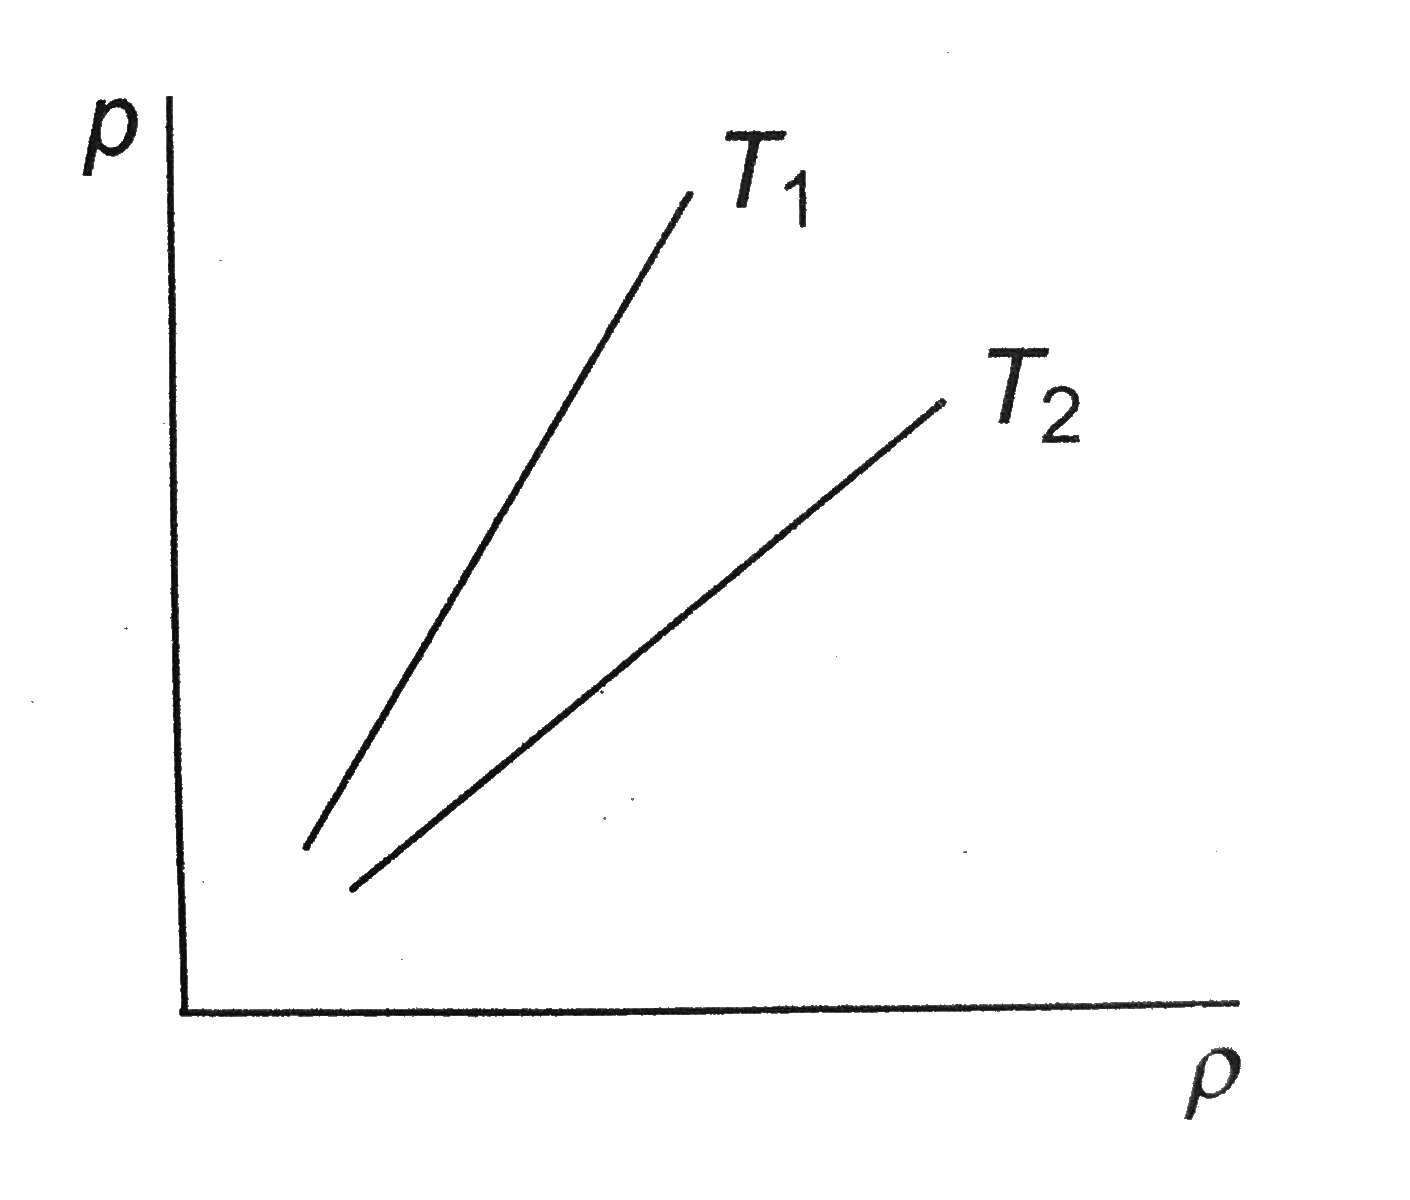 AT1>T2BT1=T2CT1<T2Dany of the three is possible
Figure shows graphs of pressure vs density for an ideal gas at two temperature T1andT2. Which of the following is correct?

View SolutionFigure shows graphs of pressure versus density for an ideal gas at two temperatures T1 and T2 Then
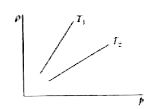
View SolutionFigure shows graphs of pressure vs density for an ideal gas at two temperatures Tt and T2
View SolutionShows graphs of pressure vs density for an ideal gas at two temperaturesT1andT2
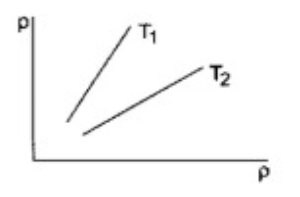
View SolutionFigure shows graphs of pressure versus density for an ideal gas at two temperatures T1 and T2 Which is correct ?
 .
.
View Solution

