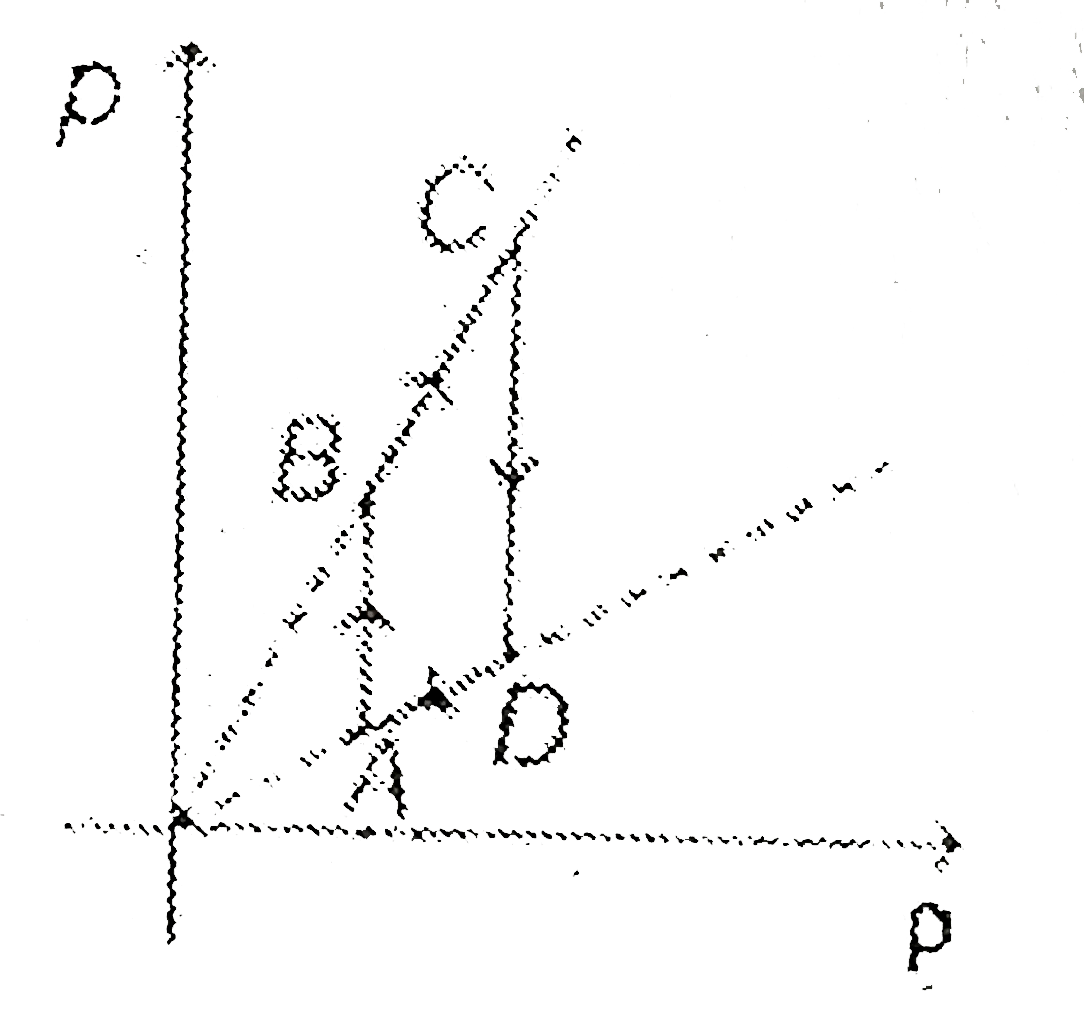
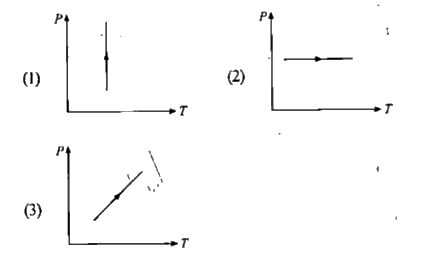
Pressure versus temperature graphs of an ideal gas are as shown in figure. Choose the wrong statement
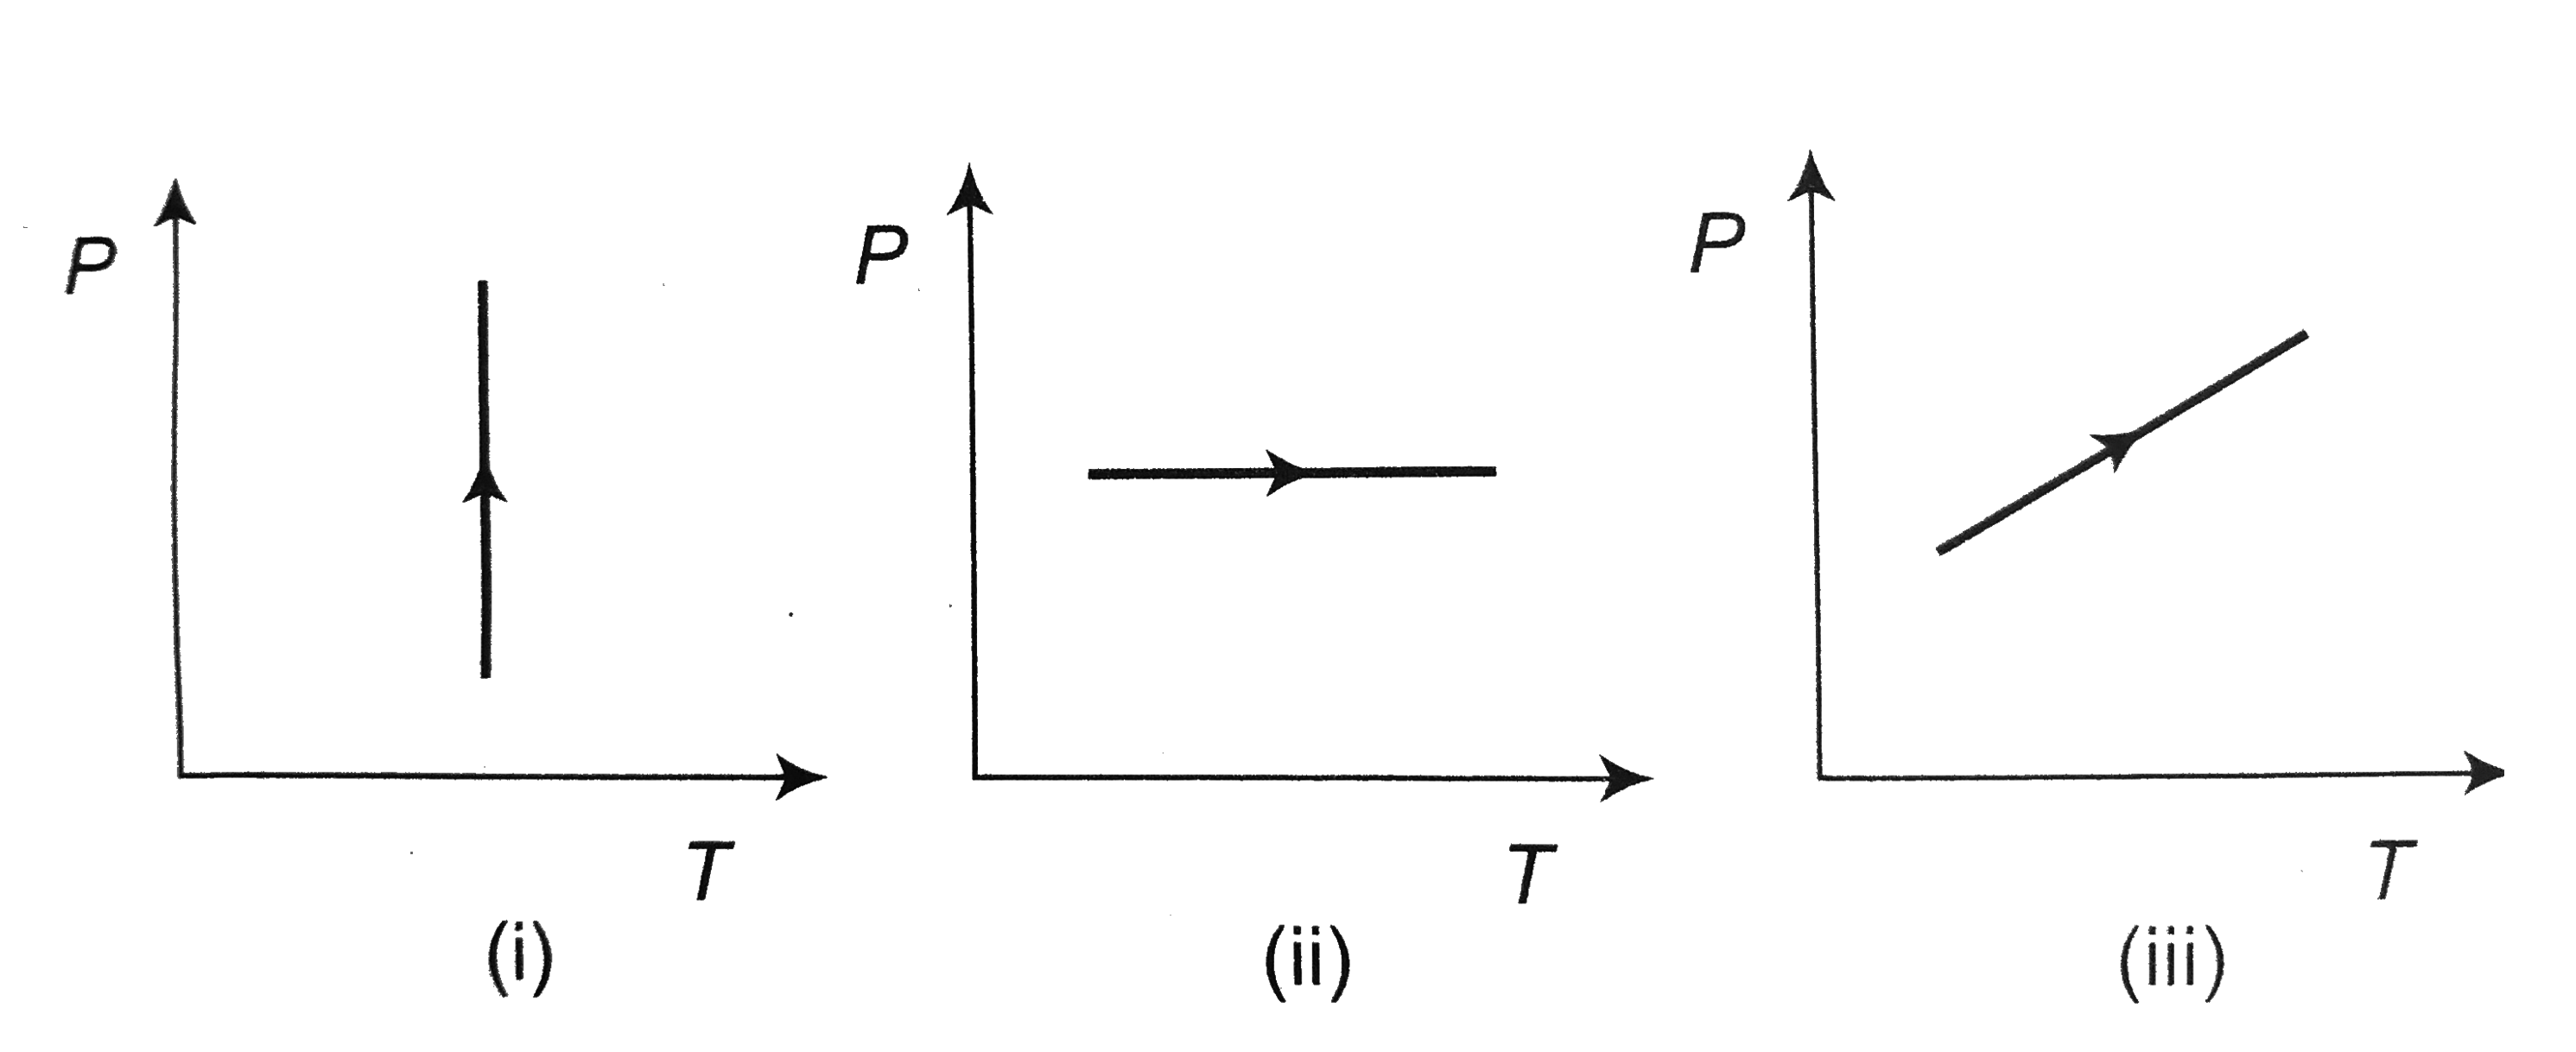
Density of gas is incresing in graph (i)
Density of gas decreasing in graph (ii)
Density of gas isconstant in graph (iii)
None of the above
The correct Answer is:D
For equation : (∵p=ρRTMw)
At constant temperature ρ∝P
1st graph : ρ∝P At constant temperature
For 2nd graph : (∵P=ρRTMw)
At constant P , ρ∝1t
For 3rd graph L:dPdT = constant ⇒P∝T
⇒ density ρ = constant
_E01_043_S01.png)
Topper's Solved these Questions
- BOOK - ALLENCHAPTER - GEOMETRICAL OPTICSEXERCISE - EXERCISE -0282videos
GEOMETRICAL OPTICS
- BOOK - ALLENCHAPTER - GEOMETRICAL OPTICSEXERCISE - EXERCISE -0311videos
GEOMETRICAL OPTICS
- BOOK - ALLENCHAPTER - GEOMETRICAL OPTICSEXERCISE - SOME WORKED OUT EXAMPLES84videos
GEOMETRICAL OPTICS
- BOOK - ALLENCHAPTER - CURRENT ELECTRICITYEXERCISE - All Questions427videos
CURRENT ELECTRICITY
- BOOK - ALLENCHAPTER - GRAVITATIONEXERCISE - EXERCISE 49videos
GRAVITATION
Similar Questions
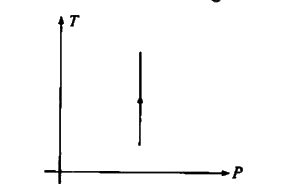
Pressure versus temperature graph of an ideal gas are as shown in figure-2.39. Choose the wrong statement
 View Solution
Pressure (P) versus temperature (T) graph of an ideal gas is shown in the figure. Density of the gas at point A is ρ0 and at B is ρ. Find ρρ0.
'(##CEN_KSR_PHY_JEE_C13_E01_014_Q04##)'View Solution
Knowledge Check
- Question 1 - Select One
Pressure versus temperature graph of an ideal gas is as shown in figure. Density of the gas at point A is ρ0. Density at point B will be :-
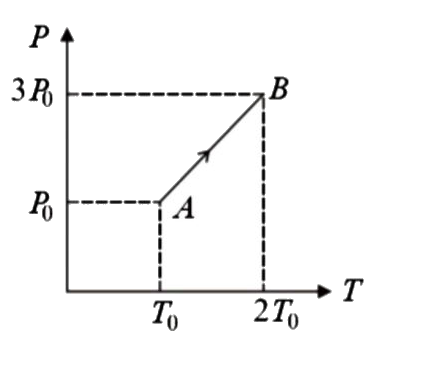 A34ρ0B32ρ0C43ρ0D2ρ0
 - Question 2 - Select One
Pressure versus temperature graph of an ideal gas is shown in figure. Density of the gas at point A is P0. Density at B will be
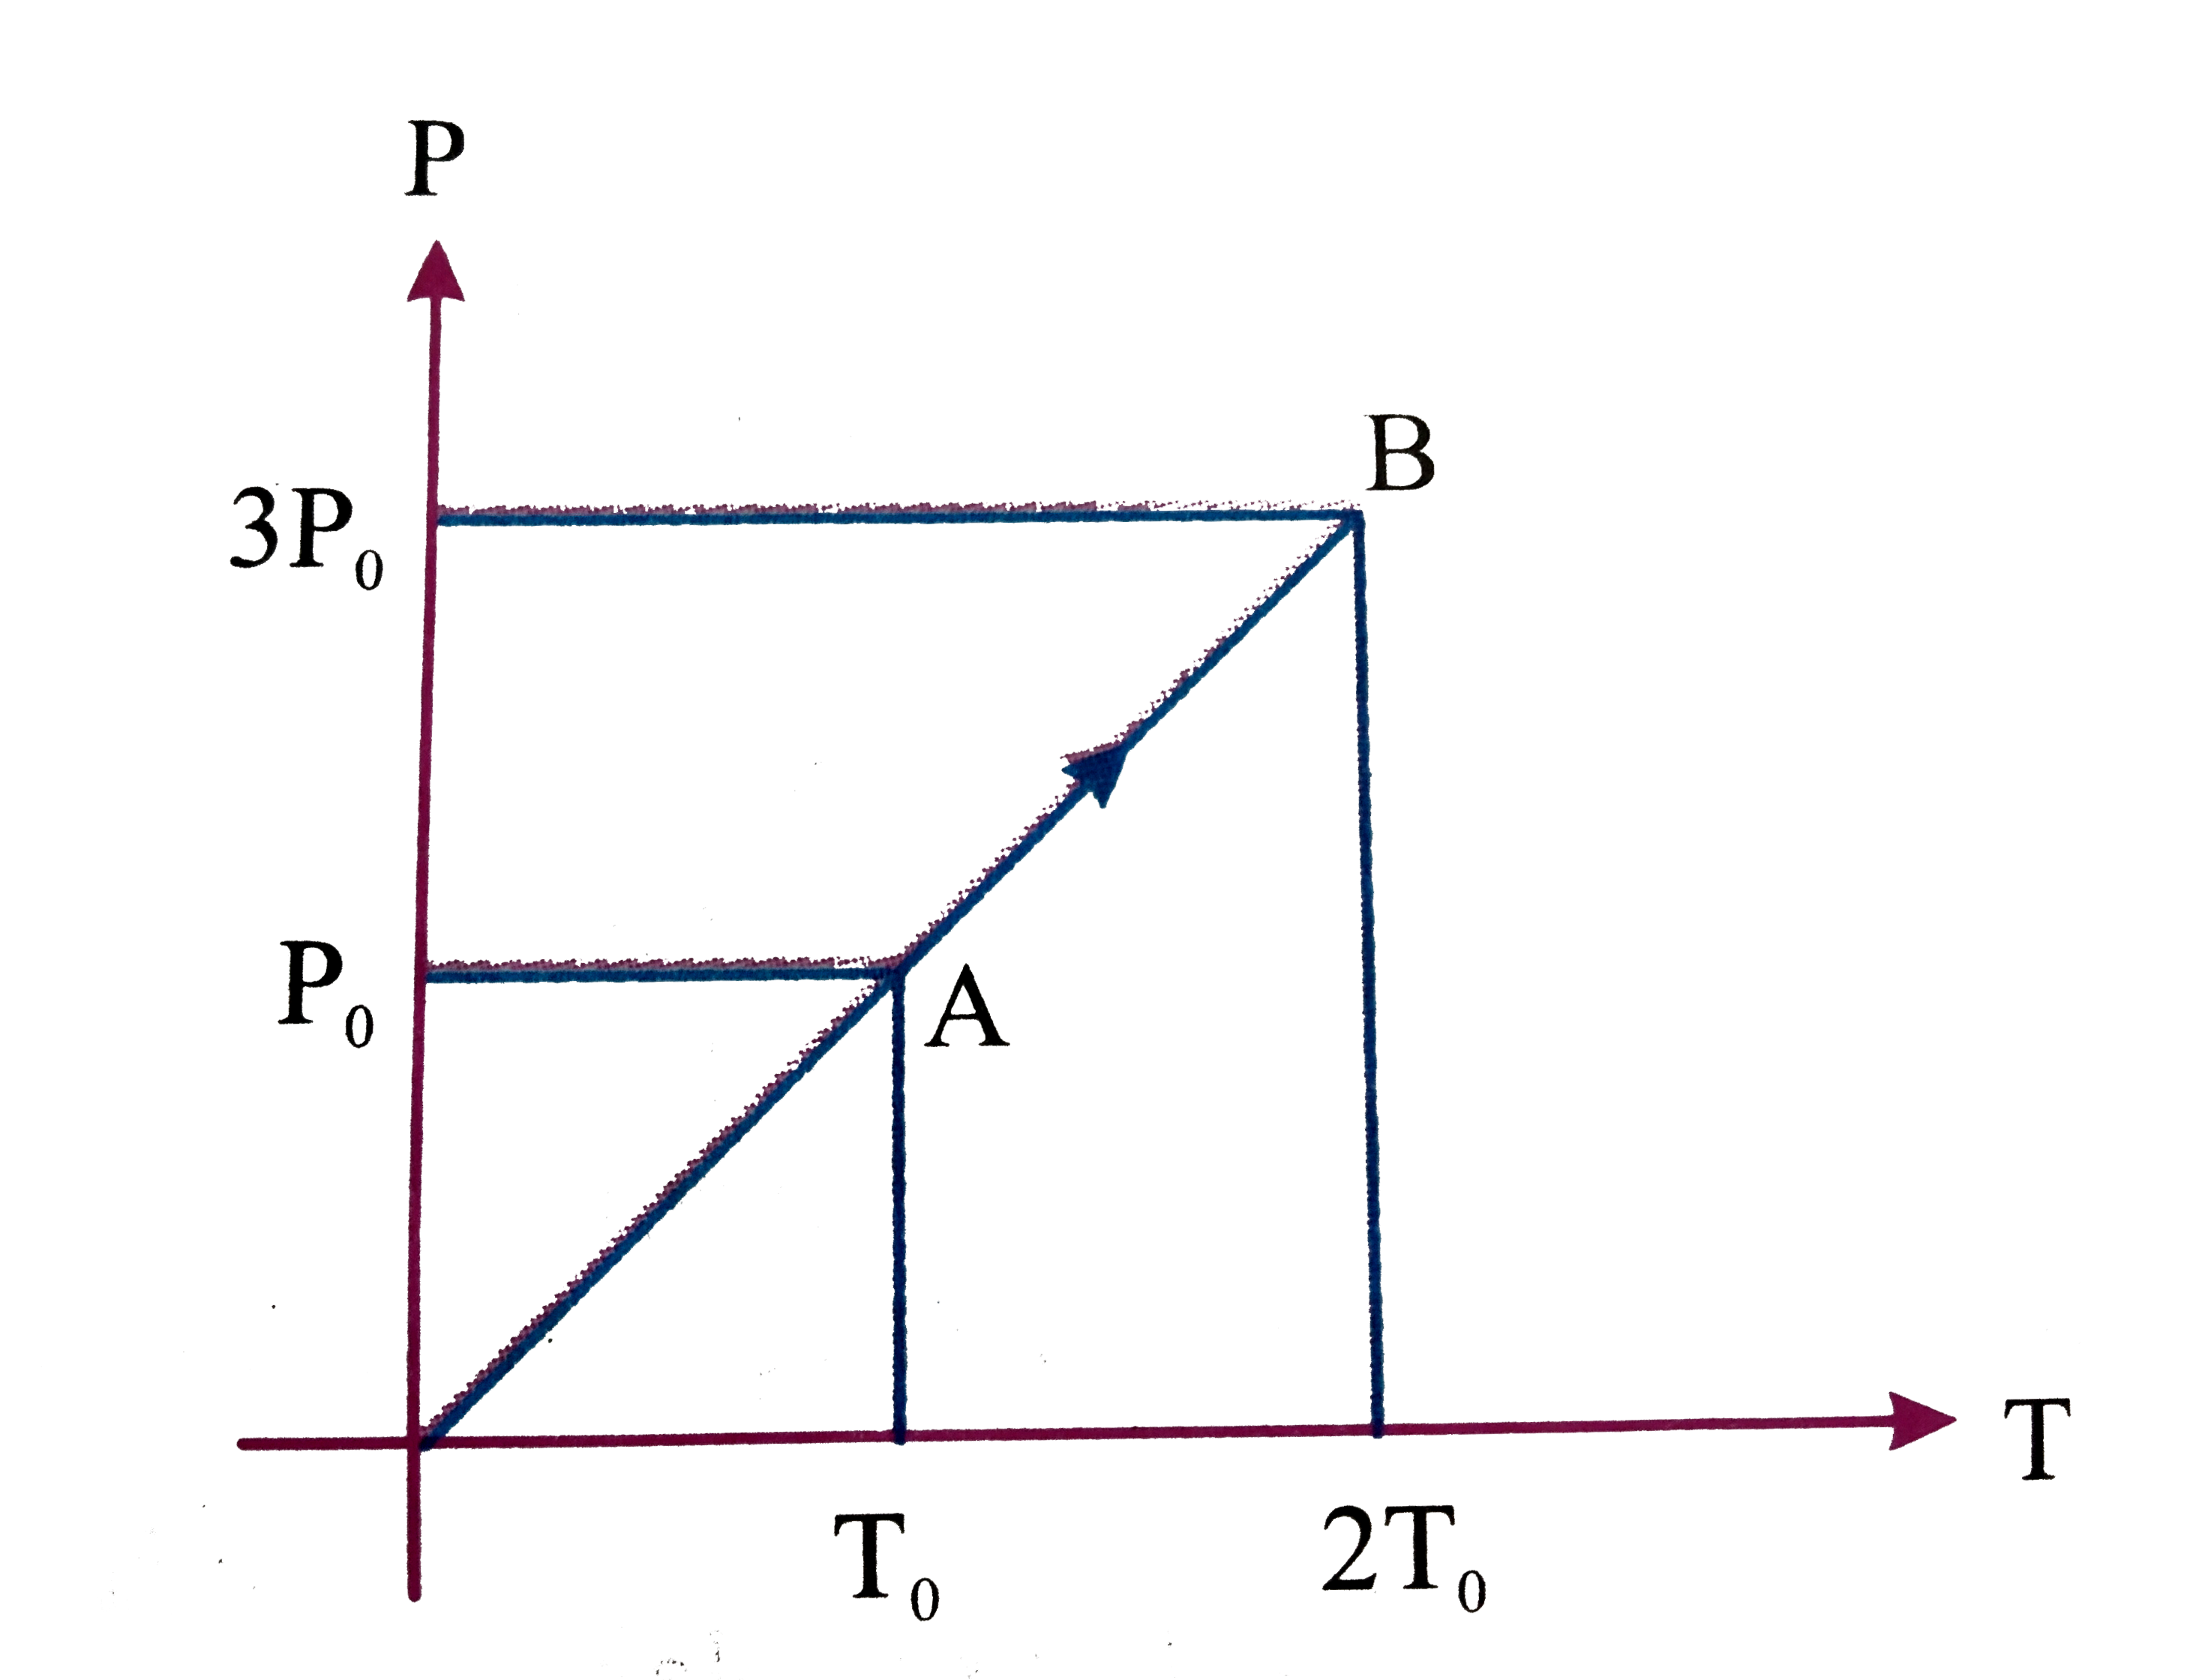 A34ρ0B32ρ0C43ρ0D2ρ0
 - Question 3 - Select One
Pressure versus density graph of an ideal gas is shown in figure
 Aduring the process AB work done by the gas is positiveBduring the process AB work done by the gas is negativeCduring the process BC internal energy of the gas is increasingDNone of the above
P-T graphs of an ideal gas are as shown in figures-2.42 below. Choose the wrong statement from the options given:
 View Solution
Pressure versus temperature graph of an ideal gas is shown in figure. Density of the gas at point A is ρ0. Density at B will be
 View Solution
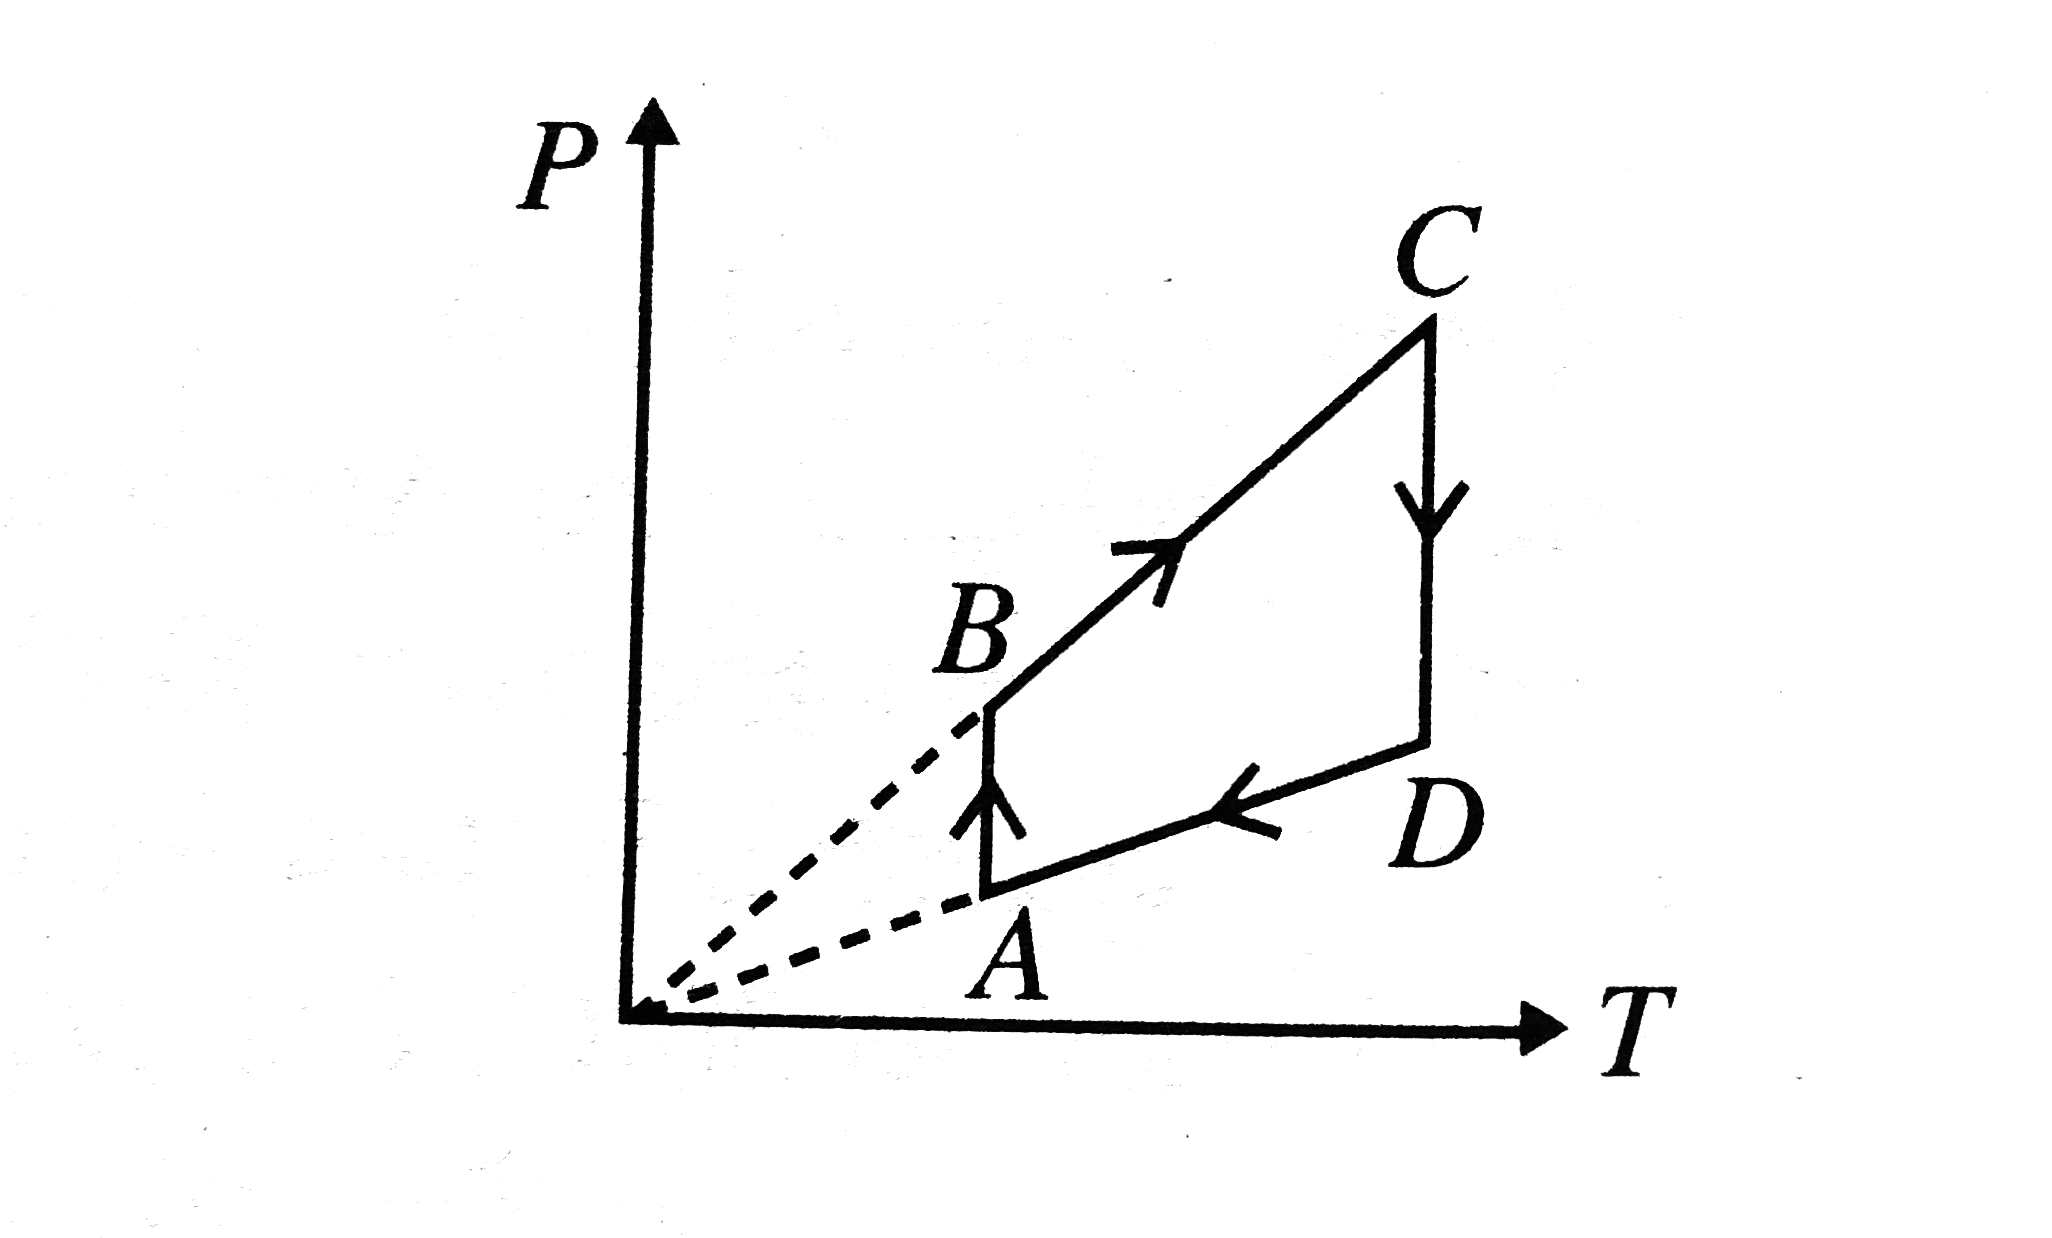
Pressure versus temperature graph of an ideal gas as shown in Fig.
Corresponding density (ρ) versus volume (V) graph will be
 View Solution
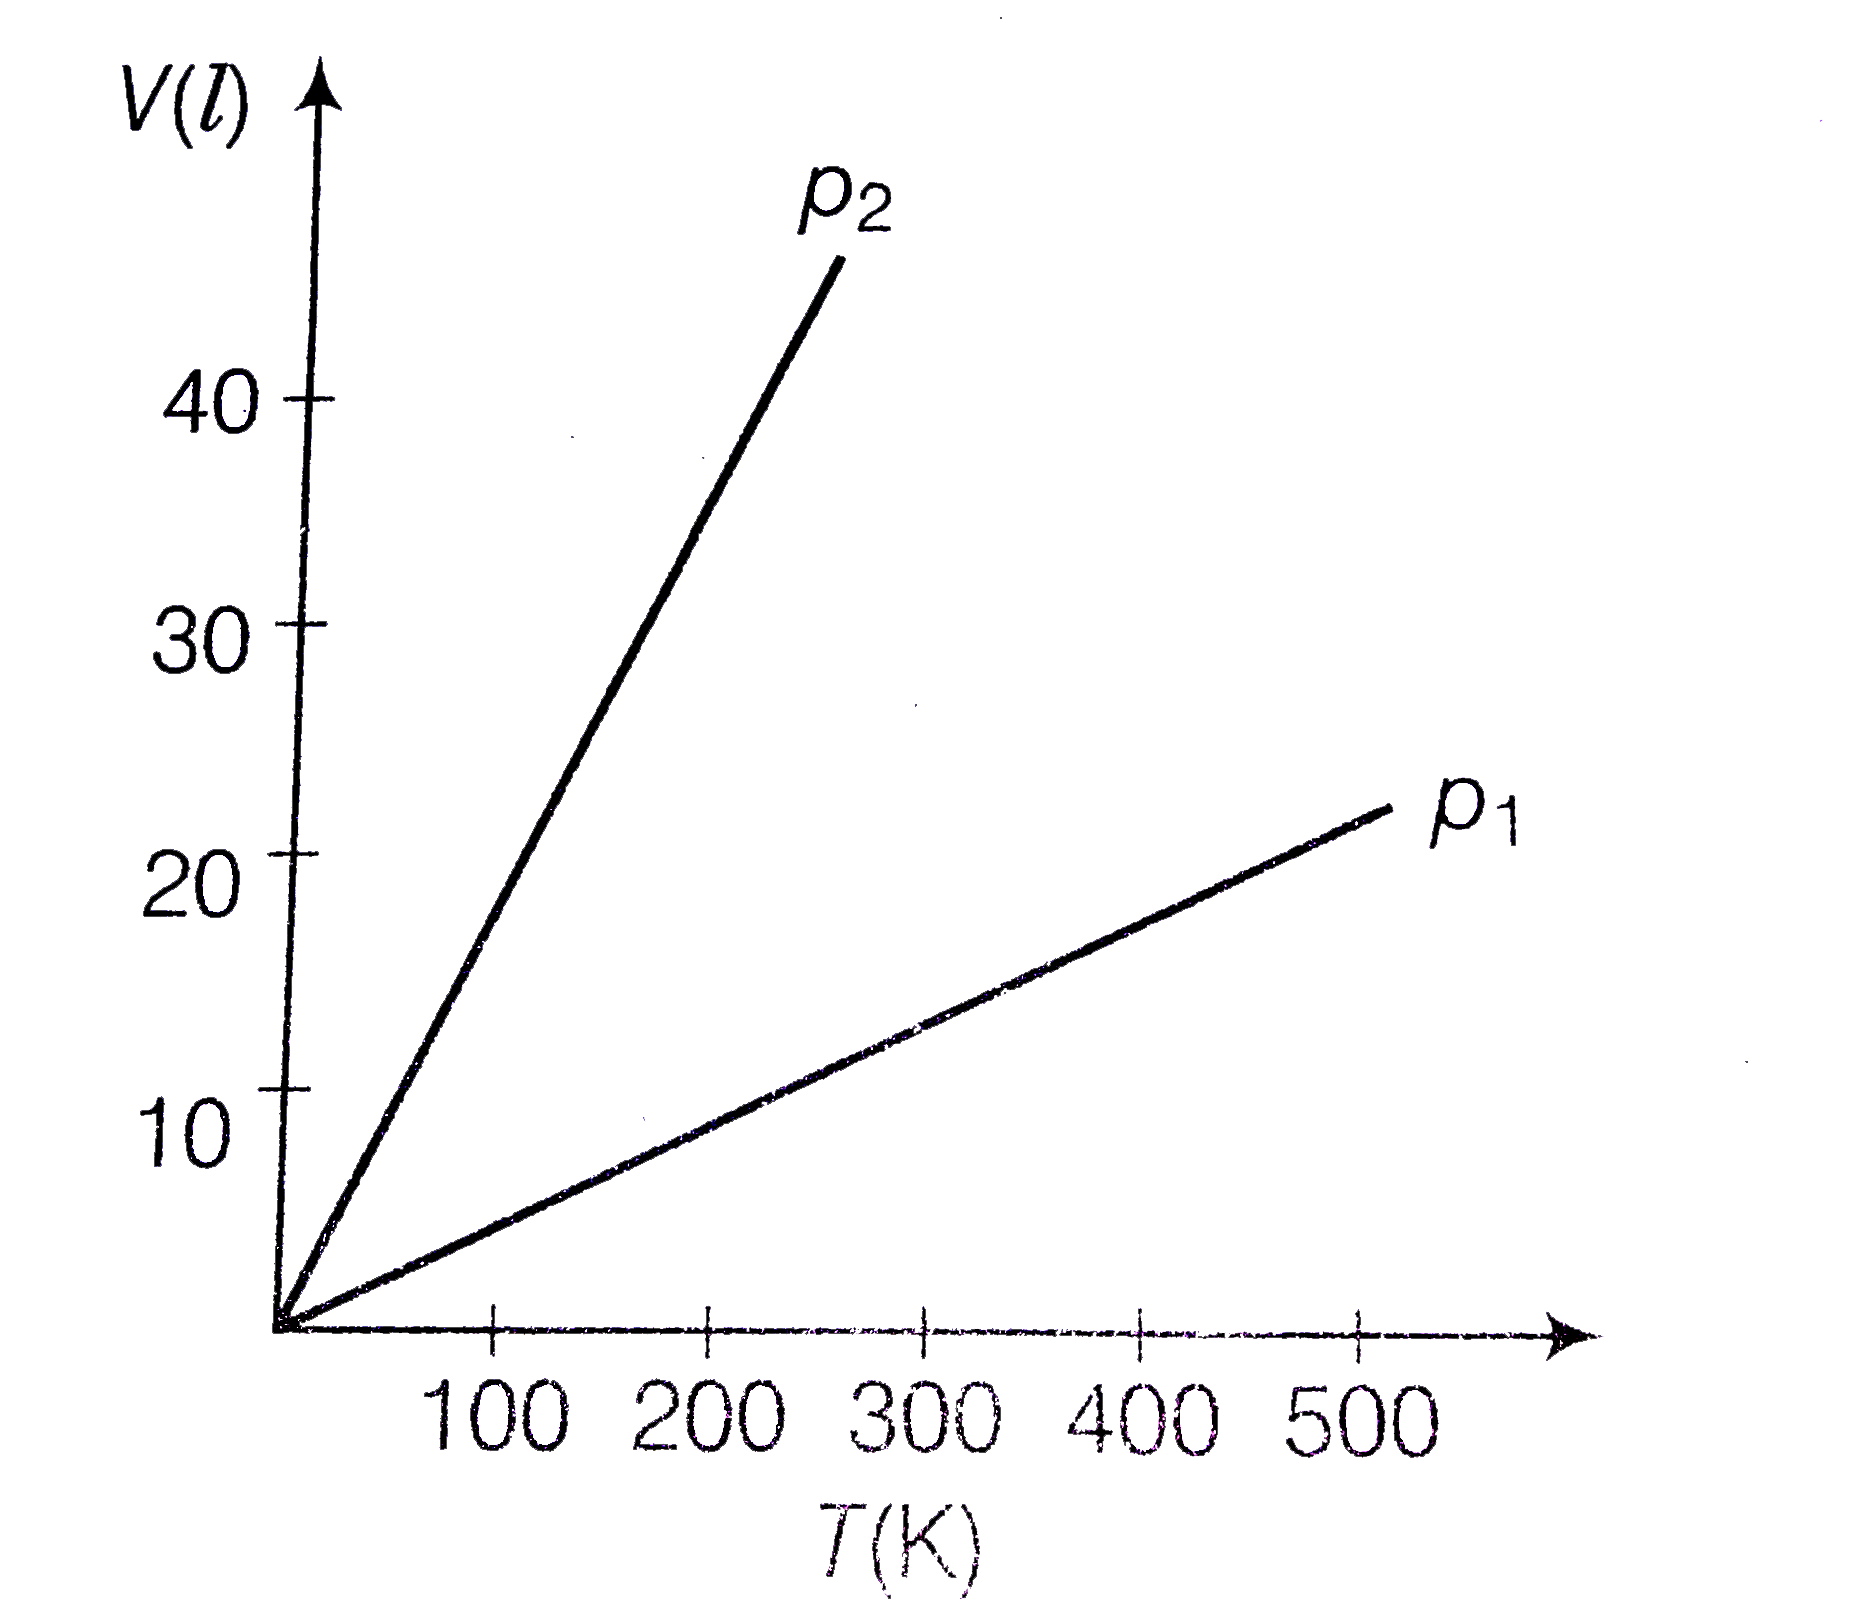
Volume versus temperature graphs for a given mass of an ideal gas are shown in figure. At two different values of constant pressure. What can be inferred about relation between P1 and P2 ?
 View Solution
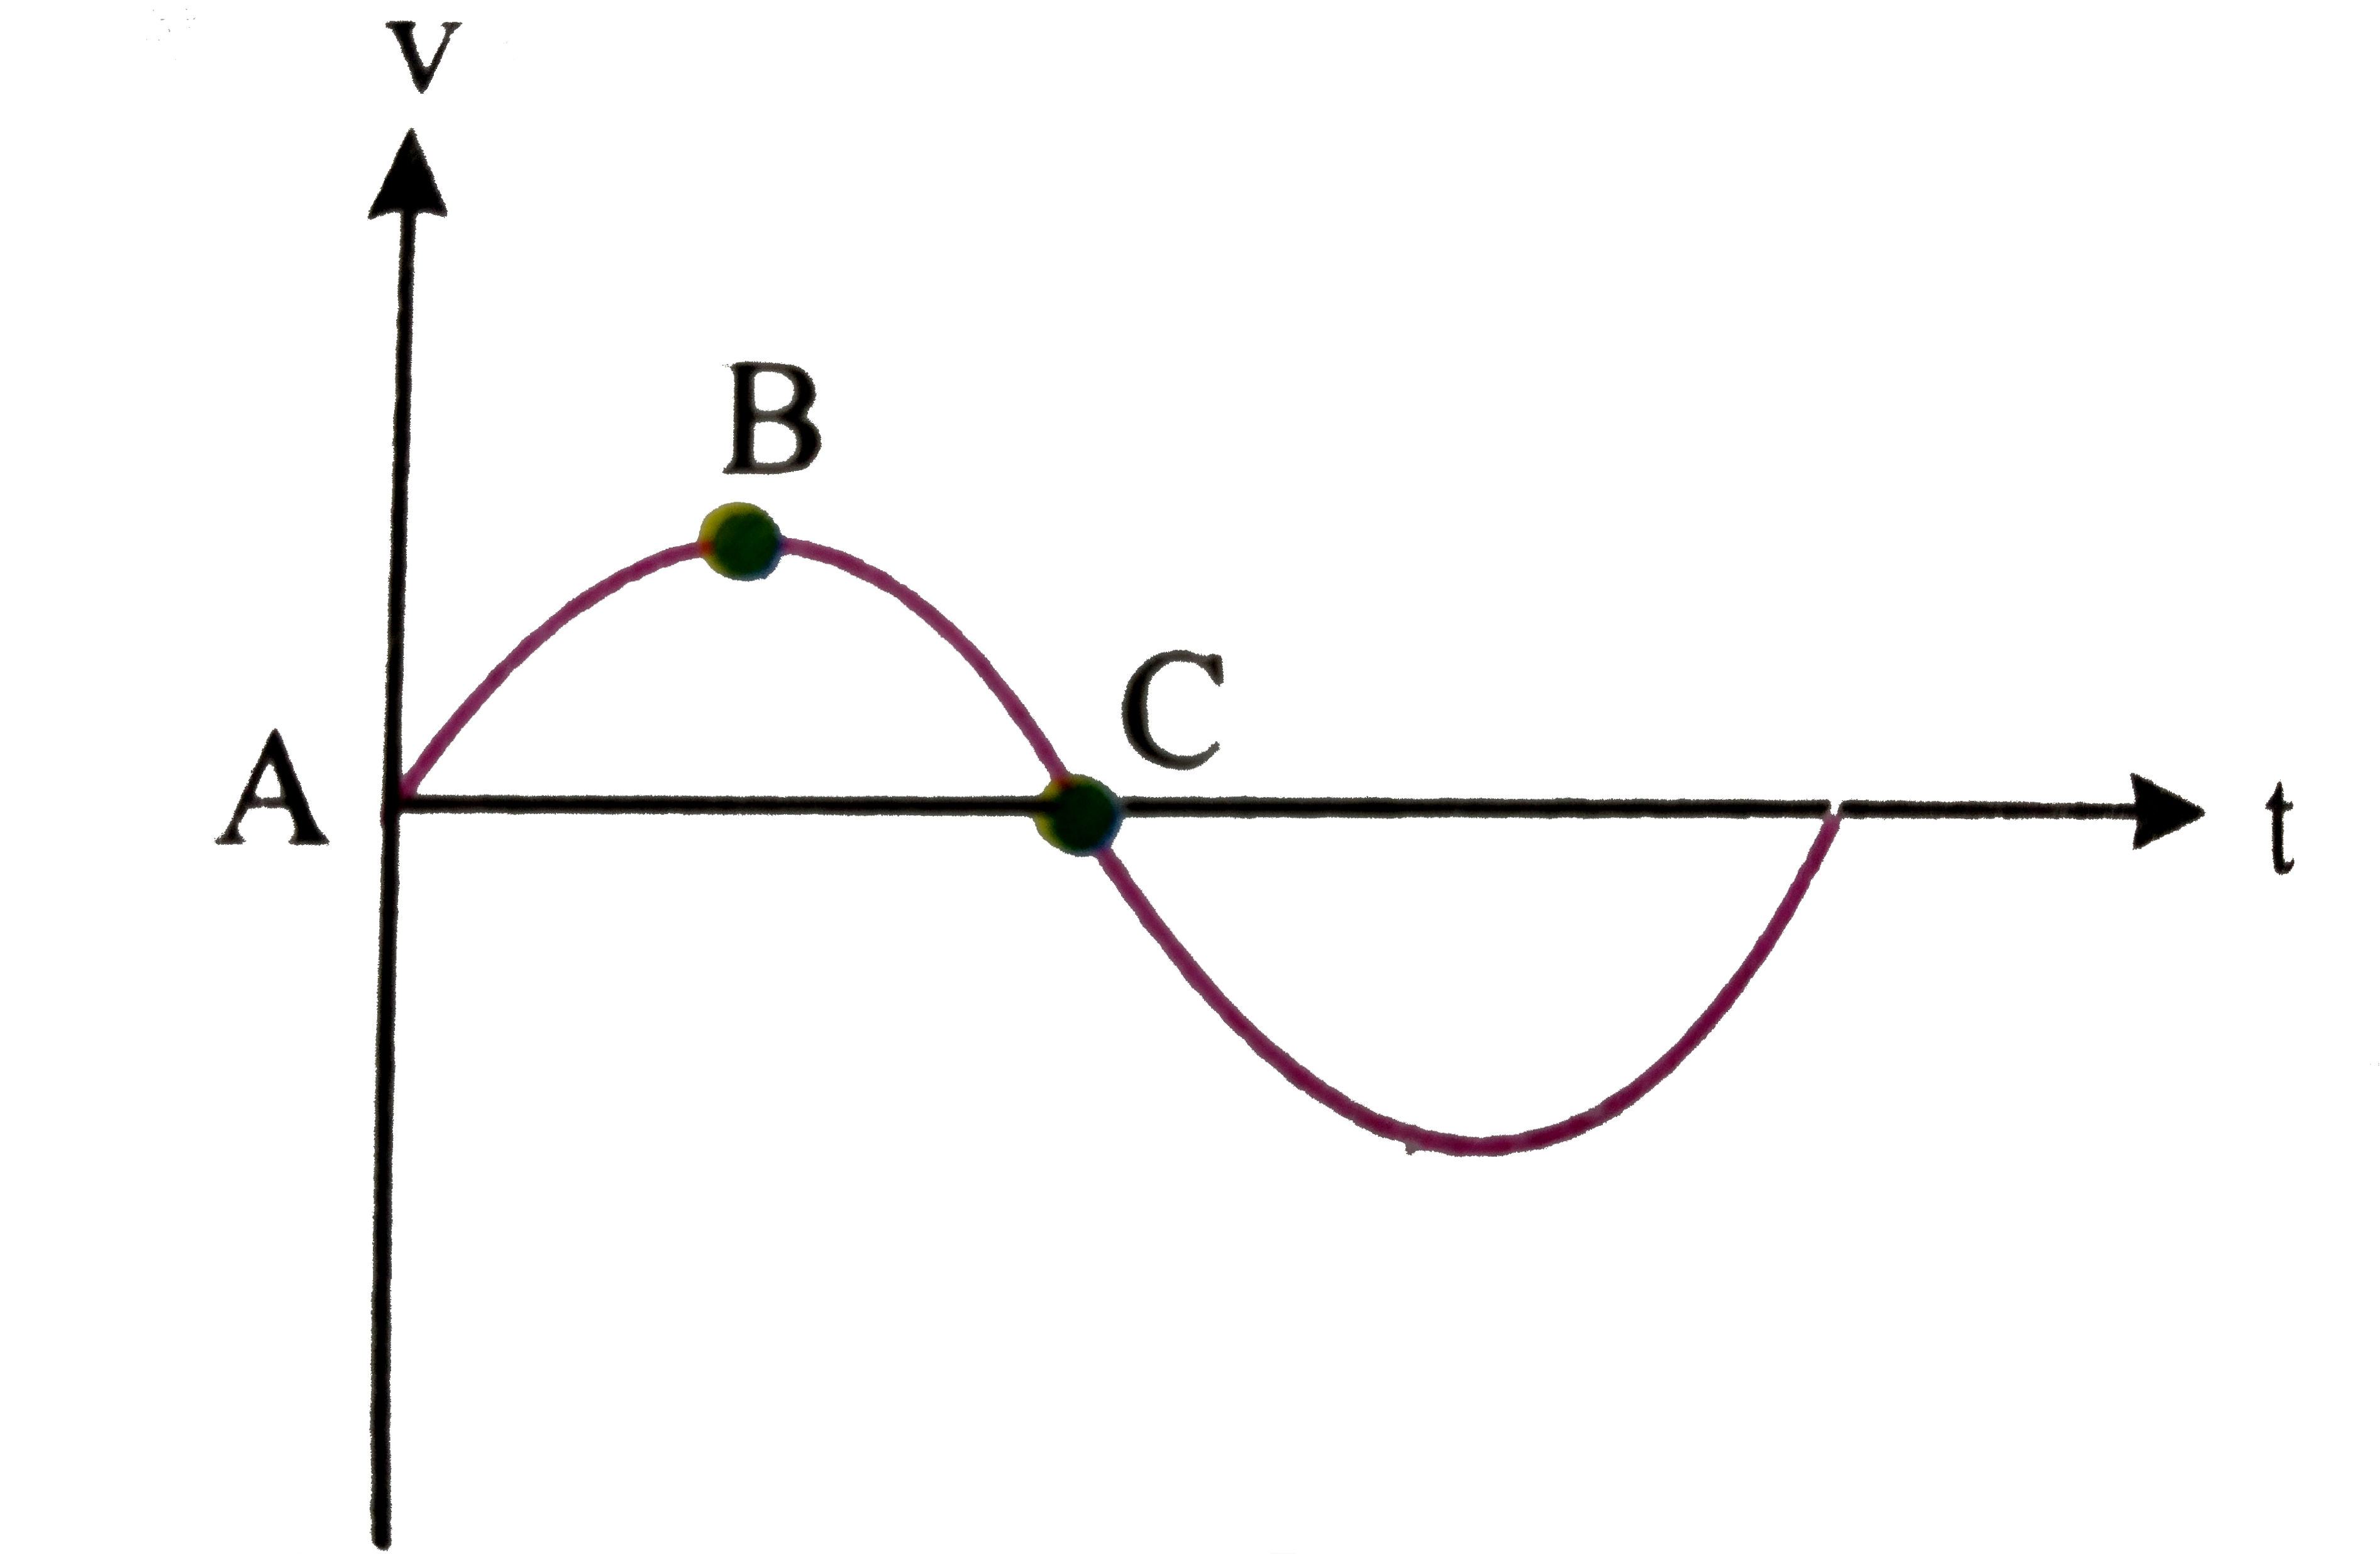
v−t graph of a particle in SHM is as shown is figure. Choose the wrong option.
 View Solution

