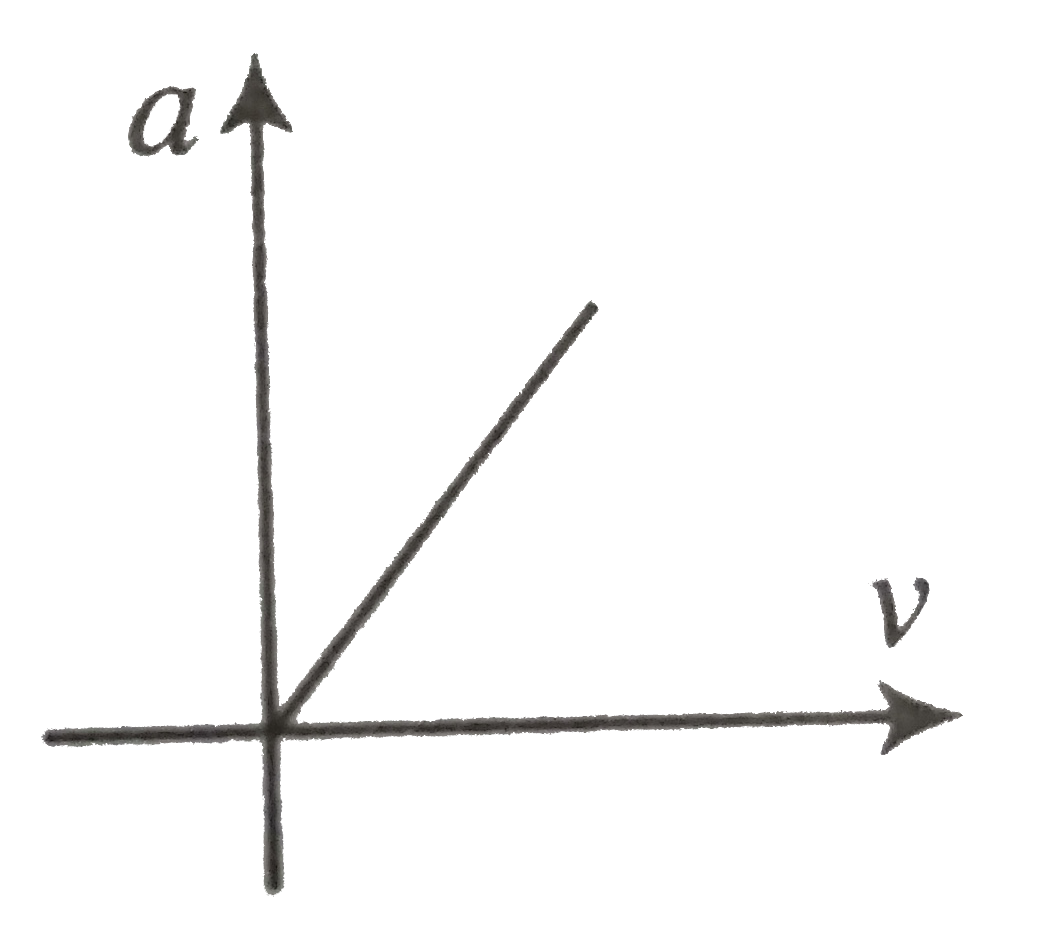
Acceleration - velocity graph of a particle moving in a straight line is as shown in figure. Then slope of velocity displacement graph :

A
increases linearly
B
decreases linearly
C
in constant
D
increases parabolically
Text Solution
The correct Answer is:C
a = kv (from graph)
vdvdx=kv
dvdx=k= const.
|
Topper's Solved these Questions
- TEST PAPERSBOOK - BANSALCHAPTER - TEST PAPERSEXERCISE - PHYSICS PART (A)
32 Videos
- TEST PAPERSBOOK - BANSALCHAPTER - TEST PAPERSEXERCISE - PHYSICS PART (B)
3 Videos
- TEST PAPERSBOOK - BANSALCHAPTER - TEST PAPERSEXERCISE - PHYSICS PART- C
4 Videos
- SEMICONDUCTORSBOOK - BANSALCHAPTER - SEMICONDUCTORSEXERCISE - CBSE Question
32 Videos
Similar Questions
Knowledge Check
Acceleration-velocity graph of a particle moving in a straight line is as shown in the figure. Then slope of velocity-displacement graph
 Aincreases linearlyBdecrease linearlyCis constantDincreases parabolically
The acceleration - velocity graph of a particle moving in a straight line is shown in figure. Then the slope of the velocity- displacement graph
 Aincreases linearlyBdecreases linearlyCis constantDincreases parabolically
Displacement time graph of a particle moving in a straight line is a shown in figure.
 Ain region A acceleration is positiveBin region B acceleration is negativeCin region C acceleration is positiveDin region D acceleration is negative
Velocity displacement graph of a particle moving in a straight line is as shown in figure.

View Solution
The velocity displacement graph of a particle moving along a straight line is shown in figure.
Then the acceleration displacement graph is.
View SolutionVelocity displacement graph of a particle moving in a straight line is as shown in figure.

View SolutionThe velocity-time graph of a body moving in a straight line is shown in the figure.

View Solution
The velocity displacement graph of a particle moving along a straight line is shown in figure.
Then the acceleration displacement graph is.
View Solution
