The graph between E and v is
A

B

C

D

Video Solution
Text Solution
The correct Answer is:A
Kinetic energy E=12mv2⇒E∝v2
graph will be parabola symmetric to E-axis.
|
Updated on:21/07/2023
Topper's Solved these Questions
- BOOK - ERRORLESS CHAPTER - WORK , ENERGY , POWER AND COLLISIONEXERCISE - Assertion & Reason For AIIMS Aspirants30videos
WORK , ENERGY , POWER AND COLLISION
- BOOK - ERRORLESS CHAPTER - WORK , ENERGY , POWER AND COLLISIONEXERCISE - Self Evaluation Test19videos
WORK , ENERGY , POWER AND COLLISION
- BOOK - ERRORLESS CHAPTER - WORK , ENERGY , POWER AND COLLISIONEXERCISE - Critical Thinking (Objective Questions)20videos
WORK , ENERGY , POWER AND COLLISION
- BOOK - ERRORLESS CHAPTER - WAVES AND SOUNDEXERCISE - SET25videos
WAVES AND SOUND
- BOOK - ERRORLESS CHAPTER - WORK, ENERGY, POWER & COLLISIONEXERCISE - Assertion30videos
WORK, ENERGY, POWER & COLLISION
Similar Questions
Knowledge Check
- Question 1 - Select One
The graph between E and v is
A B
B C
C D
D
- Question 2 - Select One
If p and E represent linear momentum and kinetic energy respectively, then the graph between E and pis correctly shown by
A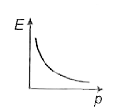 B
B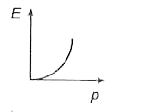 C
C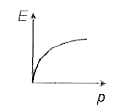 D
D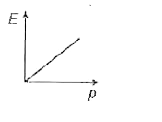
- Question 3 - Select One
Let B and E denote induction of magnetic field and energy density at mid-point of a long solenoid carrying a current i. The graph between E and B will be
A B
B C
C D
D
The graph between u and v for a convex mirrorr is
View SolutionUnder constant temperature, graph between P and 1/V is a
View SolutionWhat is the nature of the graph between K.E. and P.E. of a particle performing a finear S.H.M. ?
View SolutionIf the rate of emission of radiation by a body at temperature TK is E then graph between log E and log T will be .
View Solution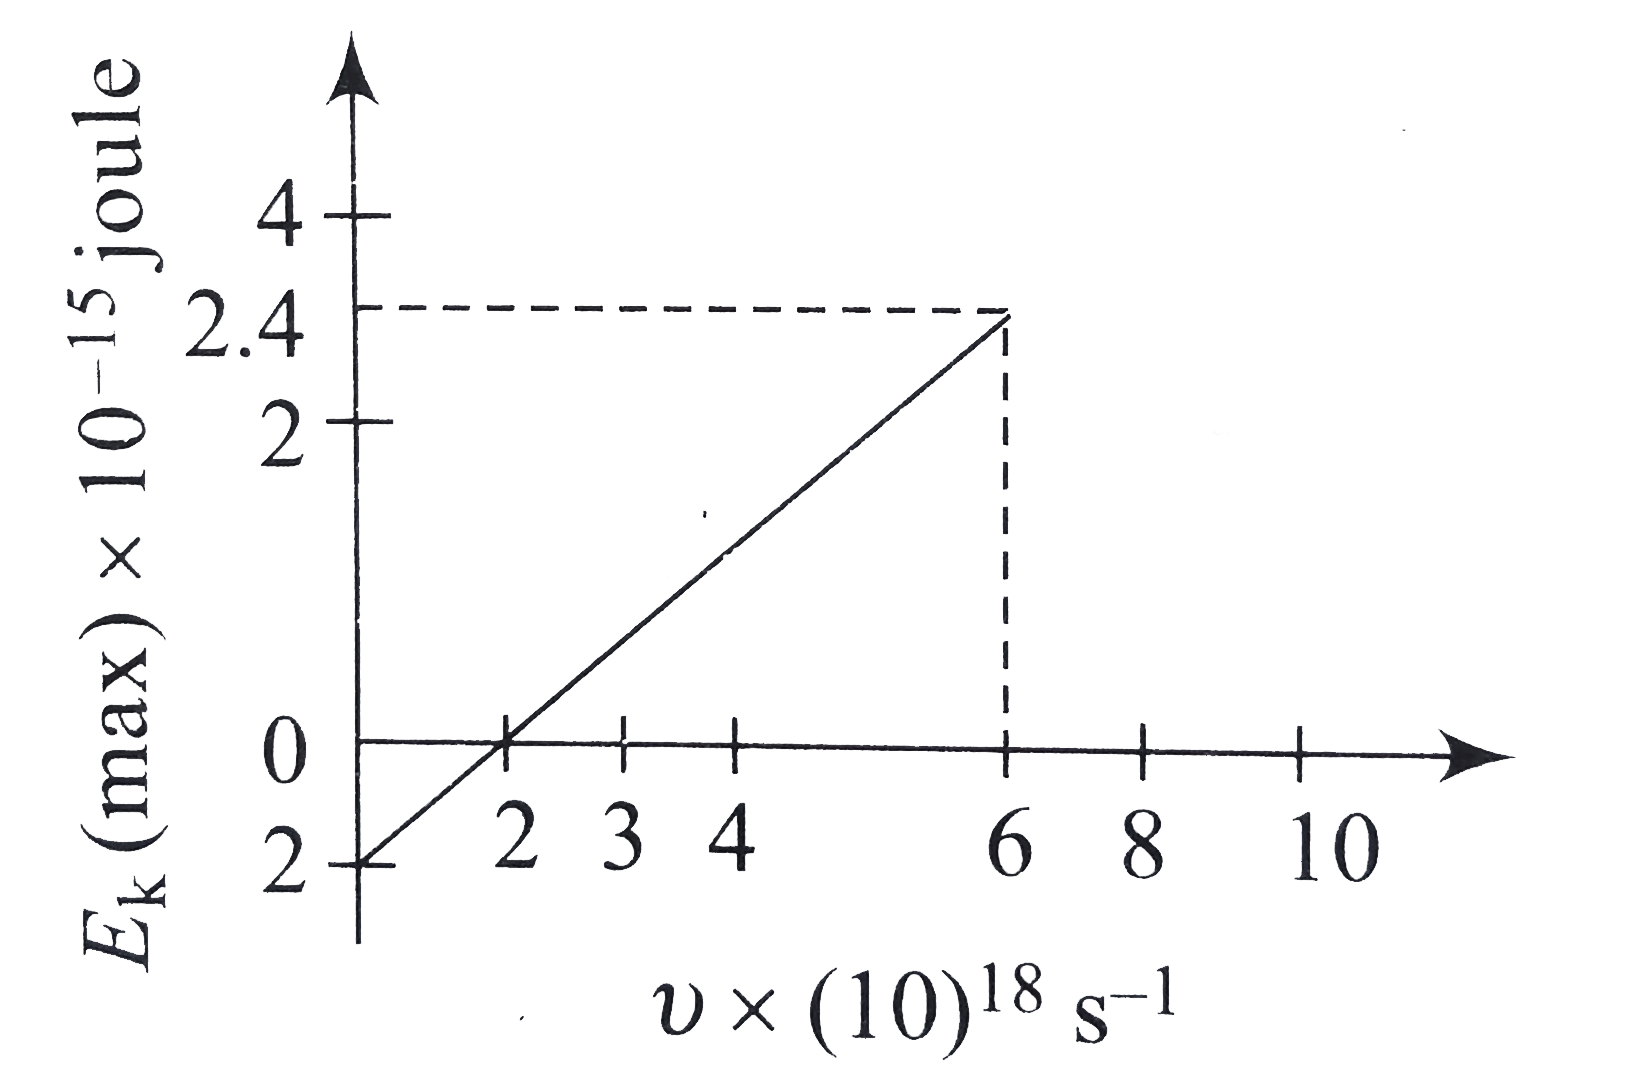
In the experiment on photoelectric effect, the graph between EK(max) and v is found to be a straight line as sshoen in fig. The threshold frequency and Planck's constant according to this graph areView Solution

