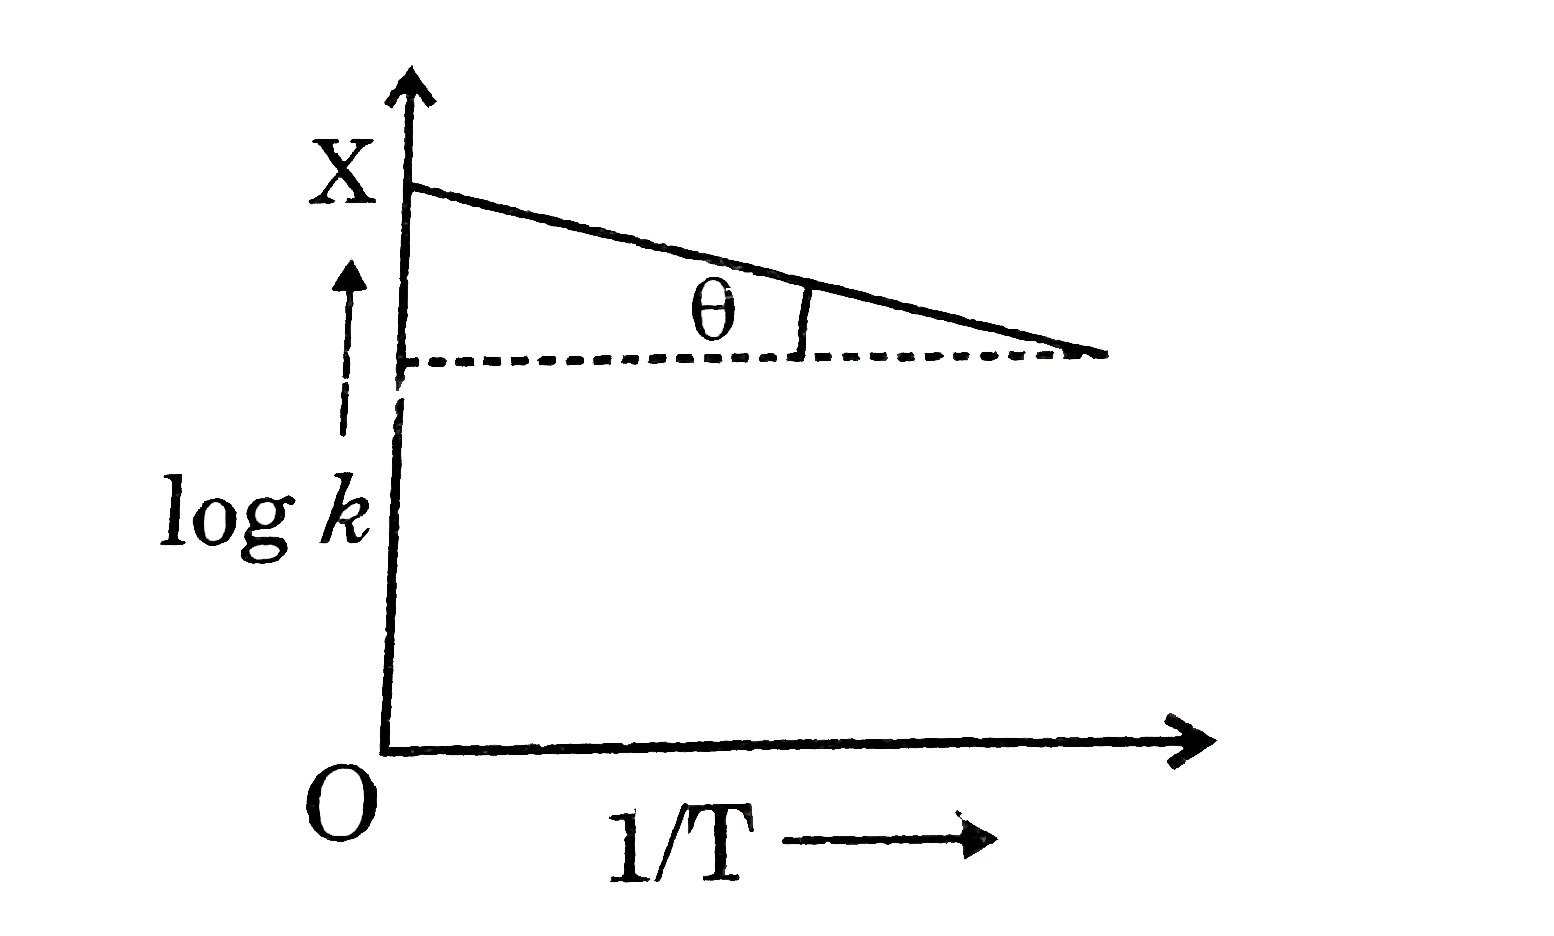
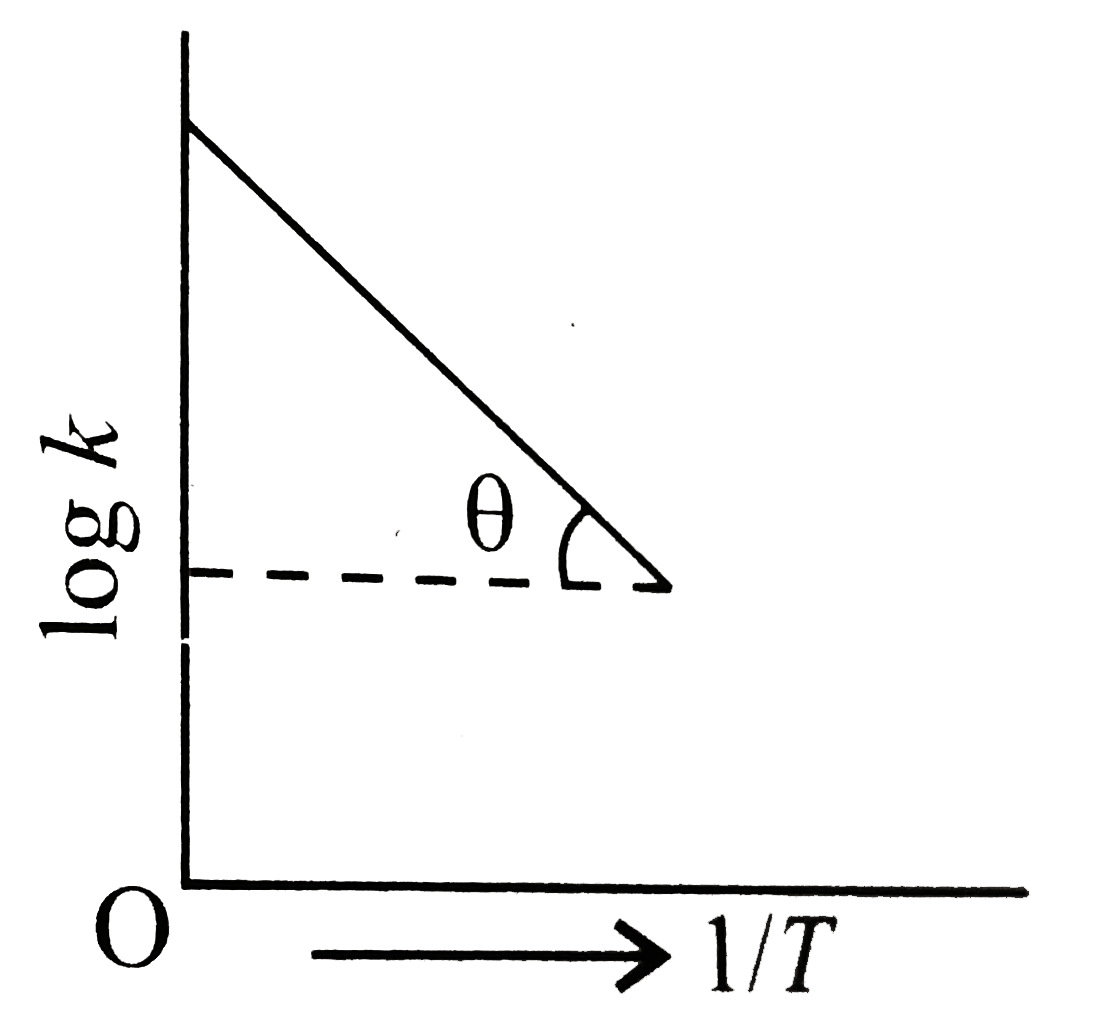
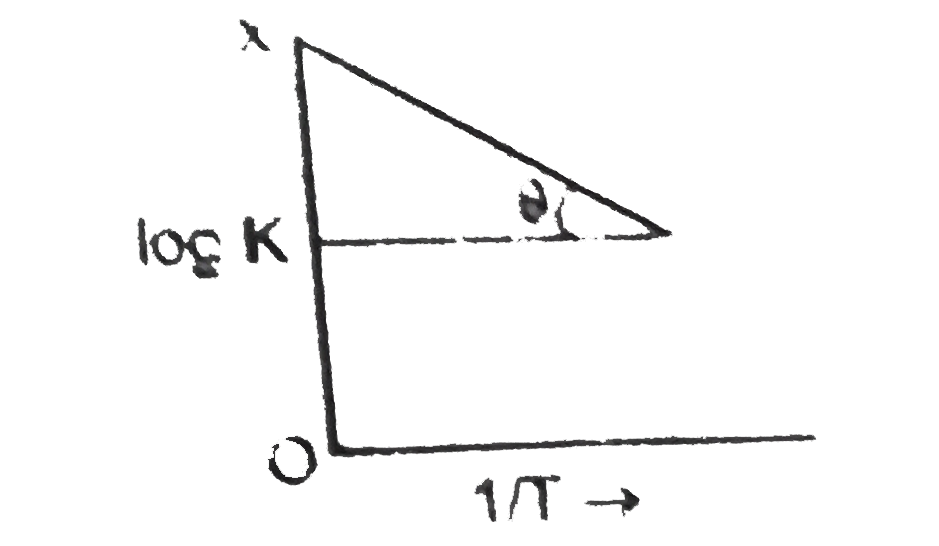
Graph between log k and 1T (k is rate constant in s−1 and T is the temperature in K) is a straight line. As shown in figure if OX = 5 and slope of the line =−12.303then Ea is :

2.303×2cal
22.303cal
2 cal
none of these
The correct Answer is:C
Step by step video, text & image solution for Graph between log k and (1)/(T) (k is rate constant in s^(-1) and T is the temperature in K) is a straight line. As shown in figure if OX = 5 and slope of the line =- (1)/(2.303)then E_(a) is : by Chemistry experts to help you in doubts & scoring excellent marks in Class 12 exams.
Topper's Solved these Questions
- BOOK - GRB PUBLICATIONCHAPTER - GRAPHICAL INTERPRETATIONEXERCISE - I.Electrochemistry1videos
GRAPHICAL INTERPRETATION
- BOOK - GRB PUBLICATIONCHAPTER - GRAPHICAL INTERPRETATIONEXERCISE - Electrochemistry9videos
GRAPHICAL INTERPRETATION
- BOOK - GRB PUBLICATIONCHAPTER - GRAPHICAL INTERPRETATIONEXERCISE - H. Chemical Kinetics1videos
GRAPHICAL INTERPRETATION
- BOOK - GRB PUBLICATIONCHAPTER - F-BLOCK ELEMENTSEXERCISE - Subjective type7videos
F-BLOCK ELEMENTS
- BOOK - GRB PUBLICATIONCHAPTER - HYDROCARBON (ALIPHATIC)EXERCISE - Previous years jee questions28videos
HYDROCARBON (ALIPHATIC)
Similar Questions
Knowledge Check
- Question 1 - Select One
Graph between log k and 1/T [where K is rate constant in s−1 and T is the temperature (in K) is a straight line with Hence, Ea will be
 A2.303×2 calB22.303calC2 calDNone of these
 - Question 2 - Select One
Graph between logk and 1/T [k rate constant (s−1) and T and the temperature (K)] is a straight line with OX=5,θ=tan−1(1/2.303). Hence −Ea will be
 A2.303×2 calB2/2.303 calC2 calDnone
 - Question 3 - Select One
Graph between logk and 1/T [k rate constant (s−1) and T and the temperature (K)] is a straight line with OX=5,θ=tan−1(1/2.303). Hence −Ea will be
 A2.303×2calB2/2.303calC2calDNone
A graph plotted between log k vs 1T is represented by
View SolutionThe graph between the log K versus 1T is a straight line. The slope of the line is
View SolutionIf we plot a graph between log K and 1T by Arrhenius equation , the slope is
View SolutionIf a graph is plotted between ln k and 1/T for the first order reaction, the slope of the straight line so obtained is given by
View SolutionFor a first order reaction, the plot of log k against 1/T is a straight line. The slope of the line is equal to
View Solution


