Draw a less than cumuative frequency curve (ogive) for the following distribution :

The cumulative frequecny table for the given distribution is :
 ltbr Taking upper class limits along X-axis and corresponding cumulative frequencies along Y-axis mark the points (10,7), (15,16), (20,28),(25,36) and (30,42). Join the points marked by a free hand curve (as shown in figure)
(#NTN_MATH_X_C14_S01_033_S02.png" width="80%">
Topper's Solved these Questions
- STATISTICS BOOK - NAGEEN PRAKASHANCHAPTER - STATISTICS EXERCISE - Problems From NCERT/exemplar
4 Videos
- STATISTICS BOOK - NAGEEN PRAKASHANCHAPTER - STATISTICS EXERCISE - Exercise 14 A
17 Videos
- SOME APPLICATIONS OF TRIGONOMETRYBOOK - NAGEEN PRAKASHANCHAPTER - SOME APPLICATIONS OF TRIGONOMETRYEXERCISE - Long Answer Questions
5 Videos
- TRIANGLES BOOK - NAGEEN PRAKASHANCHAPTER - TRIANGLES EXERCISE - Revision Exercise Long Questions
4 Videos
Similar Questions
Draw a cumulative frequency curve (ogive) for the following distribution
Mark 5−1010−1515−2020−2525−30 no. of students 7 9 12 8 6
View SolutionDraw a cumulative frequency curve (ogive) for each of the following distributions :
Class interval 10−1920−2930−3940−4950−59Frequency 23 16 15 20 12
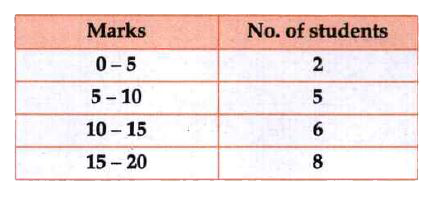
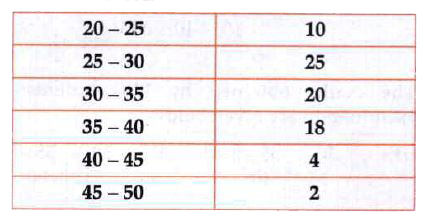
View SolutionThe marks obtained by 100 students of class is an examination are given below:


Draw 'a less than' type cumulative frequency curves (ogive). Hence, find median.
View SolutionDraw an OGIVE and the cumulative frequency polygon for the following frequency distribution by less than method
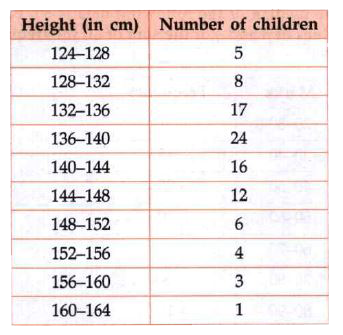
View SolutionThe distribution of heights (in cm) of 96 children is given below:
Draw a less than type cumulative frequency curve for this data and use it to compute median height of the children.

View SolutionDraw a 'less than' ogive for the following frequency distribution:
View SolutionDraw a less than cumulative curve (ogive to represent the data.

Also, find the mdian with the help of less than ogive.
View SolutionDraw 'less than' as well as 'more than' ogives for the following data :

View SolutionDraw a less than ogive for the following frequency distribution.
View SolutionDraw a 'less than' give for the following frequency distribution :

View Solution
