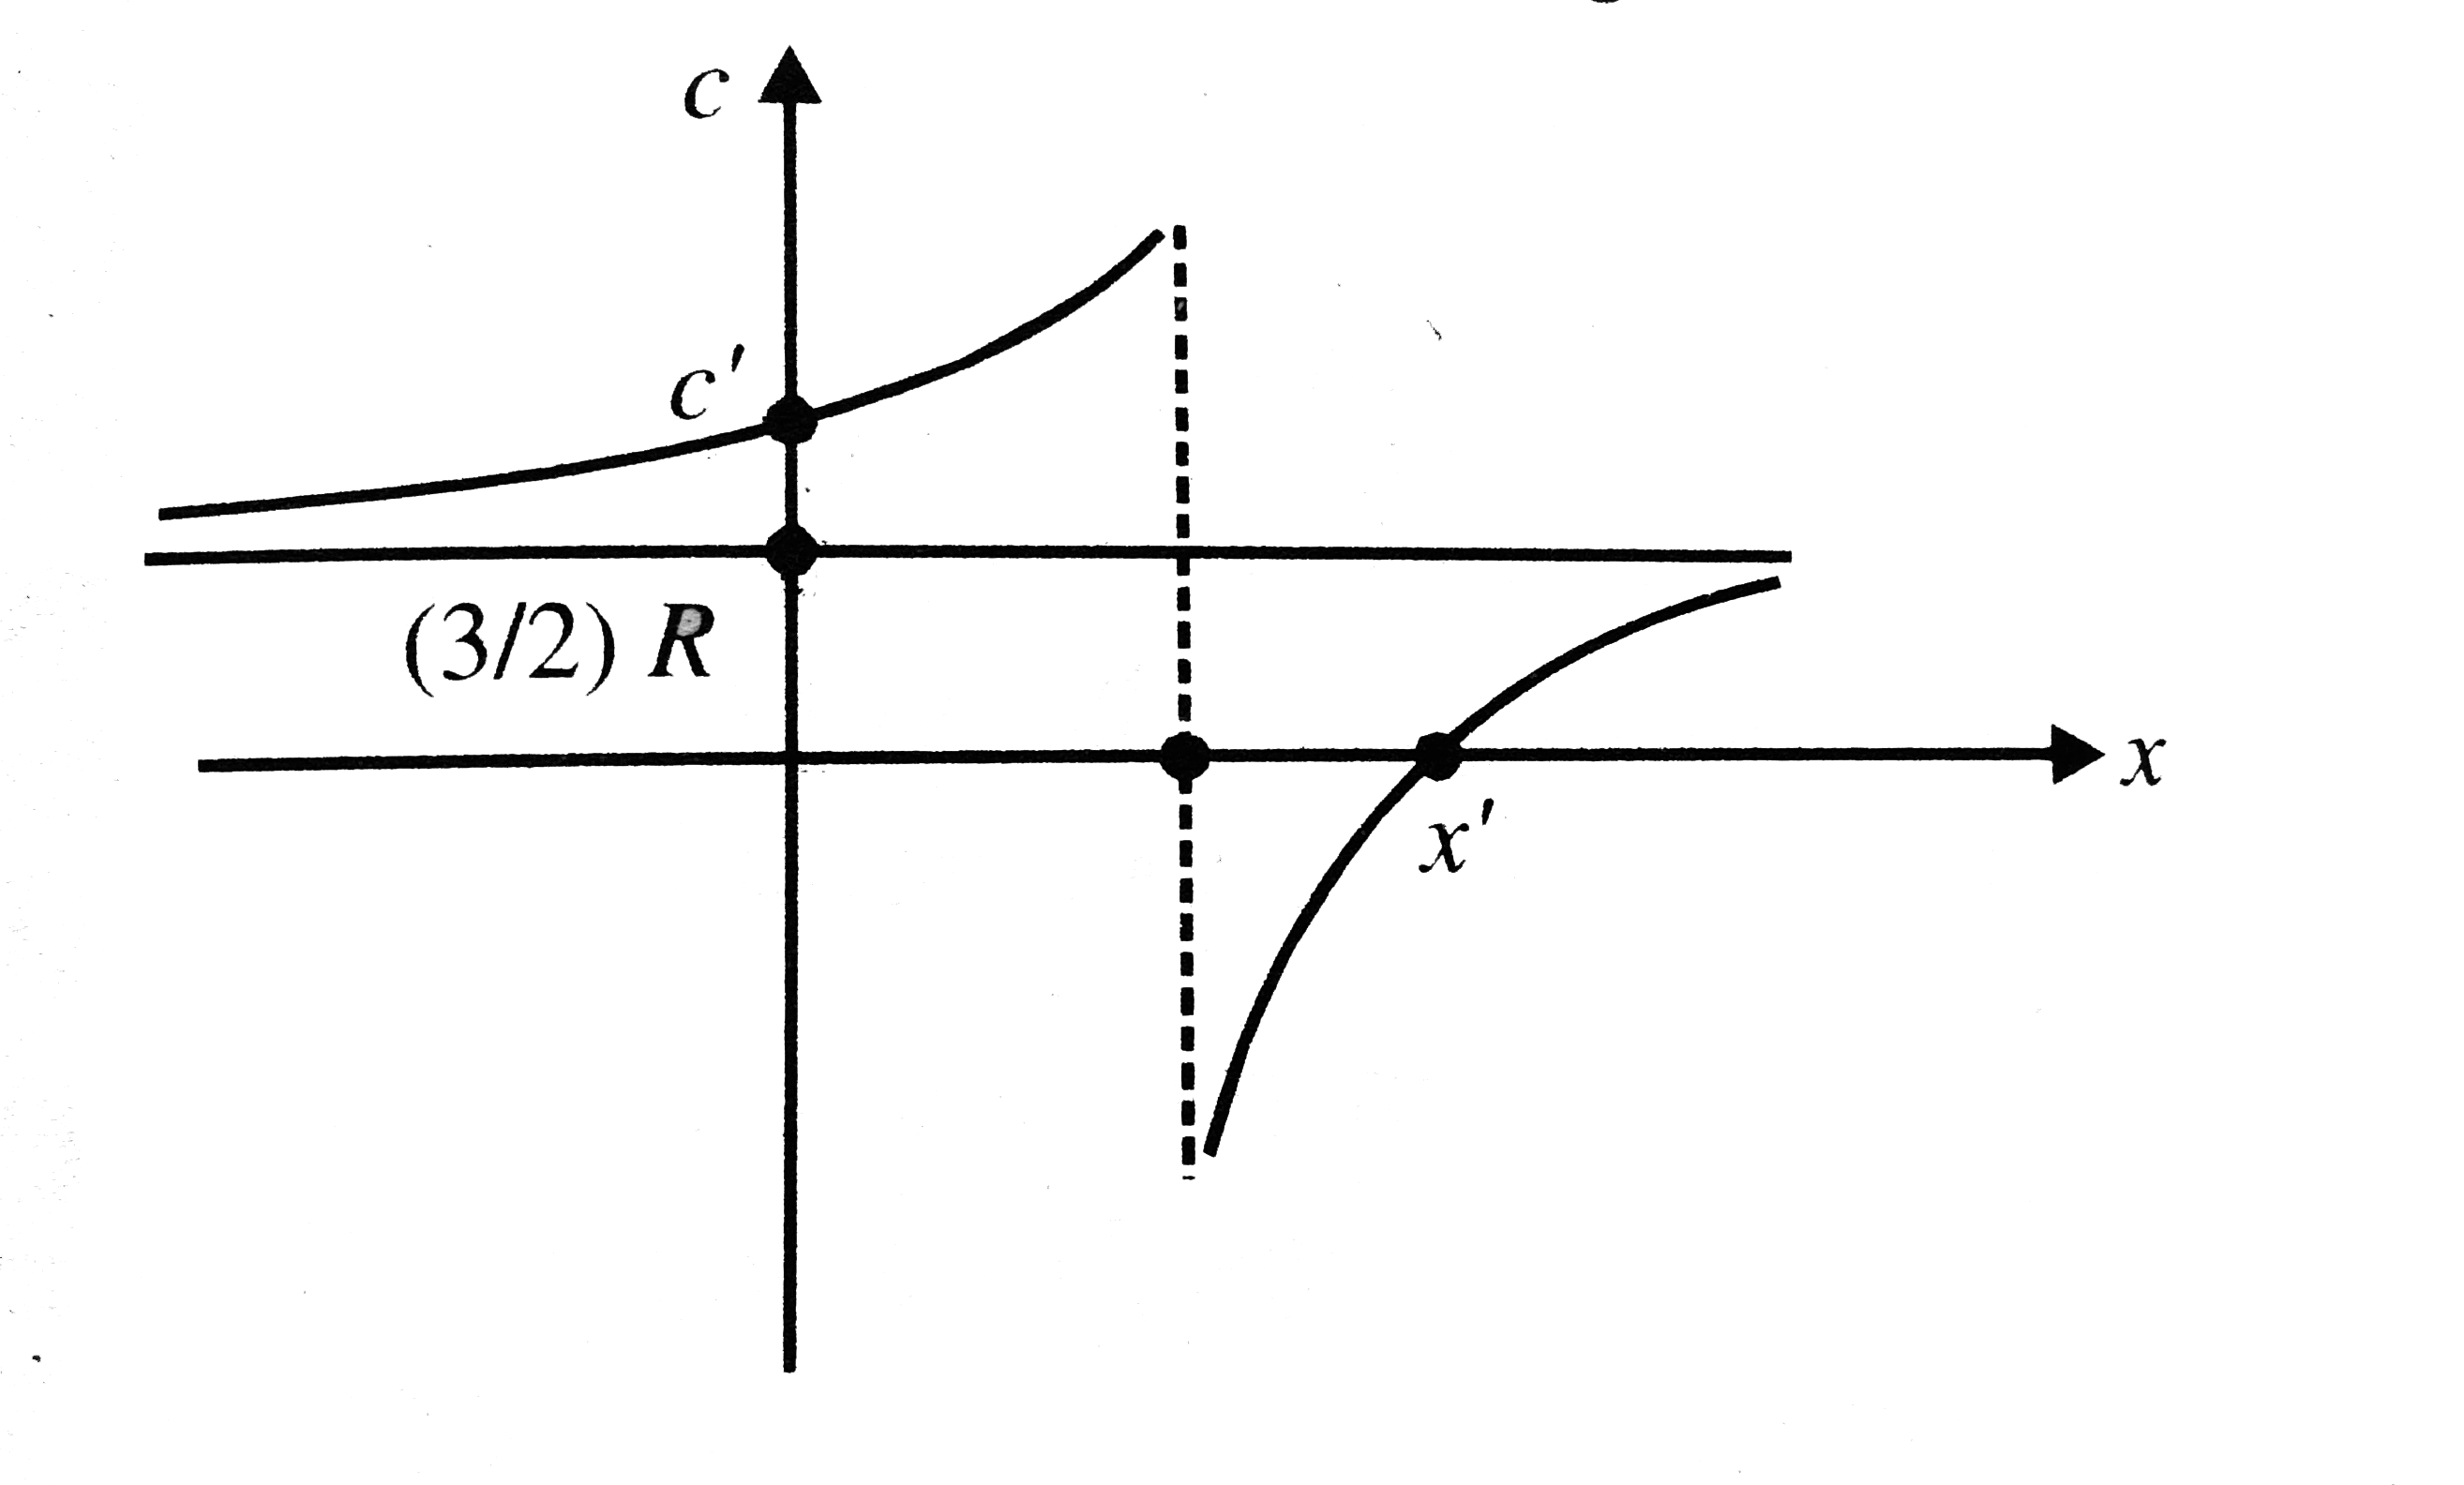
One mole of an ideal gas is taken along the process in which PV'= constant. The graph shown represents the variation of molar heat capacity of such a gas with respect to x. The value of c' and x'c respectively, are given by

52R,52
52R,53
72R,72
52R,75
The correct Answer is:B
Step by step video & image solution for One mole of an ideal gas is taken along the process in which PV' = constant. The graph shown represents the variation of molar heat capacity of such a gas with respect to x. The value of c' and x'c respectively, are given by by Physics experts to help you in doubts & scoring excellent marks in Class 12 exams.
Updated on:21/07/2023Topper's Solved these Questions
Similar Questions
Knowledge Check
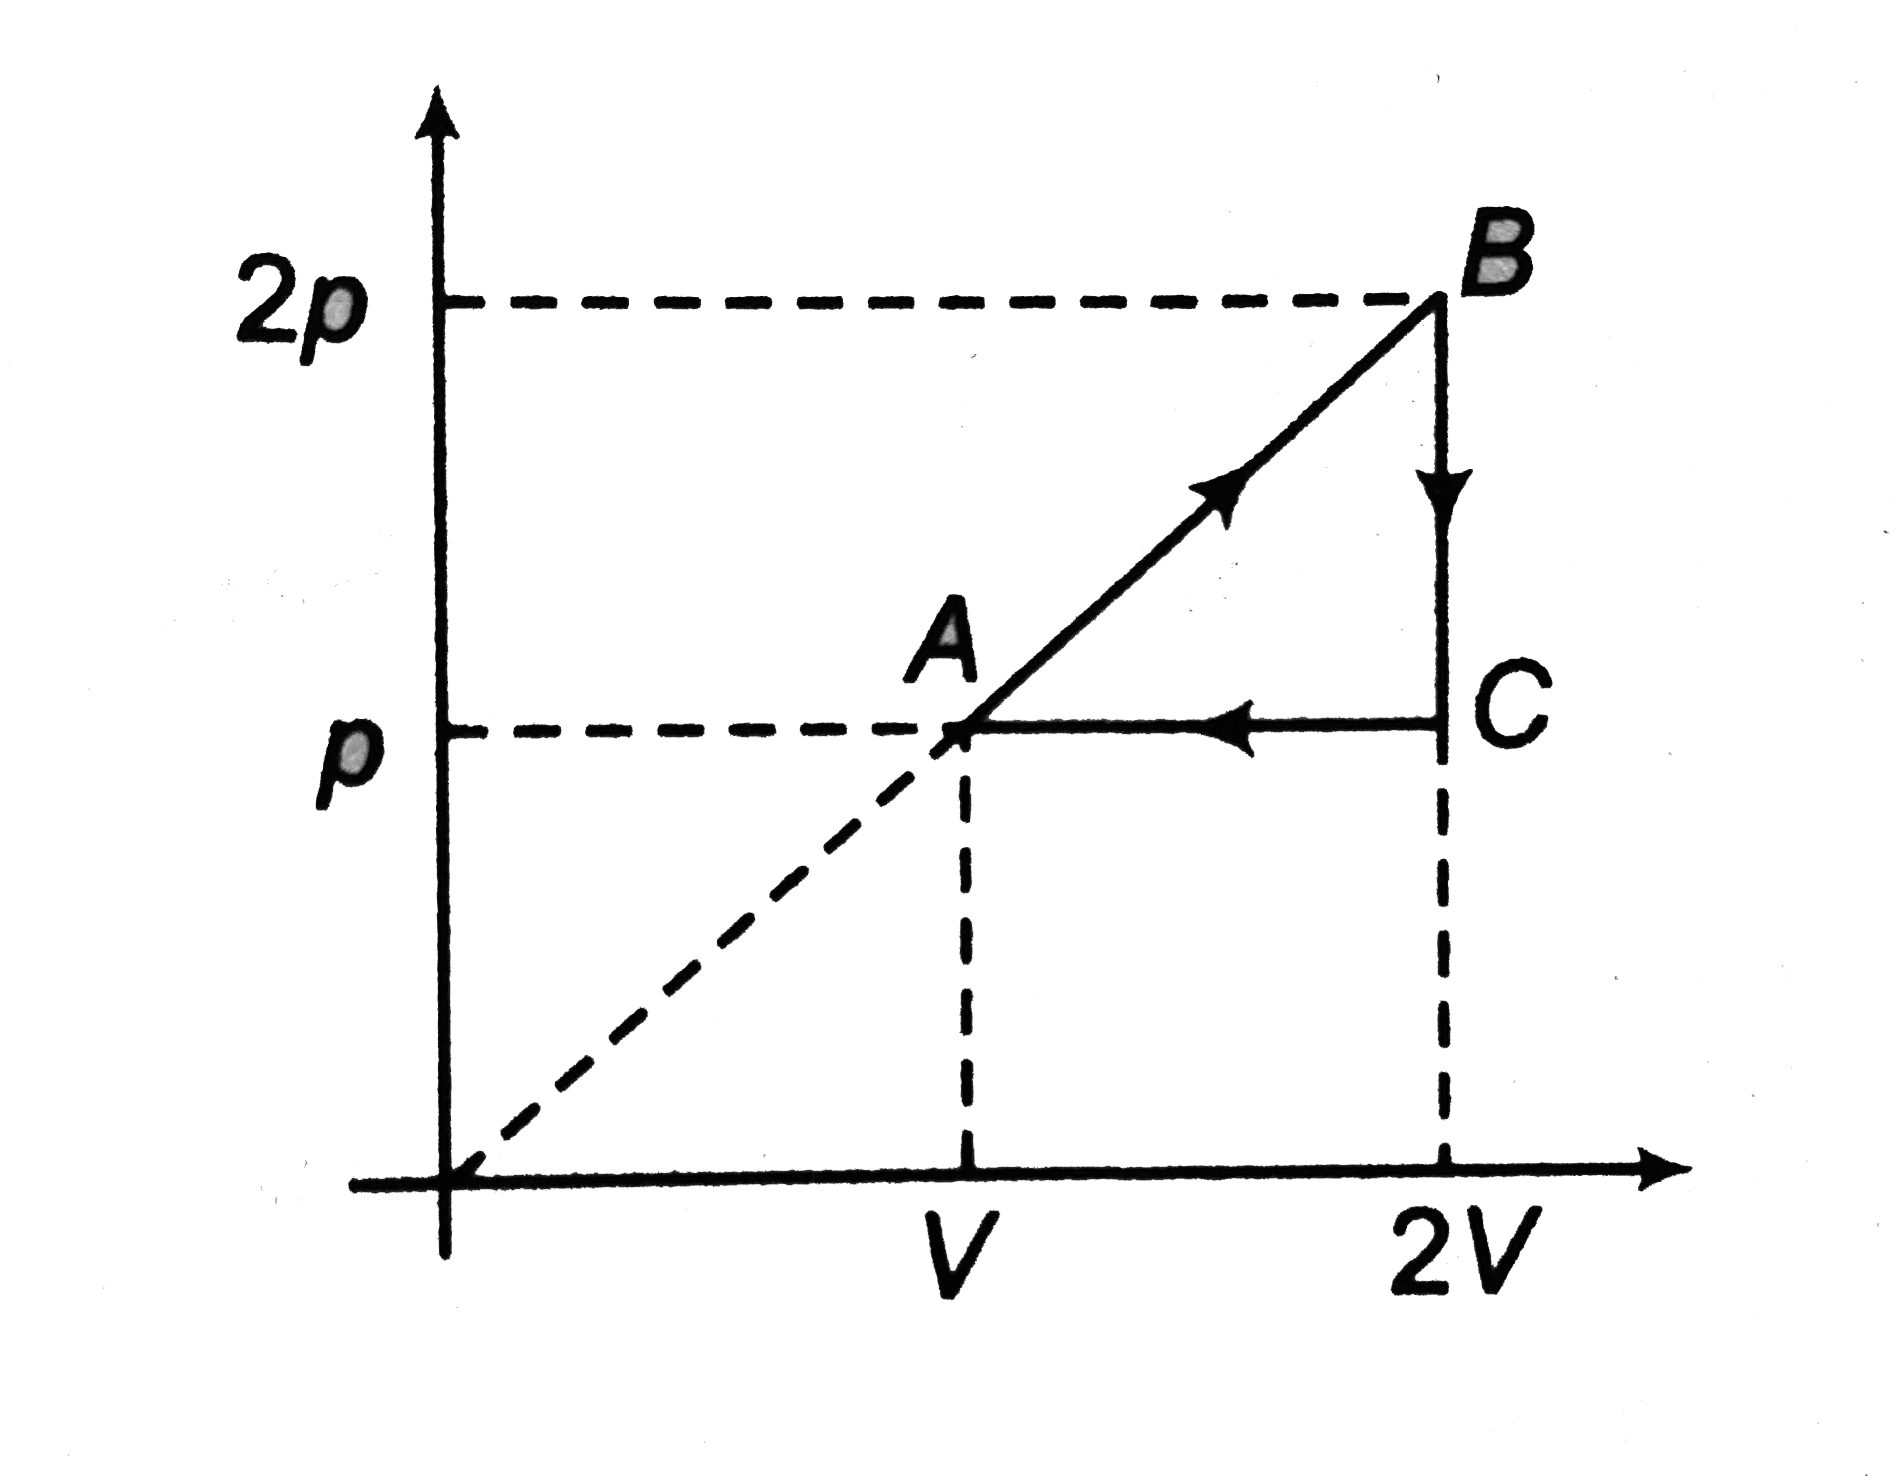
One mole of a monatomic ideal gas is taken along the cycle ABCA as shown in the diagram.

The ratio of specific heat in the process CA to the specific heat in the process BC isA2B53C(c) 4D(d) None of theseA monoatomic ideal gas undergoes a process in which the ratio of P to V at any istant is constant and equal to unity. The molar heat capacity of the gas is
A5R2B3R2C4R2DZeroA monoatomic ideal gas undergoes a process in which the ratio of P to V at any instant is constant and equal to unity. The molar heat capacity of gas is:
A1.5RB2.0 RC2.5 RD0
One mole of a diatomic gas is taken through the process P/T^(n)=C,where n and C are constant.If the heat capacity of gas is C=-R/2, then value of n is
View SolutionAn ideal monoatomic gas is taken through a process PVa = const. The value of 'a' for whichspecific heat capacity of the gas is zero is :-
View SolutionAn ideal gas is taken through a process in which pressure and volume vary as P=kV2. Show that the molar heat capacity of the gas for the process is given by C=Cv+R3.
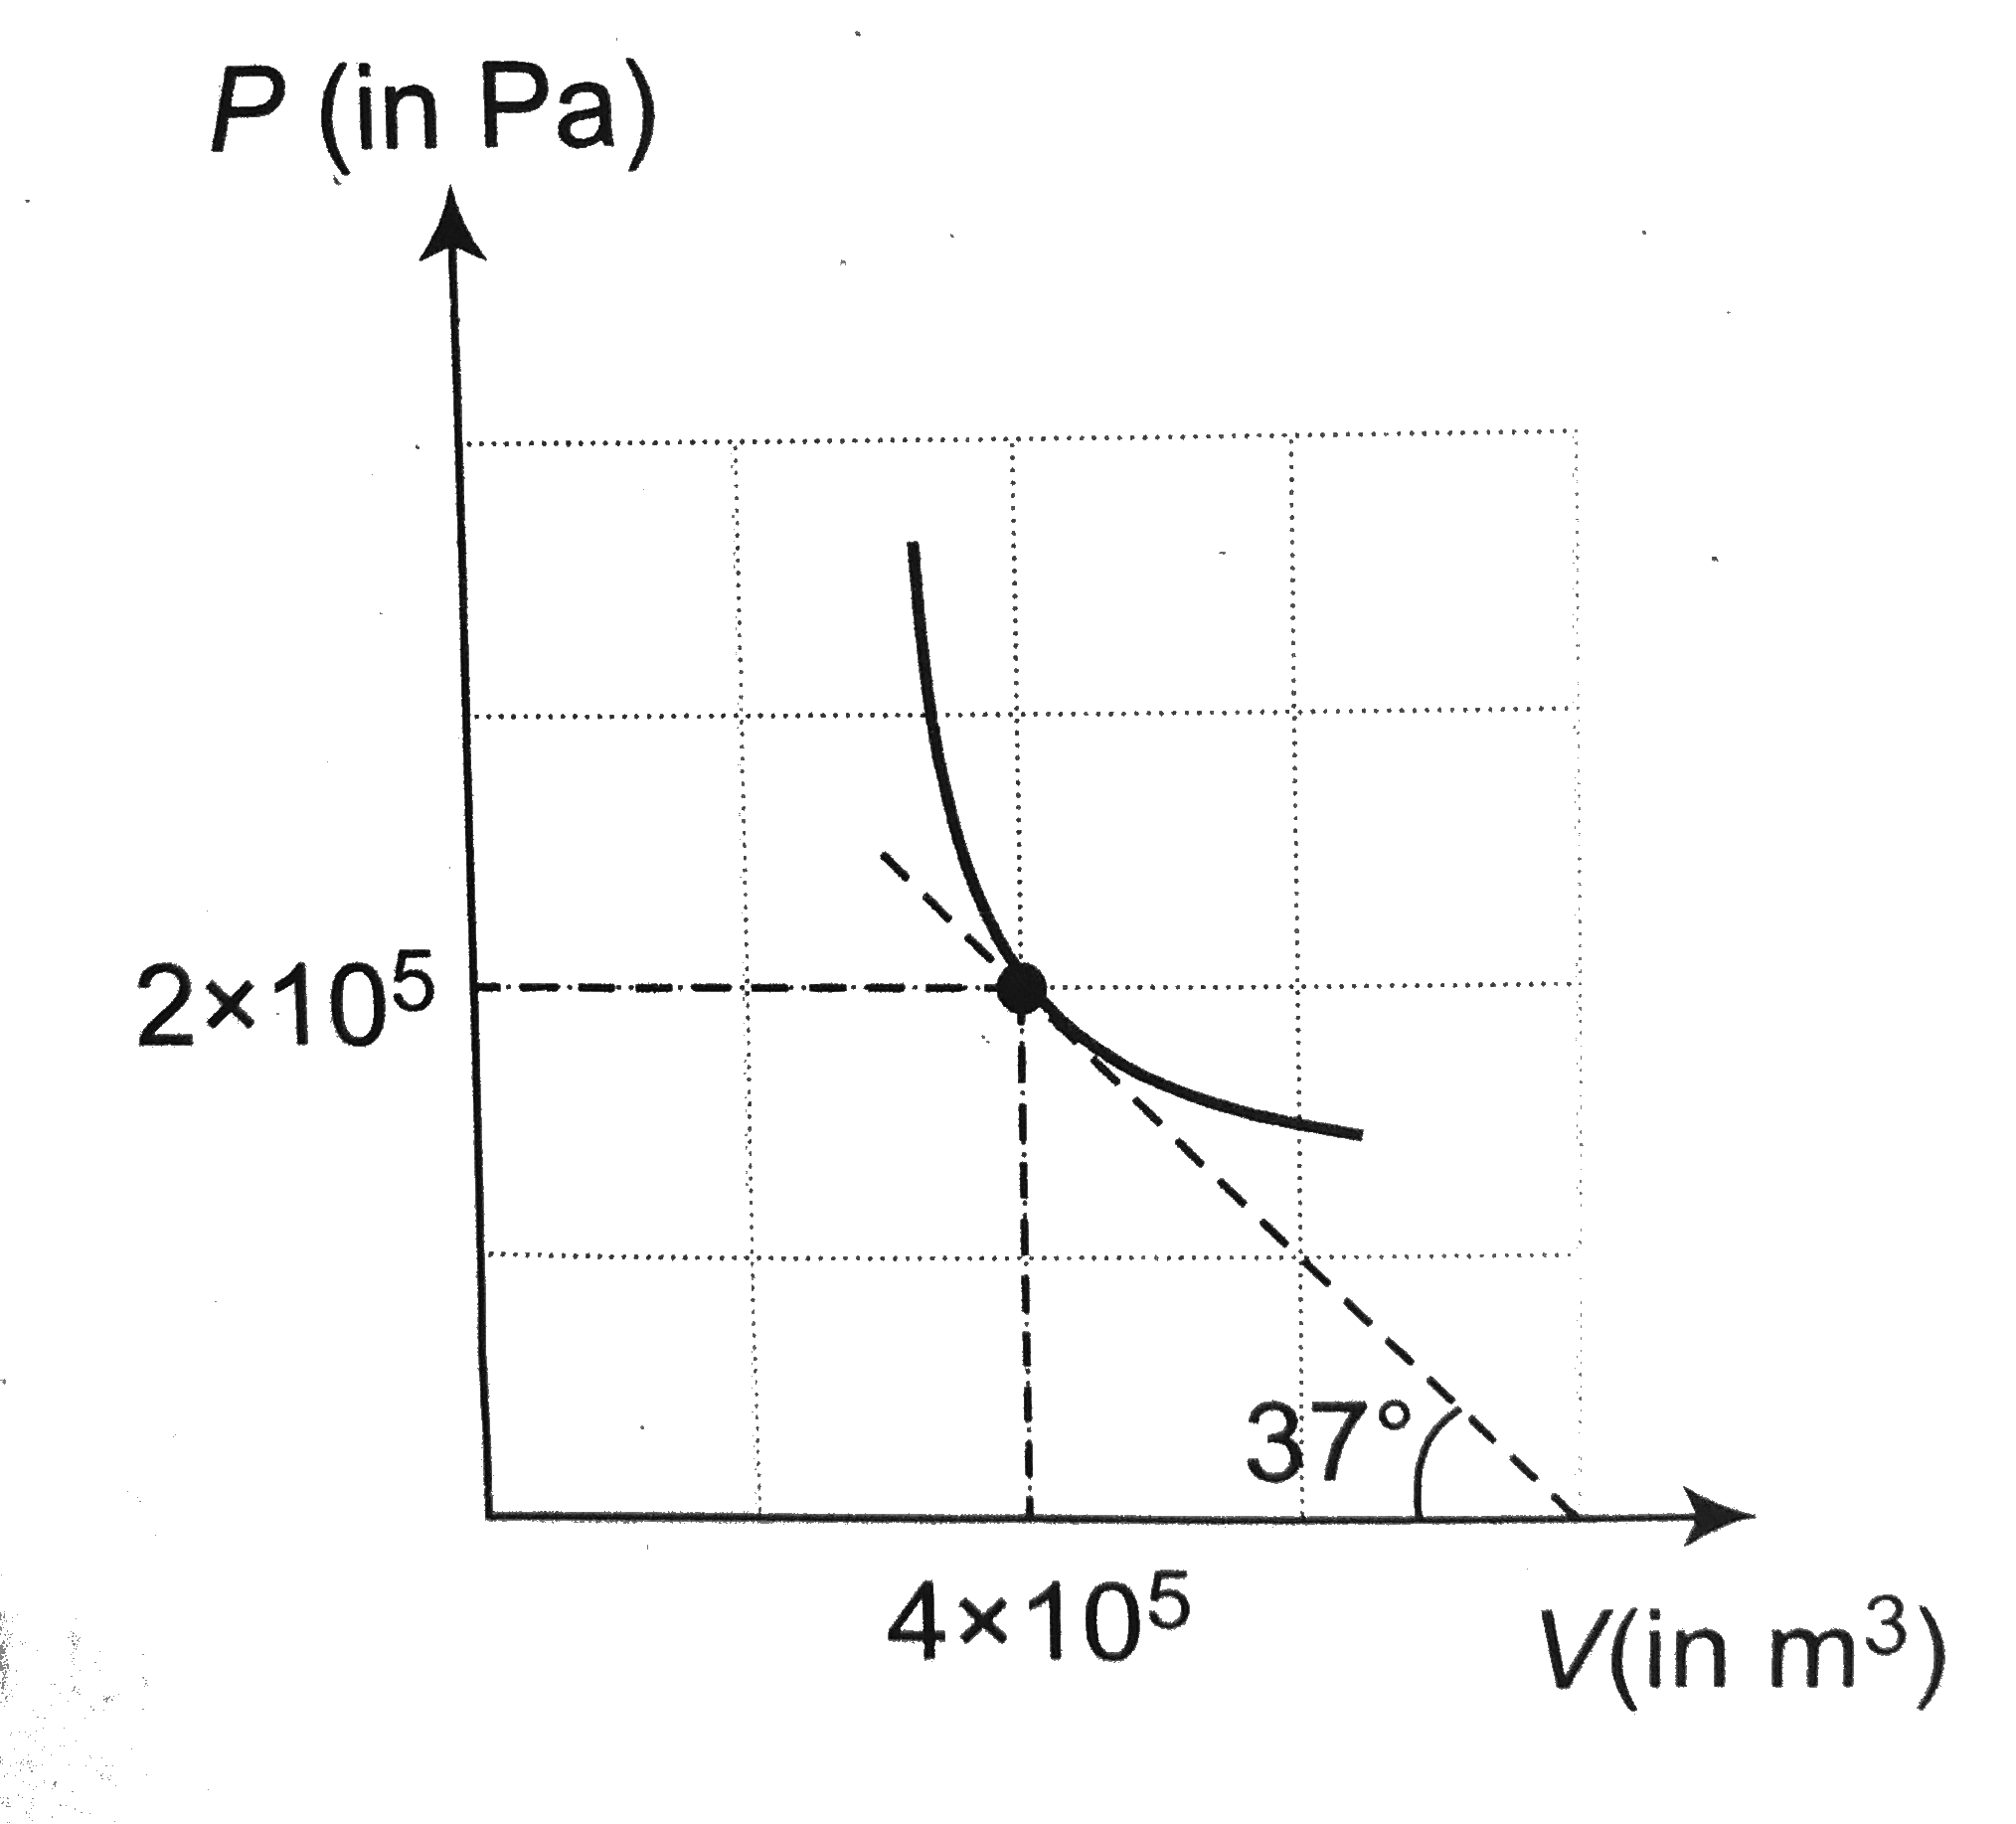
View SolutionP-V graph for an ideal gas undergoing polytropic process PVm=constant is shown here. Find the value of m.

View SolutionOne mole of a monatomic ideal gas is taken along the cycle ABCA as shown in the diagram.

The net heat absorbed by the gas in the given cycle is
View Solution
