Which of the following graphs show most significant deviation from ideal gas behaviour ?
The correct Answer is:D
To determine which graph shows the most significant deviation from ideal gas behavior, we need to analyze the behavior of gases under different conditions and how they relate to the ideal gas law, which is represented by the equation PV = nRT.
1. Understanding Ideal Gas Behavior:
- The ideal gas law states that for a given amount of gas at a constant temperature, the pressure (P) multiplied by the volume (V) is equal to the number of moles (n) multiplied by the universal gas constant (R) and the temperature (T).
- Ideal gases follow specific relationships between pressure, volume, and temperature.
2. Analyzing the Graphs:
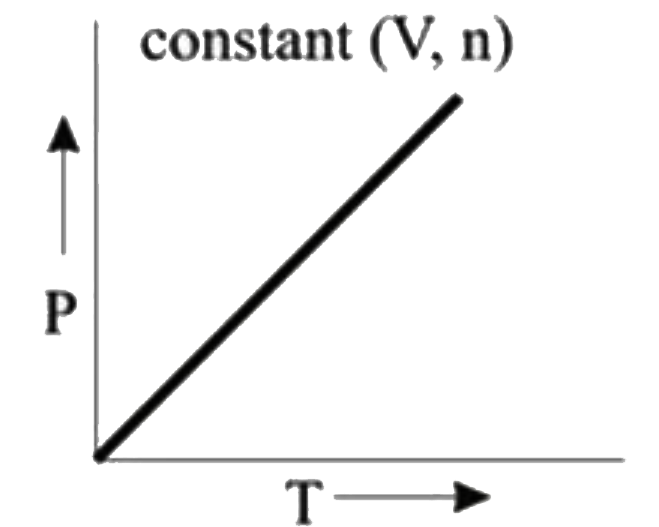
- Graph 1 (Constant V and N): Here, if volume (V) and number of moles (N) are constant, then pressure (P) is directly proportional to temperature (T). This graph will be a straight line, indicating ideal behavior.
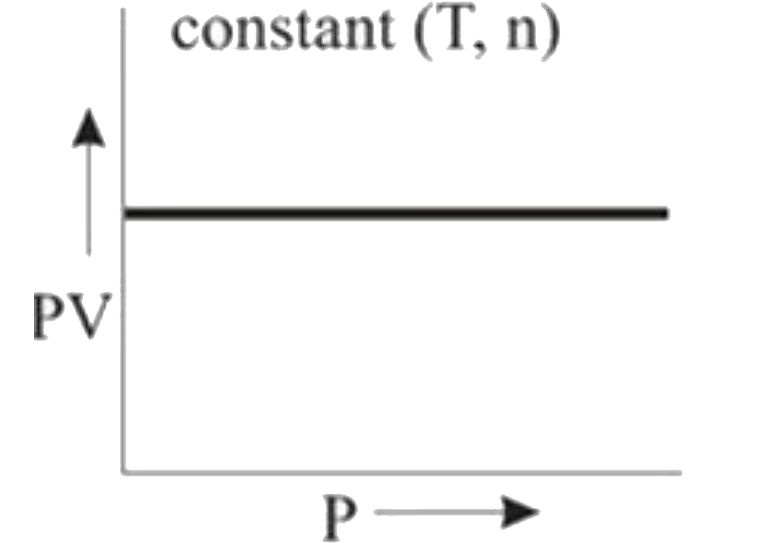
- Graph 2 (Constant T and N): In this case, if temperature (T) and number of moles (N) are constant, then PV is constant. The graph of PV versus V will also show ideal behavior.
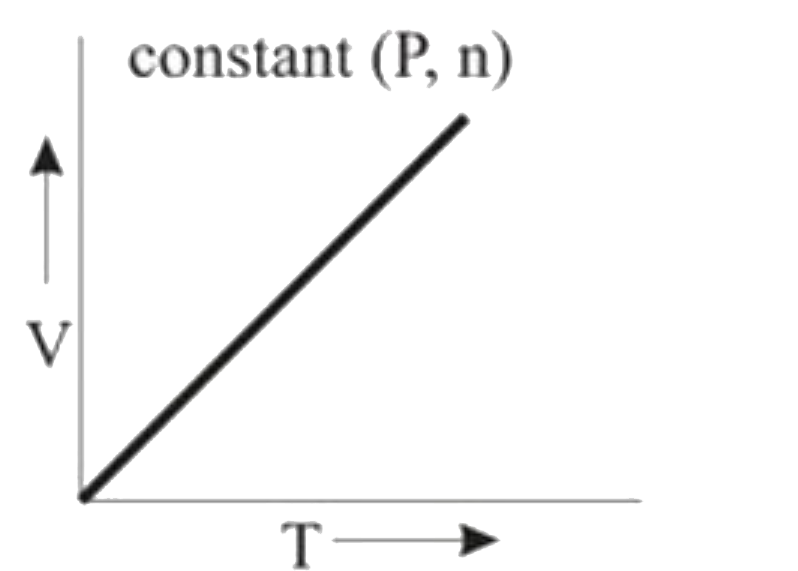
- Graph 3 (Constant P and N): For constant pressure (P) and number of moles (N), volume (V) is directly proportional to temperature (T). This will also yield a straight line, indicating ideal behavior.
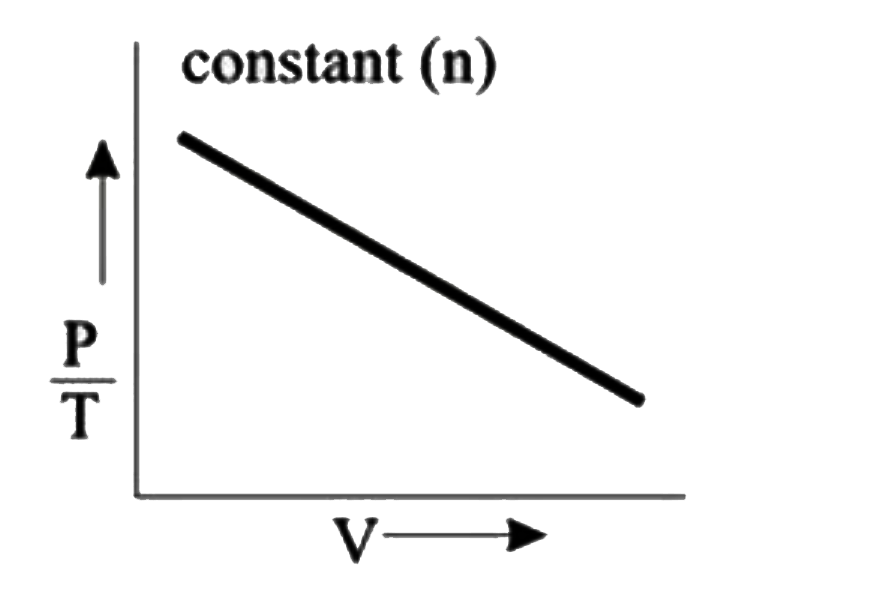
- Graph 4 (P/T vs V): When we analyze P/T versus V at constant n, we derive that P/T is proportional to 1/V. If plotted, this should yield a hyperbolic curve for an ideal gas. However, if the graph shows a straight line instead, it indicates a deviation from ideal behavior.
3. Identifying the Most Significant Deviation:
- Among the graphs analyzed, the fourth graph (P/T vs V) showing a straight line instead of a hyperbolic curve indicates a significant deviation from ideal gas behavior. This is because real gases do not always follow the ideal gas law, especially under high pressure or low temperature conditions.
Conclusion:
The graph that shows the most significant deviation from ideal gas behavior is the one representing P/T versus V, which appears as a straight line instead of the expected hyperbolic curve.
---
- The ideal gas law states that for a given amount of gas at a constant temperature, the pressure (P) multiplied by the volume (V) is equal to the number of moles (n) multiplied by the universal gas constant (R) and the temperature (T).
- Ideal gases follow specific relationships between pressure, volume, and temperature.
- Graph 1 (Constant V and N): Here, if volume (V) and number of moles (N) are constant, then pressure (P) is directly proportional to temperature (T). This graph will be a straight line, indicating ideal behavior.
- Graph 2 (Constant T and N): In this case, if temperature (T) and number of moles (N) are constant, then PV is constant. The graph of PV versus V will also show ideal behavior.
- Graph 3 (Constant P and N): For constant pressure (P) and number of moles (N), volume (V) is directly proportional to temperature (T). This will also yield a straight line, indicating ideal behavior.
- Graph 4 (P/T vs V): When we analyze P/T versus V at constant n, we derive that P/T is proportional to 1/V. If plotted, this should yield a hyperbolic curve for an ideal gas. However, if the graph shows a straight line instead, it indicates a deviation from ideal behavior.
- Among the graphs analyzed, the fourth graph (P/T vs V) showing a straight line instead of a hyperbolic curve indicates a significant deviation from ideal gas behavior. This is because real gases do not always follow the ideal gas law, especially under high pressure or low temperature conditions.
The graph that shows the most significant deviation from ideal gas behavior is the one representing P/T versus V, which appears as a straight line instead of the expected hyperbolic curve.
Topper's Solved these Questions
Similar Questions
Knowledge Check
Which of the following graphs shows most significant deviation from ideal gas behavior
A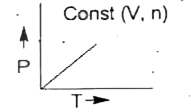 B
B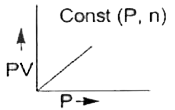 C
C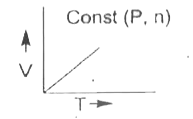 D
D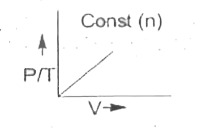
Solution among the following is/are showing singnificant deviation from ideal behaviour :
AC6H6+C6H5CHBC2H5OH+H2OCCHCl3+CH3COCH3DC5H5N+H2OWhich of the following gases always show positive deviation from ideal behaviour with increase in pressure ?
ANH3BCO2CH2DCO
Deviation From Ideal Behaviour
View SolutionAny gas shows maximum deviation from ideal gas behaviour at
View SolutionWhich of the following graphs is inconsistent with ideal gas behaviour ? (Assume n = constant)
View SolutionWhich of the following graphs is not a straight line for an ideal gas ?
View SolutionFor a gas deviation from ideal behaviour is maximum at :
View Solution
