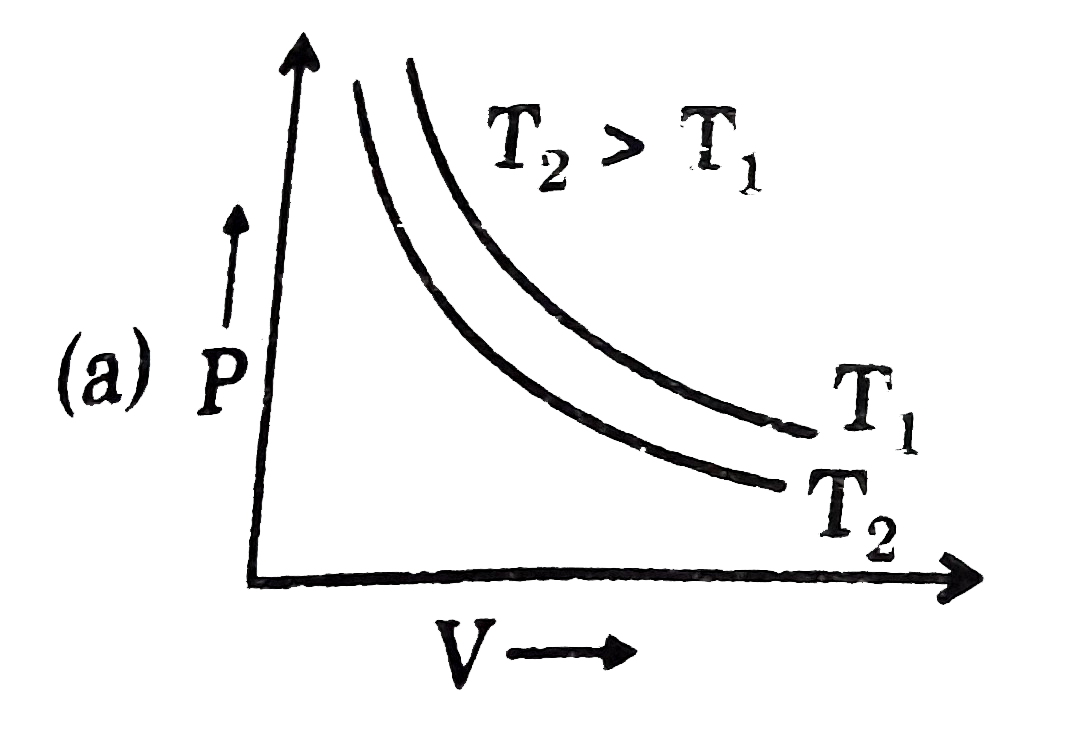
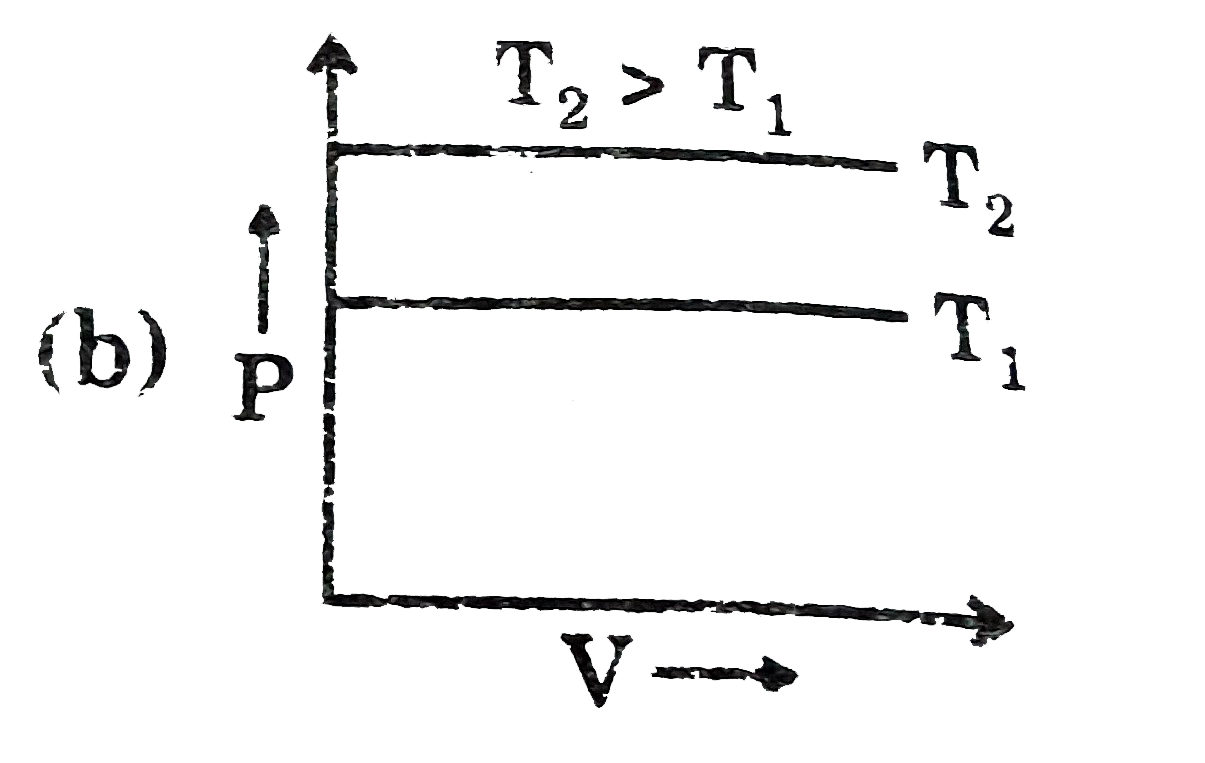
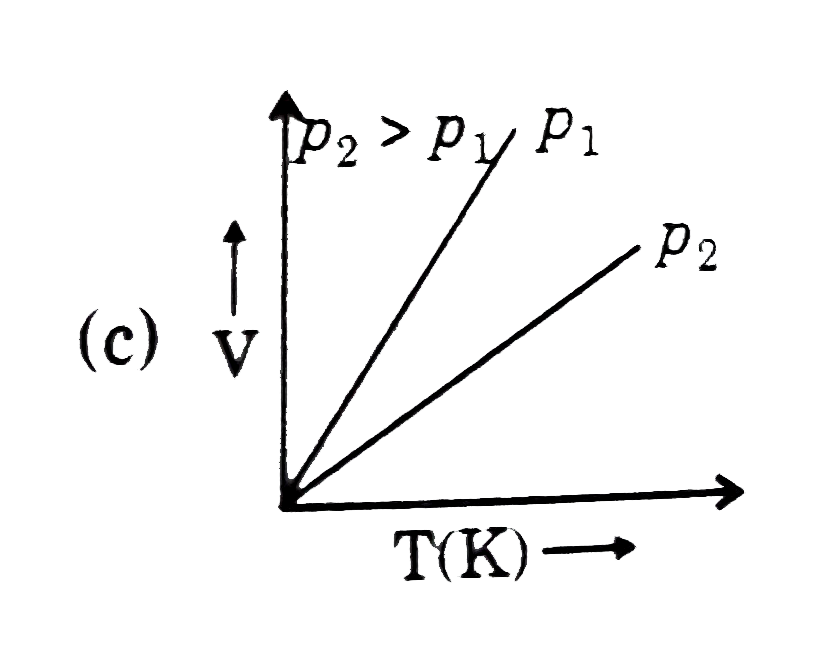
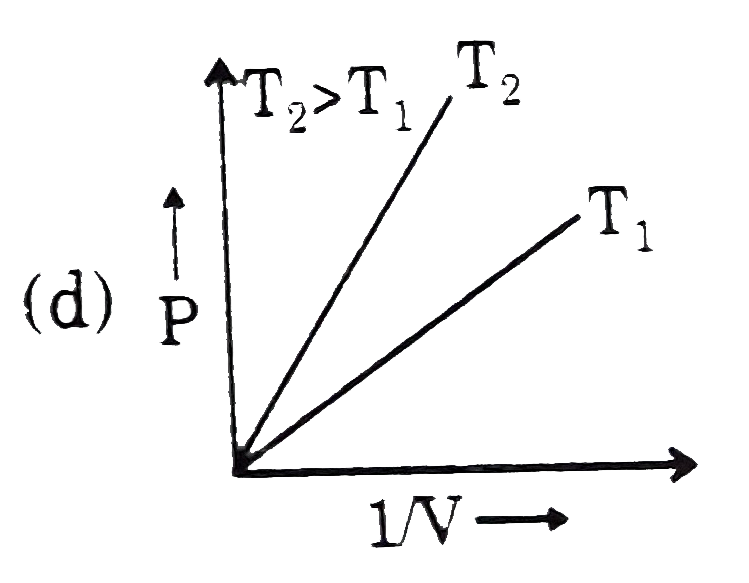
Which of the following graphs is inconsistent with ideal gas behaviour ? (Assume n = constant)
A
B
C
D
Video Solution
Text Solution
The correct Answer is:A
|
Answer
Step by step video, text & image solution for Which of the following graphs is inconsistent with ideal gas behaviour ? (Assume n = constant) by Chemistry experts to help you in doubts & scoring excellent marks in Class 12 exams.
Updated on:21/07/2023
Topper's Solved these Questions
- BOOK - GRB PUBLICATIONCHAPTER - GRAPHICAL INTERPRETATIONEXERCISE - C. Atomic Sturcture1videos
GRAPHICAL INTERPRETATION
- BOOK - GRB PUBLICATIONCHAPTER - GRAPHICAL INTERPRETATIONEXERCISE - Atomic Sturcture9videos
GRAPHICAL INTERPRETATION
- BOOK - GRB PUBLICATIONCHAPTER - GRAPHICAL INTERPRETATIONEXERCISE - B. Gaseous State1videos
GRAPHICAL INTERPRETATION
- BOOK - GRB PUBLICATIONCHAPTER - F-BLOCK ELEMENTSEXERCISE - Subjective type7videos
F-BLOCK ELEMENTS
- BOOK - GRB PUBLICATIONCHAPTER - HYDROCARBON (ALIPHATIC)EXERCISE - Previous years jee questions28videos
HYDROCARBON (ALIPHATIC)
Similar Questions
Knowledge Check
- Question 1 - Select One
Which of the following graphs is consistent with ideal gas behaviour?
A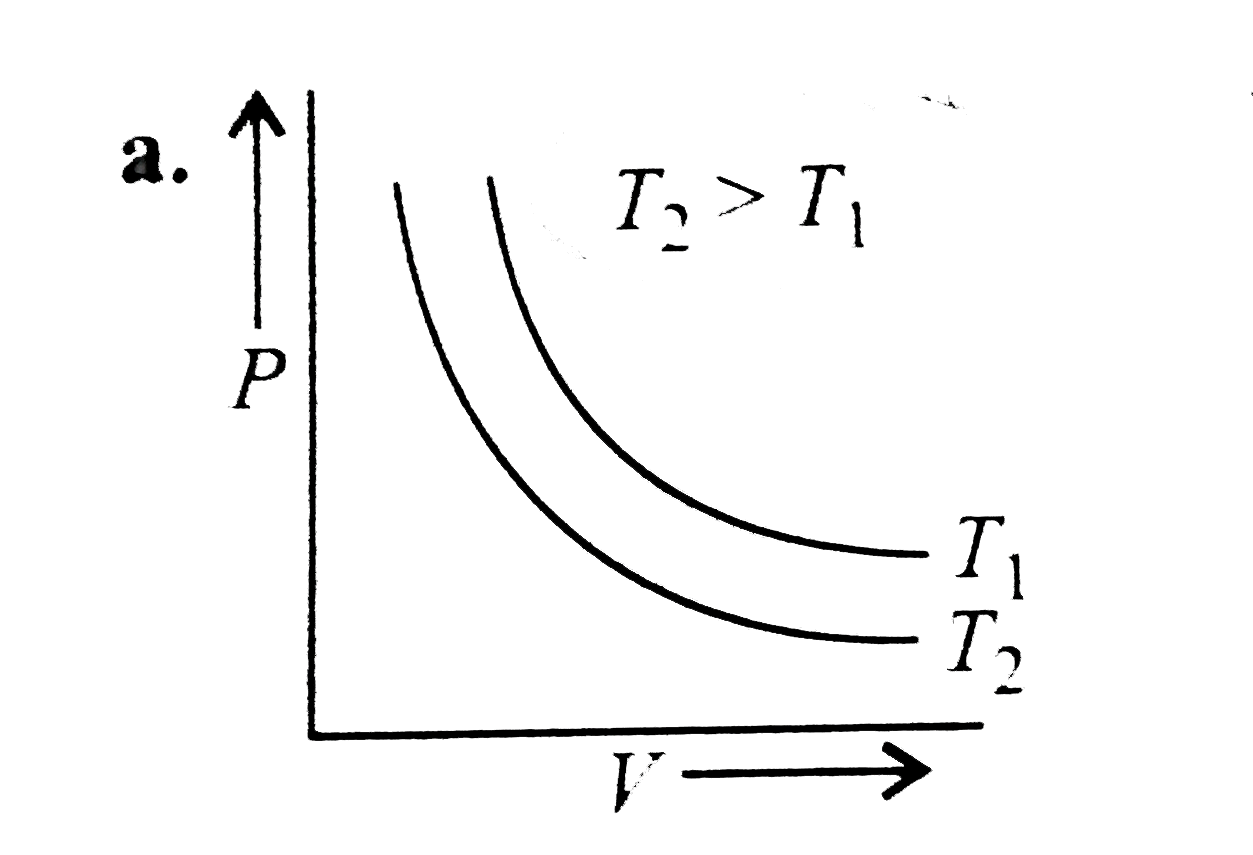 B
B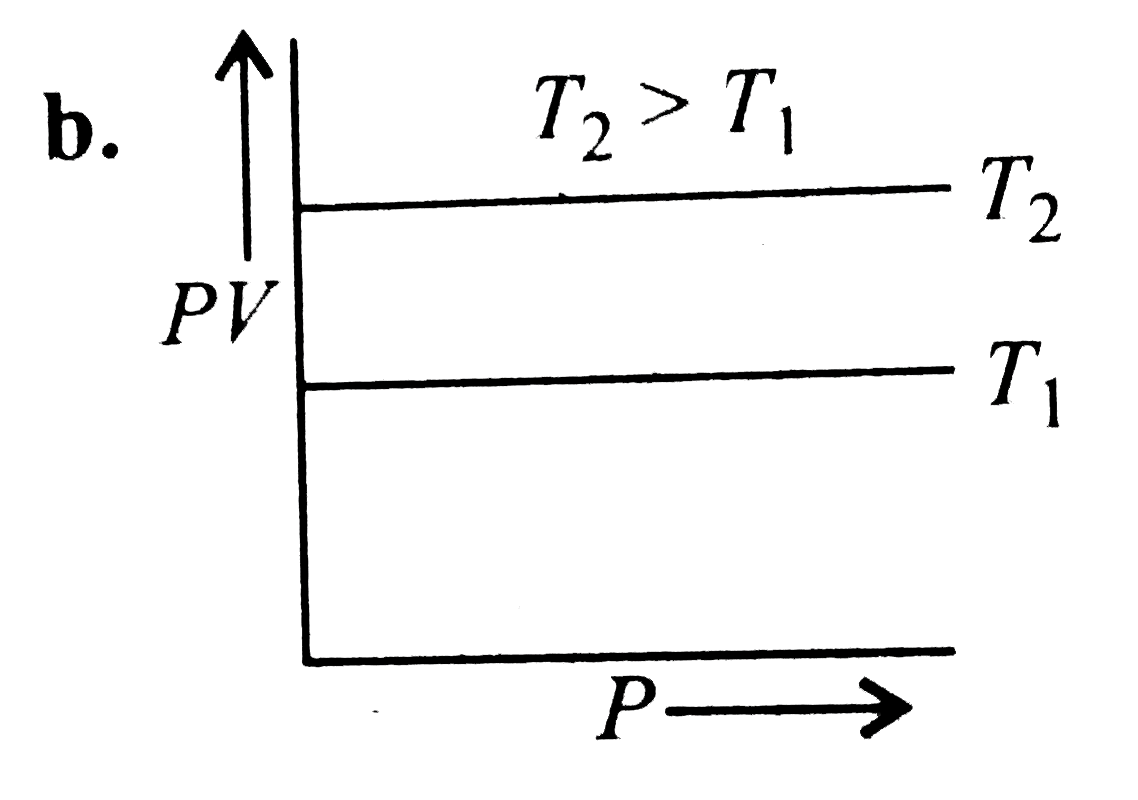 C
C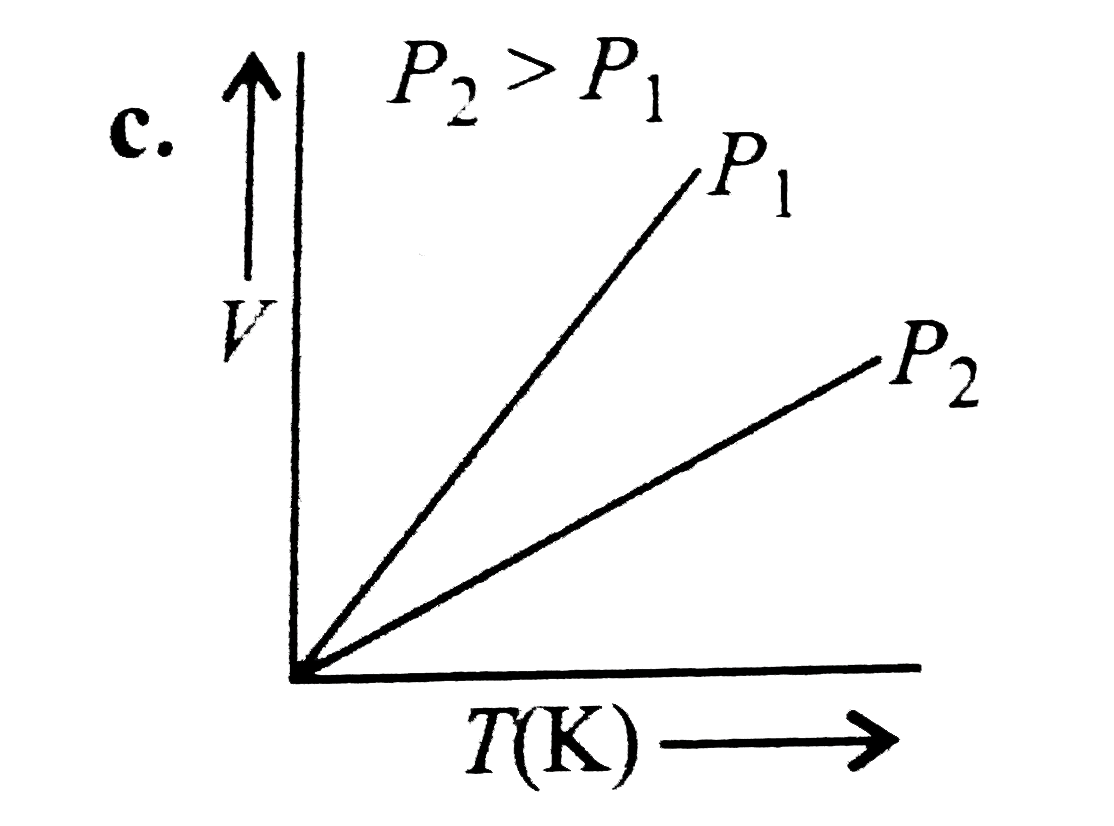 D
D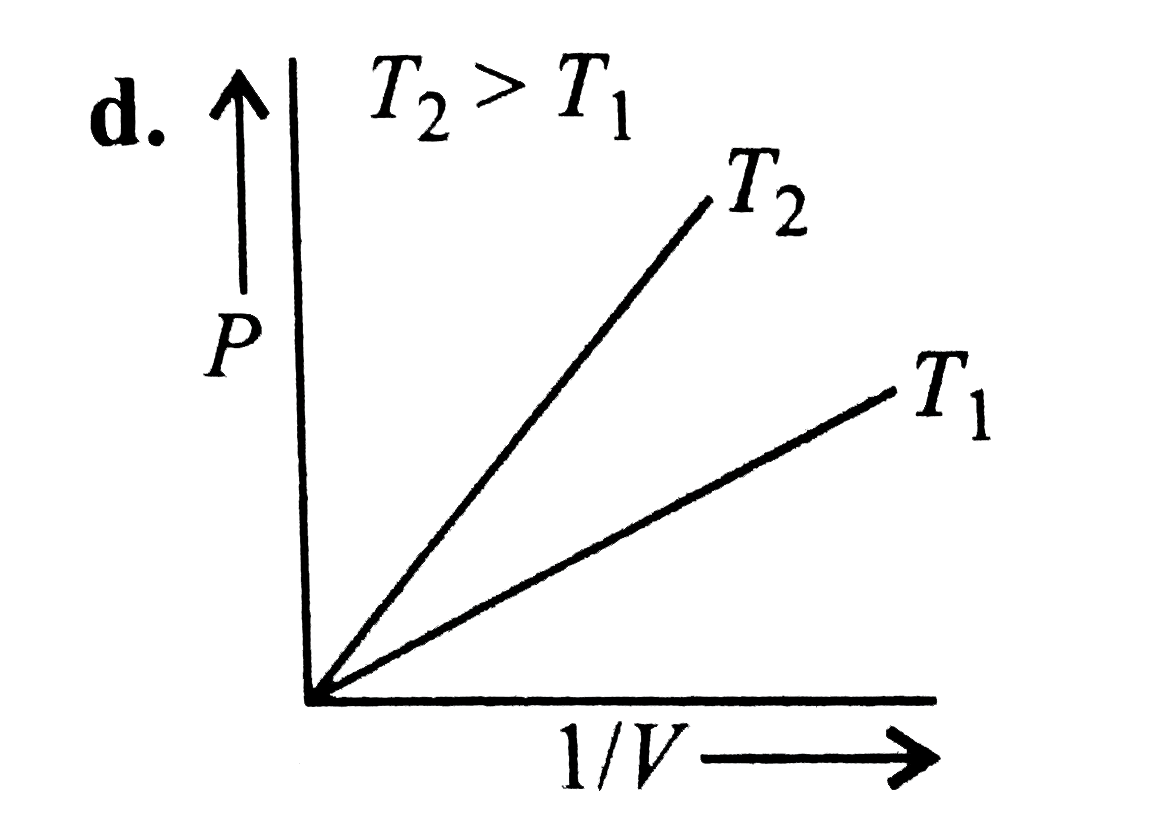
- Question 2 - Select One
Which one of the following graphs correctly gives the ideal gas behaviour ?
A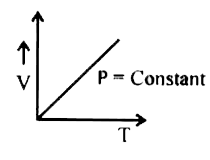 B
B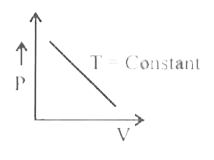 C
C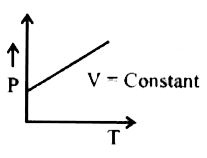 D
D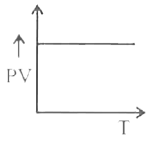
- Question 3 - Select One or More
Which of the following diagrams, Fig. depicts ideal gas behaviour ?
A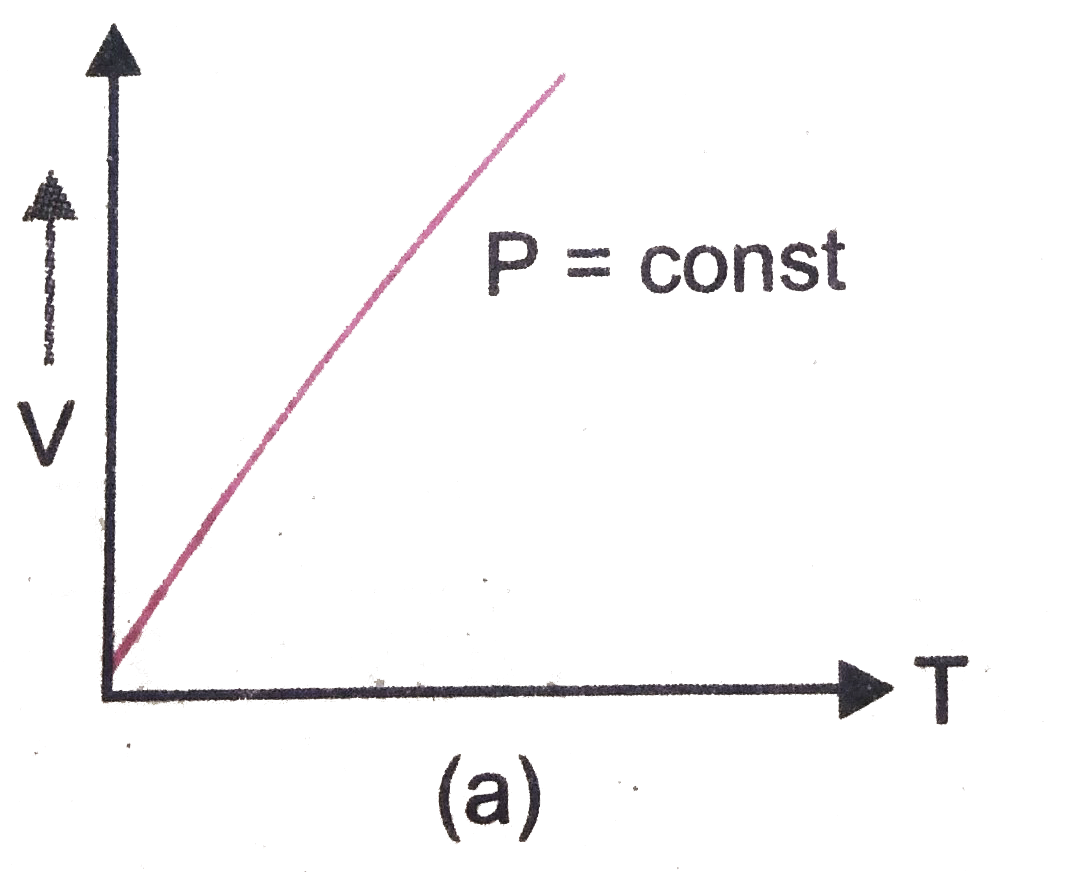 B
B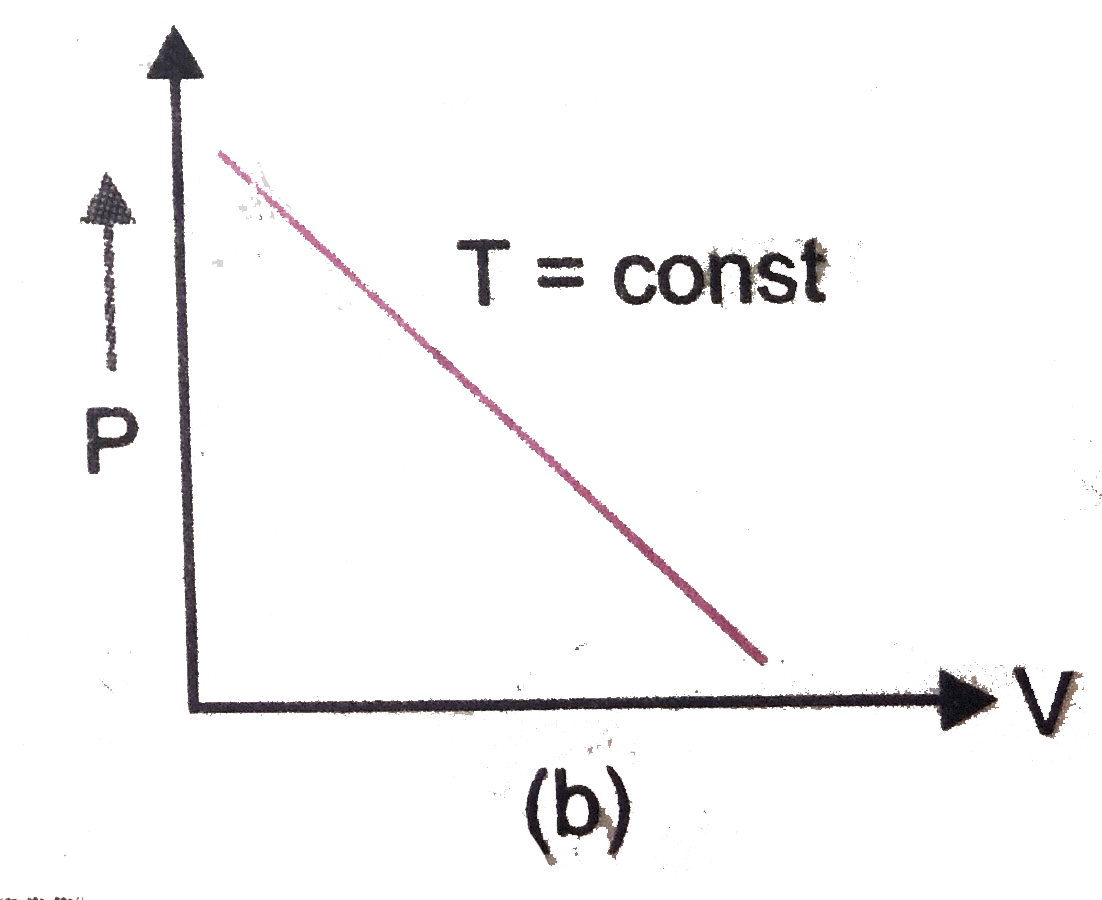 C
C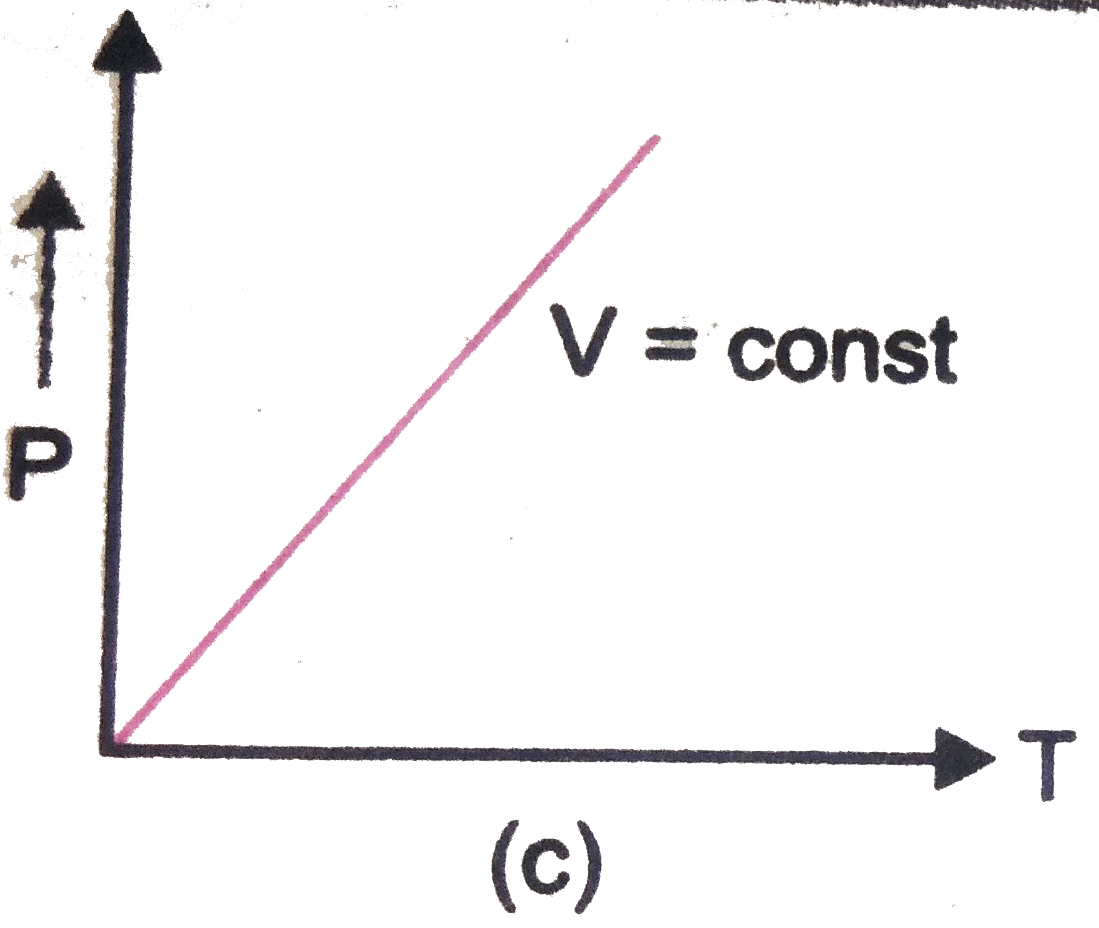 D
D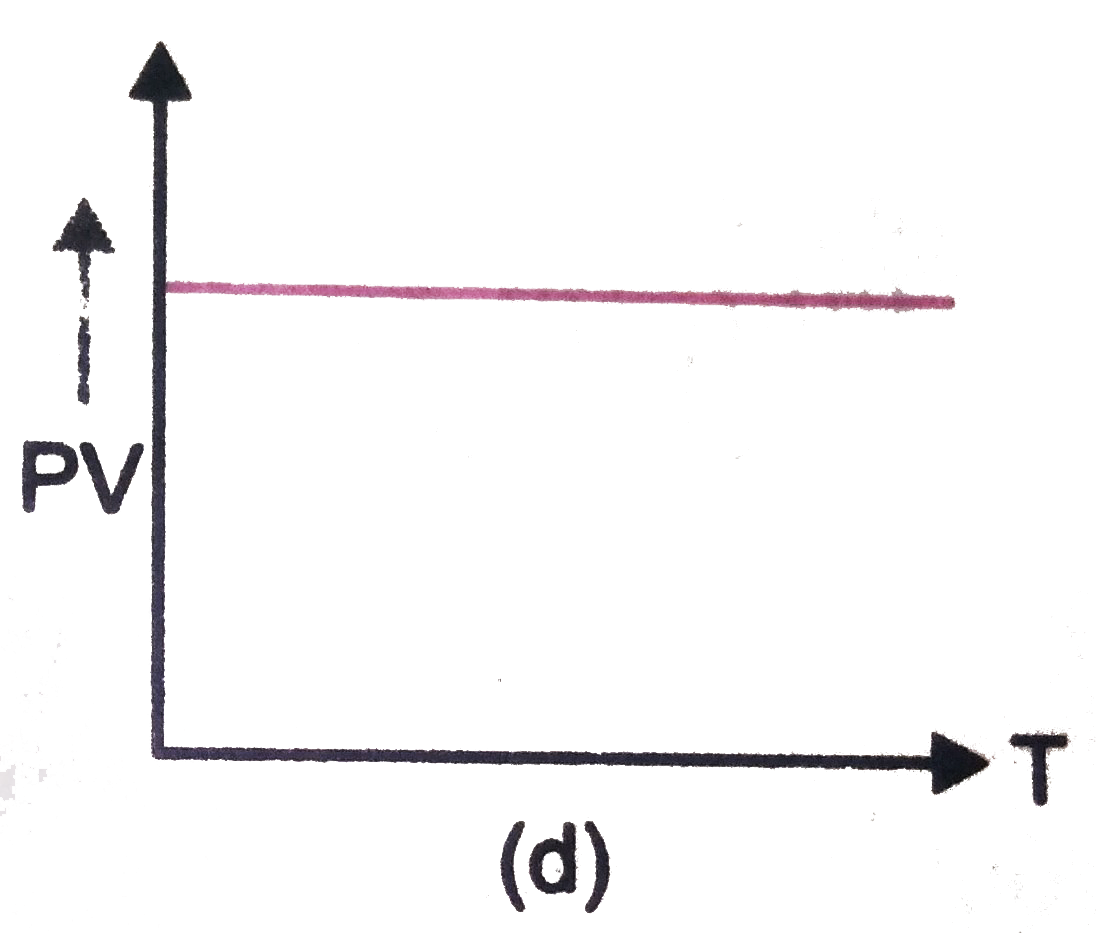
Which of the following diagrams (figure) depicts ideal gas behaviour?
View SolutionWhich of the following graphs is not a straight line for an ideal gas ?
View SolutionWhich of the following graphs show most significant deviation from ideal gas behaviour ?
View SolutionWhich of the following graphs represent the behaviour of an ideal gas ?
View SolutionWhich of the following measure the deviation from ideal behaviour of gas?
View Solution


