Ten moles of an ideal gas are filled in a closed vessel. The vessel has cylinder and piston type arrangement and pressure of the gas remains constant at 0.821 atm. Which of the following graph represents correct variation of log V vs log T?
(V = Volume in litre and T = temperature in Kelvin)
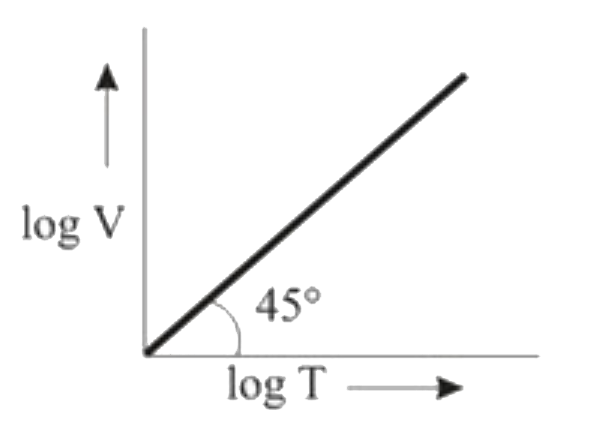
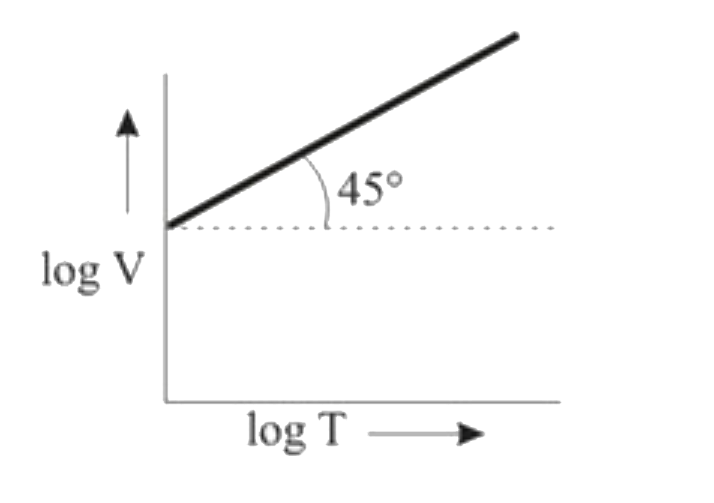
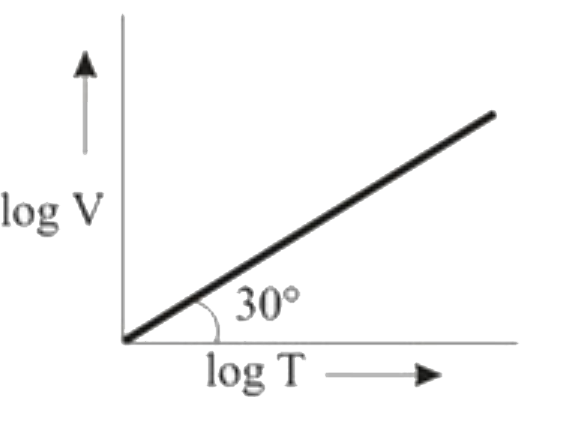
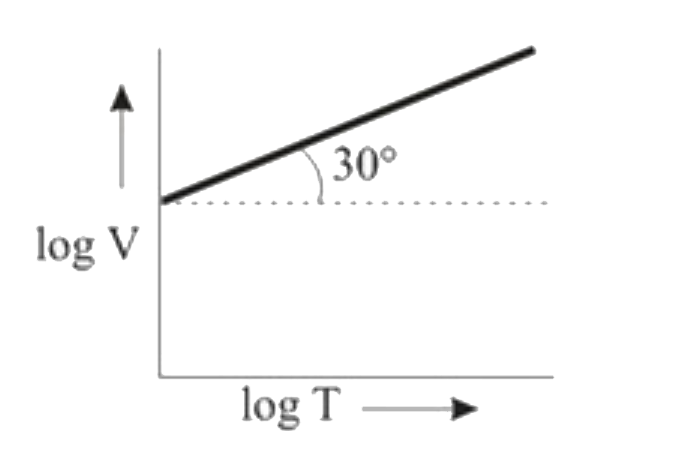
The correct Answer is:A
To solve the problem, we will use the ideal gas law and analyze the relationship between volume (V) and temperature (T) for an ideal gas at constant pressure.
1. Understand the Ideal Gas Law:
The ideal gas law is given by the equation:
PV=nRT
where:
- P = pressure (in atm)
- V = volume (in liters)
- n = number of moles of gas
- R = ideal gas constant (0.0821 L·atm/(K·mol))
- T = temperature (in Kelvin)
2. Substitute Known Values:
We know:
- n=10 moles
- P=0.821 atm
- R=0.0821 L·atm/(K·mol)
Plugging these values into the ideal gas equation, we have:
0.821V=10×0.0821×T
3. Rearranging the Equation:
Rearranging the equation to solve for V:
V=10×0.0821×T0.821
Simplifying this gives:
V=0.821×10×0.08210.821×T=10×0.0821×T
Thus, we can express V as:
V=kT
where k=10×0.08210.821.
4. Taking the Logarithm:
Now, we take the logarithm of both sides:
logV=log(kT)
Using the property of logarithms:
logV=logk+logT
5. Rearranging the Logarithmic Equation:
This can be rearranged to:
logV=logT+logk
This equation is in the form of y=mx+b, where:
- y=logV
- x=logT
- m=1 (slope)
- b=logk (y-intercept)
6. Graph Characteristics:
Since the slope m=1, the graph of logV versus logT will be a straight line with a slope of 1, passing through the y-intercept logk. This indicates that the graph will pass through the origin if k=1.
7. Identifying the Correct Graph:
The graph of logV vs. logT will be a straight line with a slope of 1, indicating a 45-degree angle with respect to the axes. Therefore, the correct graph will be the one that represents a straight line passing through the origin with a slope of 1.
Conclusion:
The correct option is the one that shows a straight line passing through the origin with a slope of 1 (45 degrees). This corresponds to option 1.
The ideal gas law is given by the equation:
PV=nRT
where:
- P = pressure (in atm)
- V = volume (in liters)
- n = number of moles of gas
- R = ideal gas constant (0.0821 L·atm/(K·mol))
- T = temperature (in Kelvin)
We know:
- n=10 moles
- P=0.821 atm
- R=0.0821 L·atm/(K·mol)
Plugging these values into the ideal gas equation, we have:
0.821V=10×0.0821×T
Rearranging the equation to solve for V:
V=10×0.0821×T0.821
Simplifying this gives:
V=0.821×10×0.08210.821×T=10×0.0821×T
Thus, we can express V as:
V=kT
where k=10×0.08210.821.
Now, we take the logarithm of both sides:
logV=log(kT)
Using the property of logarithms:
logV=logk+logT
This can be rearranged to:
logV=logT+logk
This equation is in the form of y=mx+b, where:
- y=logV
- x=logT
- m=1 (slope)
- b=logk (y-intercept)
Since the slope m=1, the graph of logV versus logT will be a straight line with a slope of 1, passing through the y-intercept logk. This indicates that the graph will pass through the origin if k=1.
The graph of logV vs. logT will be a straight line with a slope of 1, indicating a 45-degree angle with respect to the axes. Therefore, the correct graph will be the one that represents a straight line passing through the origin with a slope of 1.
The correct option is the one that shows a straight line passing through the origin with a slope of 1 (45 degrees). This corresponds to option 1.
Topper's Solved these Questions
Similar Questions
Knowledge Check
For a closed container containing 100 mol of an ideal gas fitted with movable, frictionless, weightless piston operating such that pressure of gas remain constant at 8.21 atm, which graph repsents correct variation of log Vv/s log T where V is in litre and T is in Kelvin ? (R=0.0821atmLmolK)
A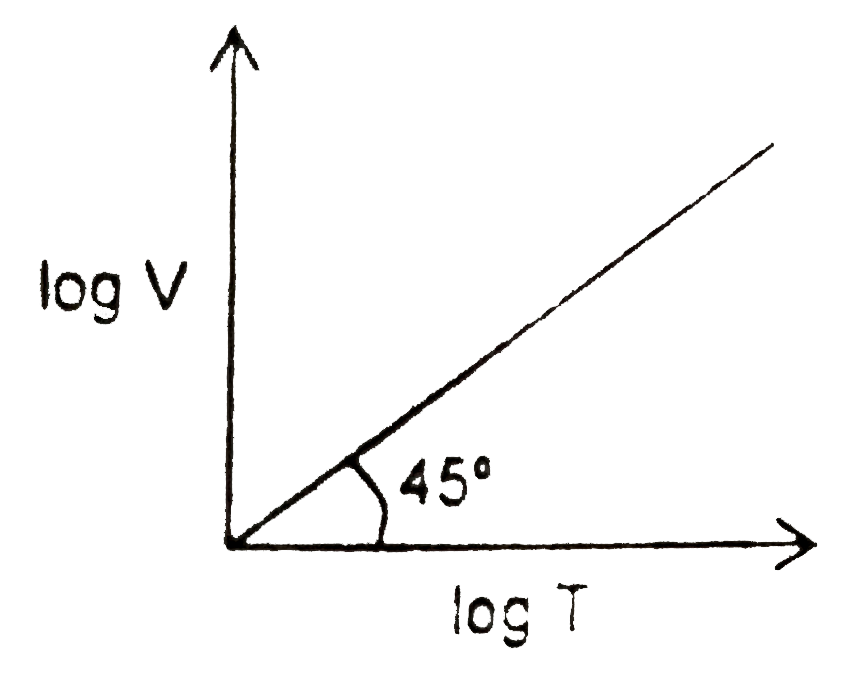 B
B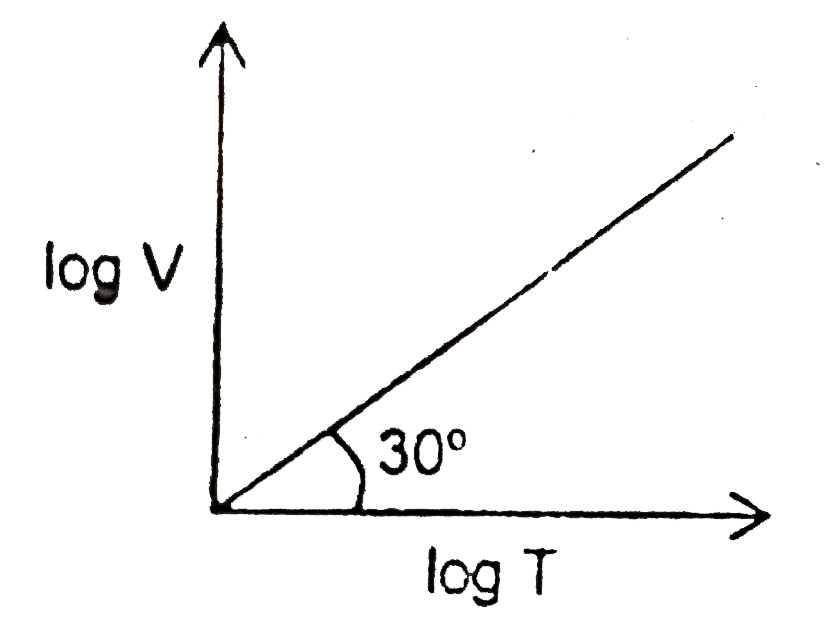 C
C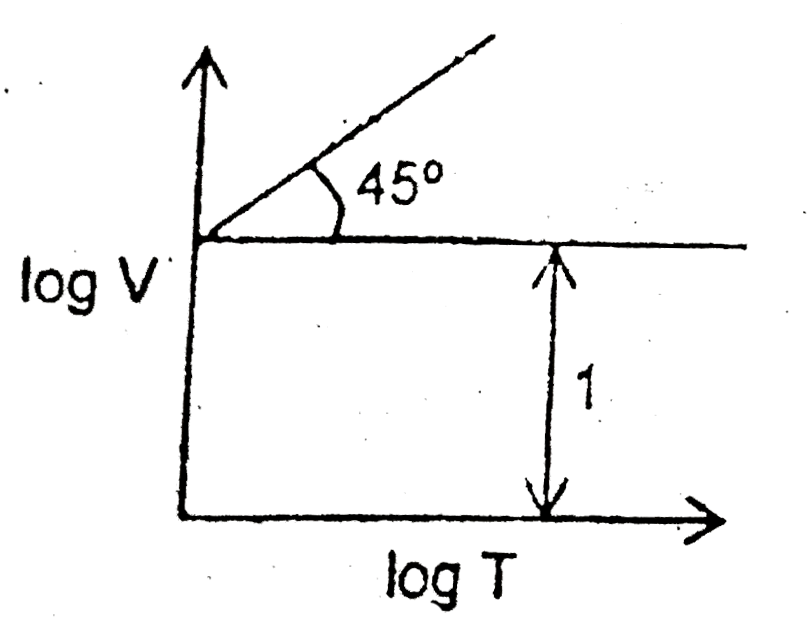 DNone of these
For a closed container containing 10 moles of an ideal gas, at constant pressure of 0.82 atm, which graph correctly represent, variation of log V us log T where volume is in litre and temp. in kelvin :
A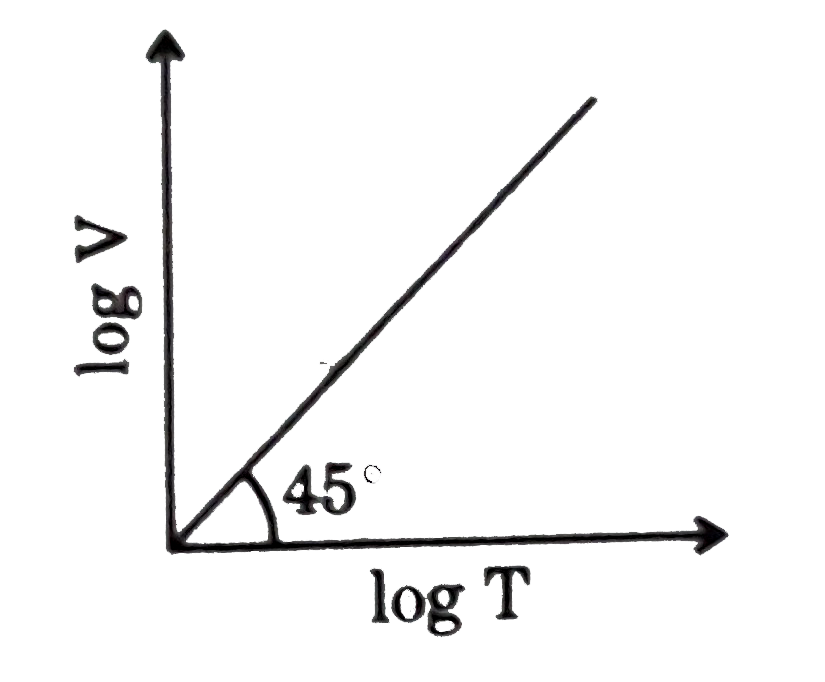 B
B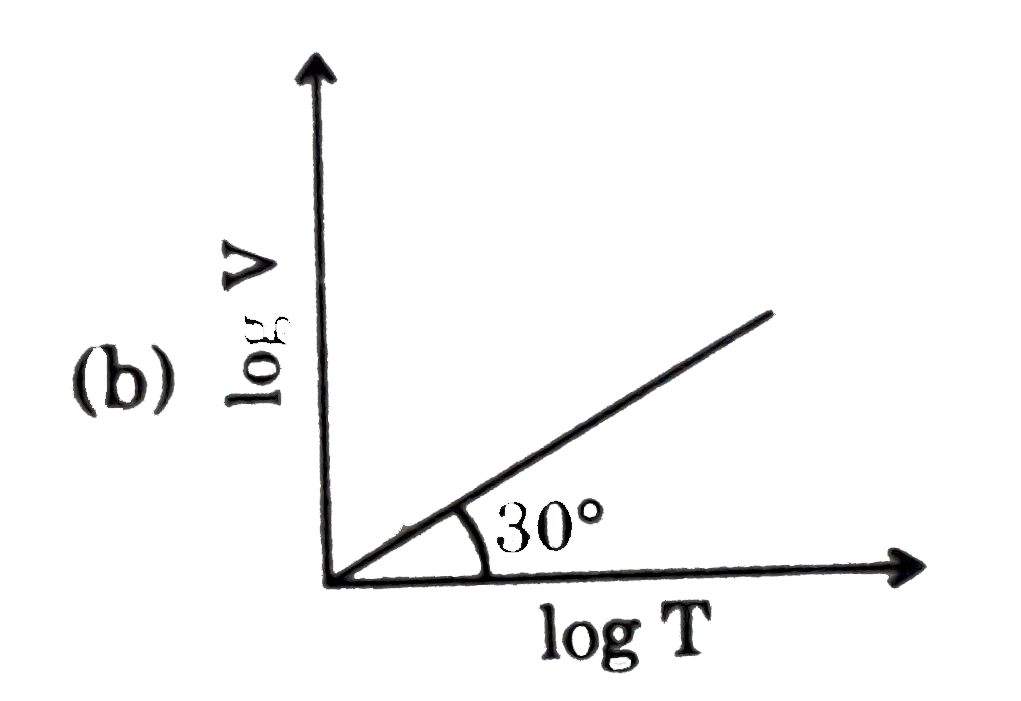 C
C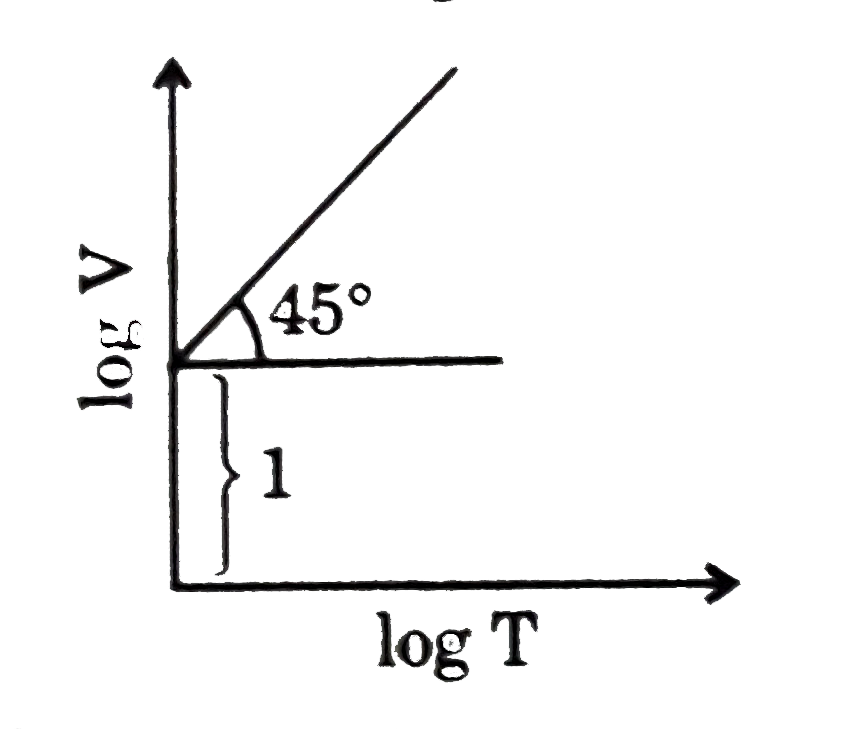 D
D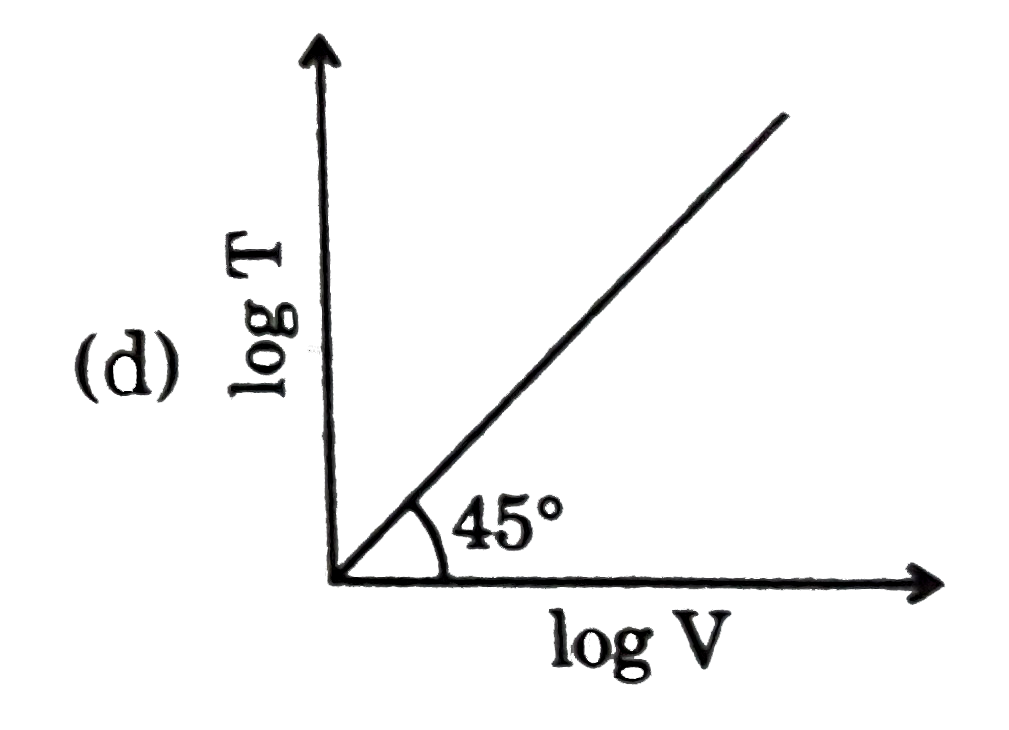
Which of the following graphs correctly represents the variation of β=−dV/dPV
with P for an ideal gas at constant temperature?A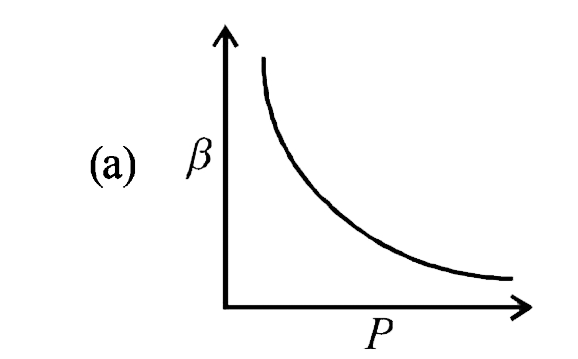 B
B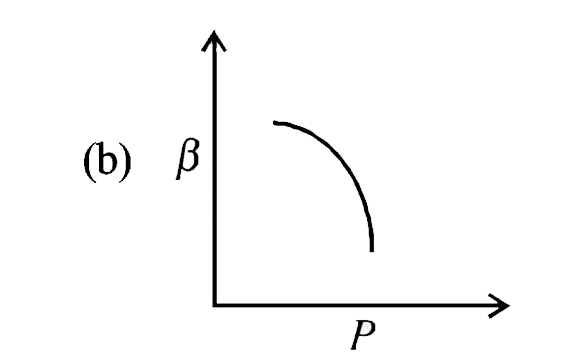 C
C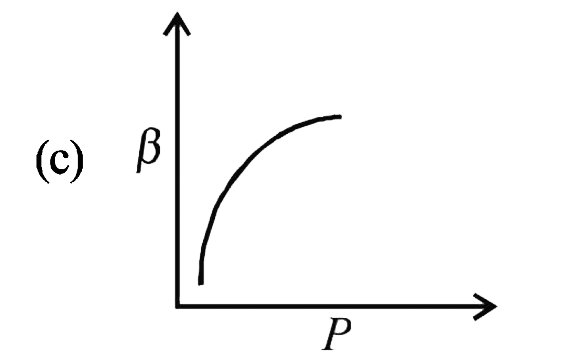 D
D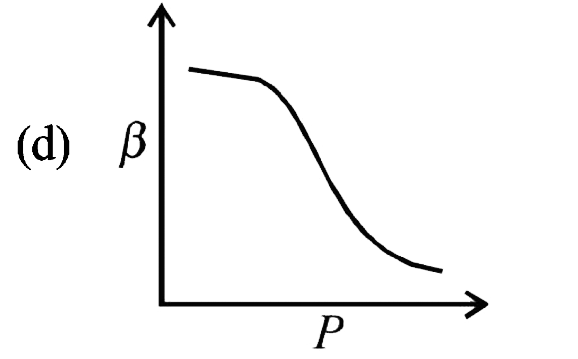
Which of the following graphs correctly represents the variation of β=−dV/dPV
with P for an ideal gas at constant temperature?
View SolutionIf a graph is plotted between log V and log T for 2 moles of a gas of constant pressure of 0.0821 atm, then which of the following statements are correct?
View SolutionAt a constant pressure, of the following graphs that one which represents the variation of the density of an ideal gas with the absolute temperature T, is
View SolutionWhich of the following graphs correctly represents the variation of β=−(dVdP)1V with P for an ideal gas at constant temperature ?
View SolutionOne mole of an ideal gas present in a closed vessel, is compressed to one third of its original volume under constant temperature then % increase in pressure of gas is -
View Solution
