Draw the phasor diagram for the devices X.
Graph of voltage and current with time variation of reactance with frequency (Graphical variation)
Reactance of the capacitor varies in inverse
Proportion to the frequency i.e. Xcα1u


Topper's Solved these Questions
Similar Questions
A device X is connected across an ac source of voltage V=V0sinωt. The current throught X is given as I=I0sin(ωt+π2)
(a) Identify the device X and write the expression for its reactance.
(b) Draw graph showing variation of voltage and current with time over one cycle of ac, for X.
How does the reactance of the device X vary with frequency of the ac? Show this variation graphically.
(d) Draw the phasor diagram for the device X.View SolutionA device X is connected across an a.c. source of voltage V=Vmsinωt. The current through X is given asI=I∘sin(ωt+π2)
(a) Identify the device X and write the expression for its reactance.
(b) Draw graphs showing variation of voltage and current with time over one cycle of a.c. for X.
(C) How does the reactance of the device X vary with frequency of the a.c. ? Show this variation graphically.
(d) Draw the phasor diagram for the device X.View Solution
Knowledge Check
- Question 1 - Select One
In the figure, which of the phasor diagrams represents RLC circuit driven at resonance?
A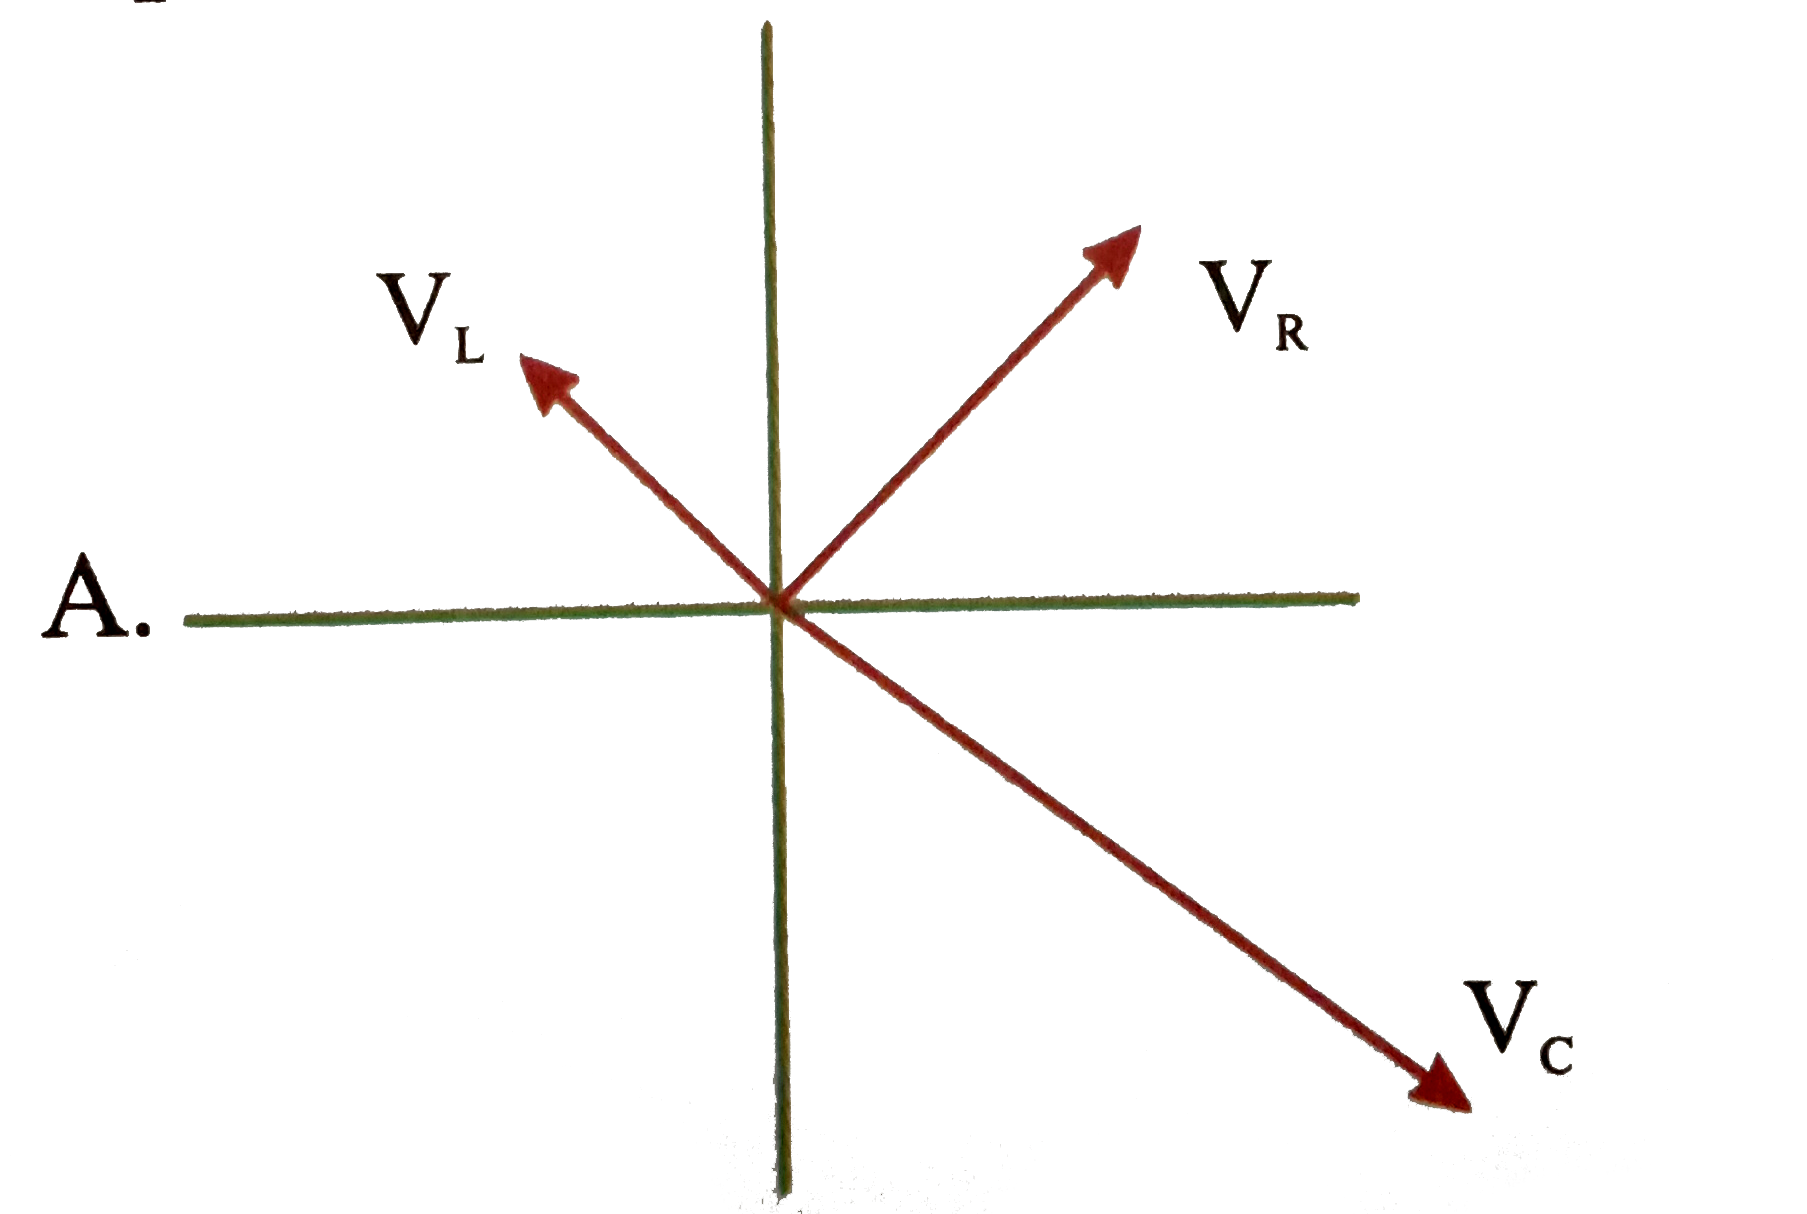 B
B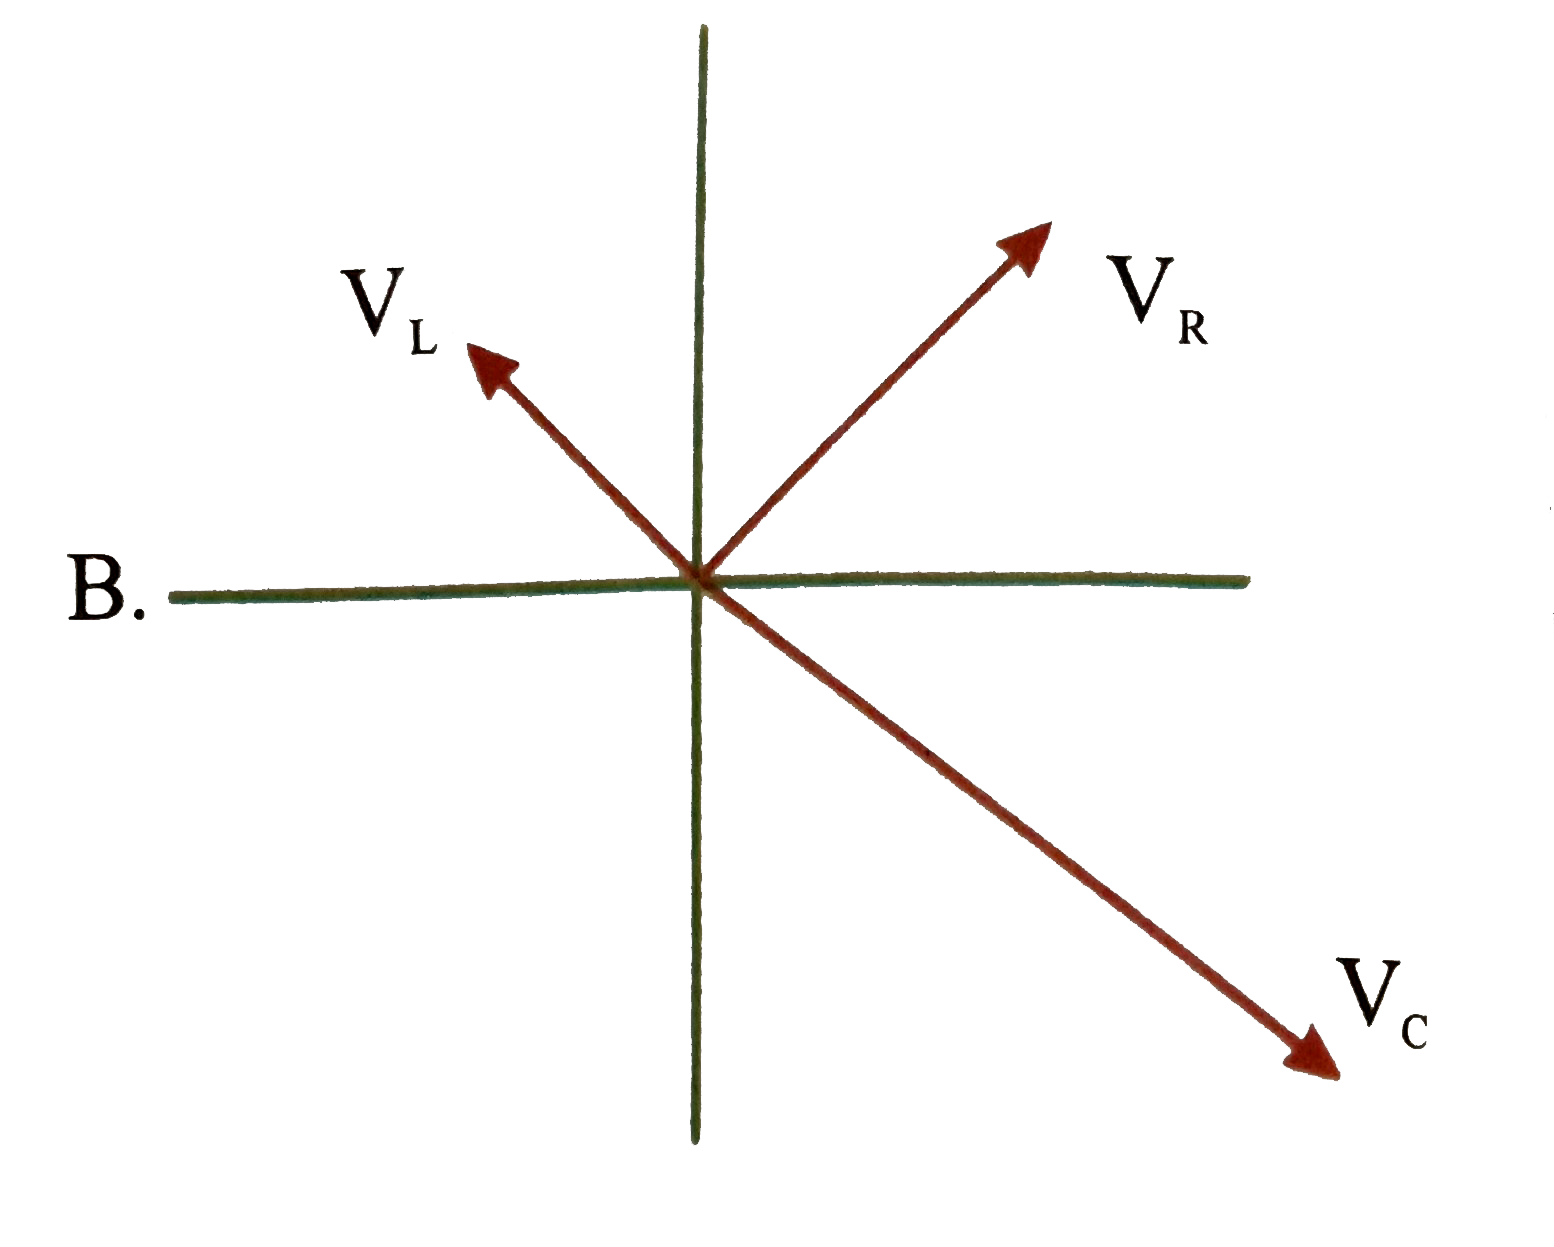 C
C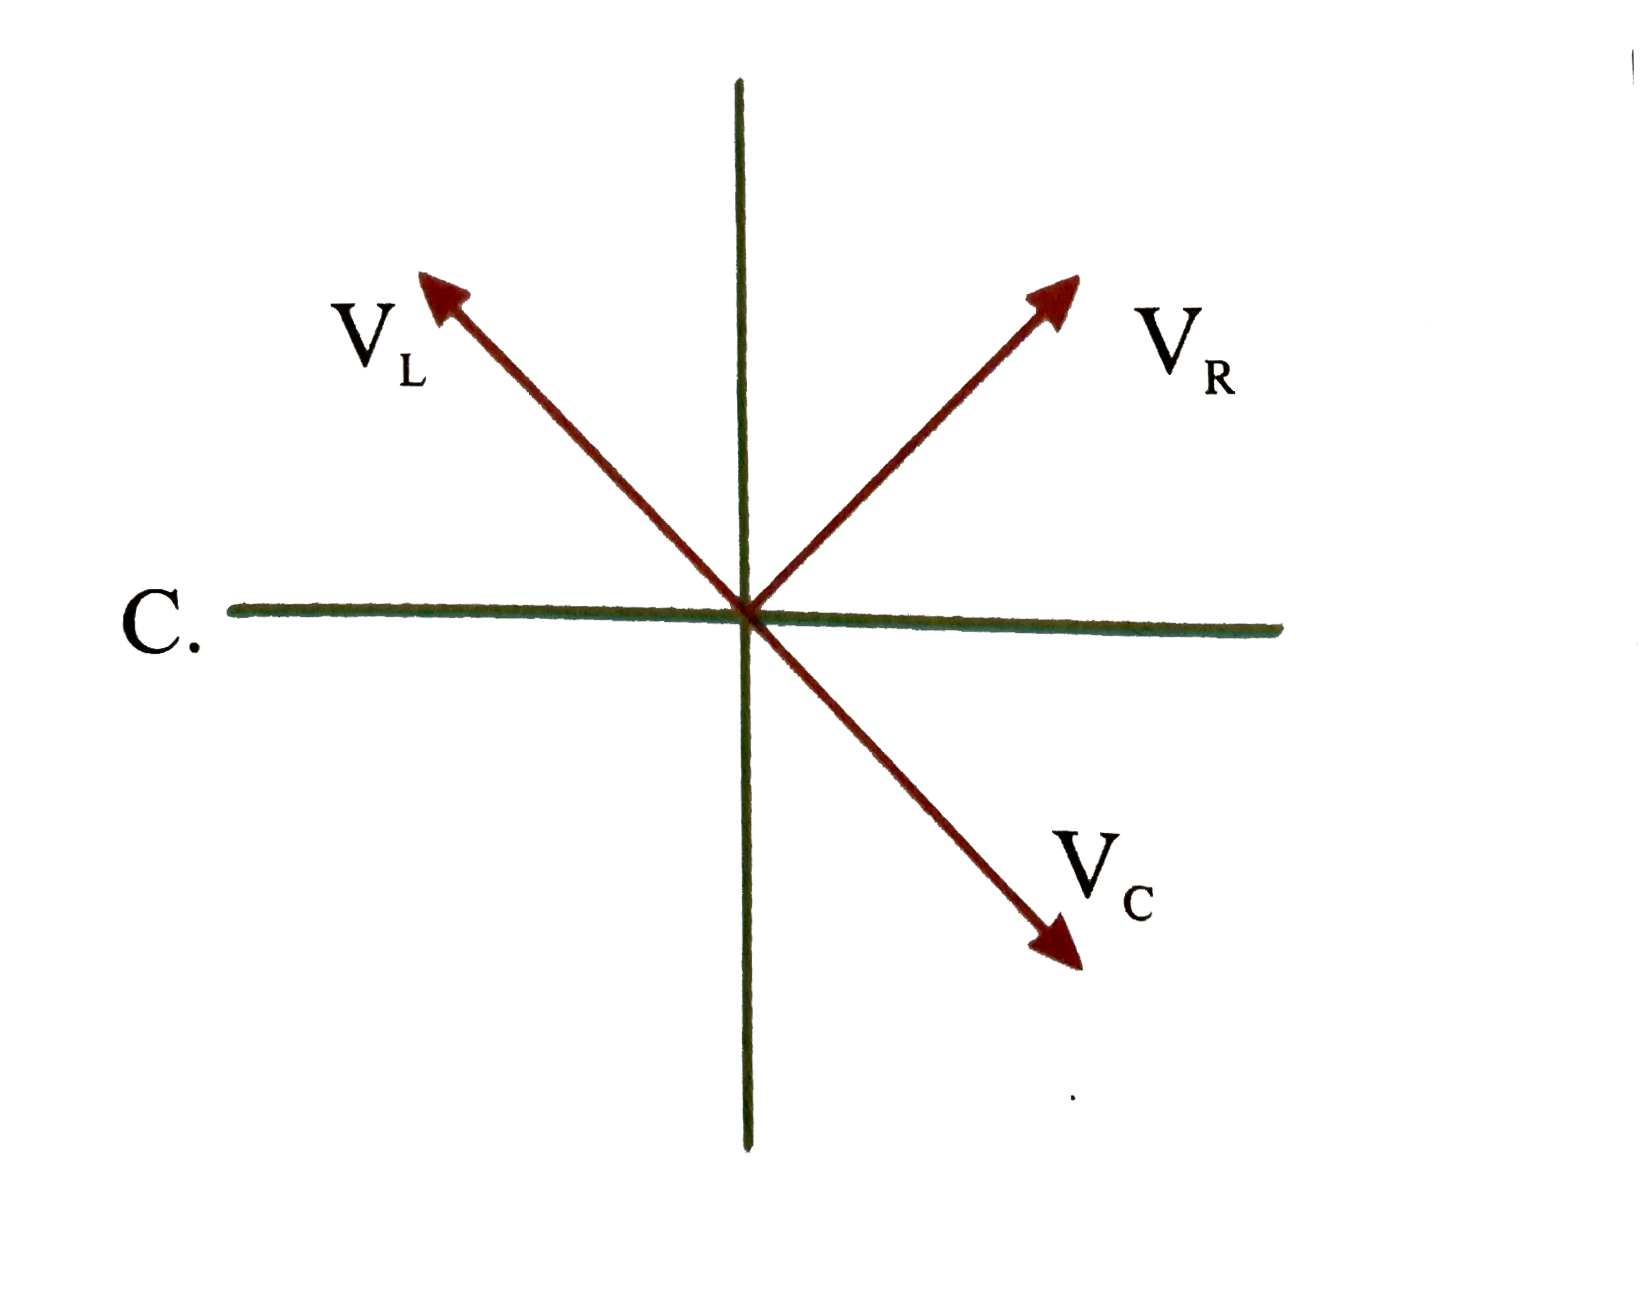 D
D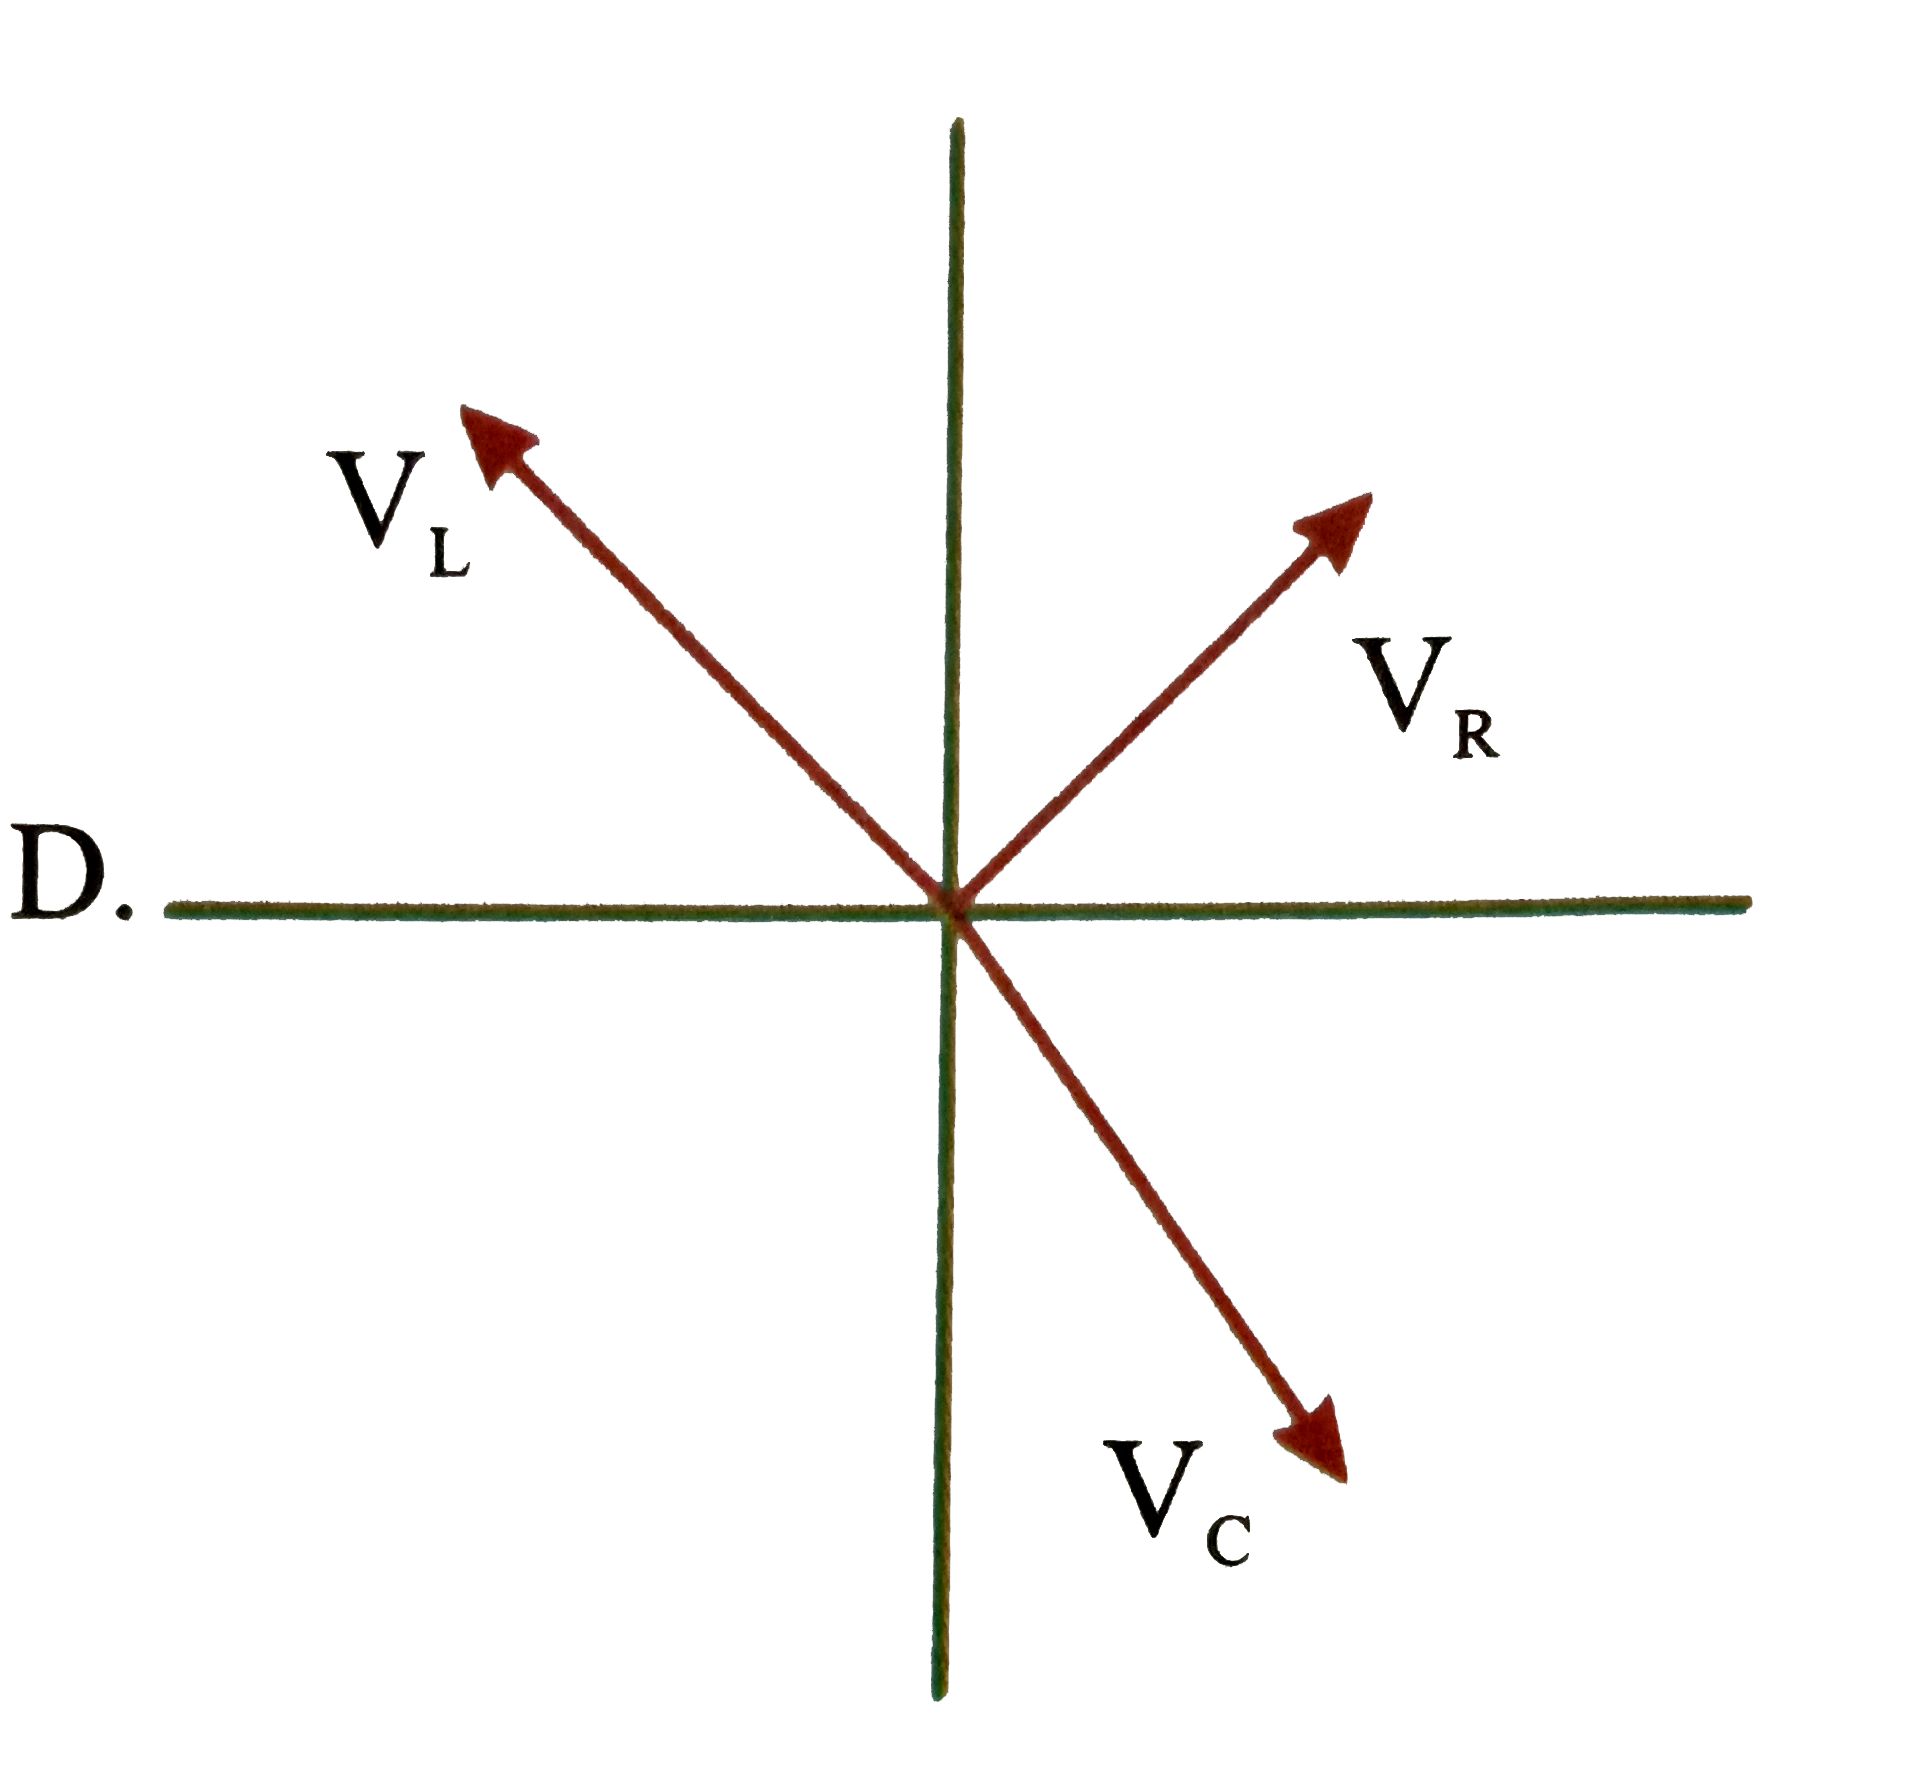
A device X is connected across an ac source of voltage V=V0sinωt. The current throught X is given as I=I0sin(ωt+π2)
(a) Identify the device X and write the expression for its reactance.
(b) Draw graph showing variation of voltage and current with time over one cycle of ac, for X.
How does the reactance of the device X vary with frequency of the ac? Show this variation graphically.
(d) Draw the phasor diagram for the device X.View SolutionDraw the phasor diagram for a series RC circuit connected to an a.c. source.
View Solution(a) Draw graphs showing the variations of inductive reactnace and capacitive reactance with frequency of the applied ac source .
(b) Draw the phasor diagram for a series RC circuit connected to an ac source.
(c ) An alternating voltage of 220 V is applied across a device X , a current of 0.25 A flows , which lag behind the applied voltage in phase by π2 radian . If the same voltage is applied across another device Y , the same current flows but now it is in phase with the applied voltage .
(i) Name the devices X and Y.
(ii) Calculate the current flowing in the circuit when the same voltage is applied across the series combination of X and Y.
 View Solution
What is a phasor ? What is its use in a.c. circuit ? Draw a phasor diagram for pure resistive a.c. circuit.
View SolutionName the device you will use to obtain 220 V a.c. from 11 V a.c. Draw a labelled diagram of the device. Name one type of loss of energy in it and state how is it remedied.
View SolutionWhat is a phasor diagram ? Draw a phasor diagram when a pure resistor is conneted acorss an a.c. supply and show that current and voltage are in the same phase.
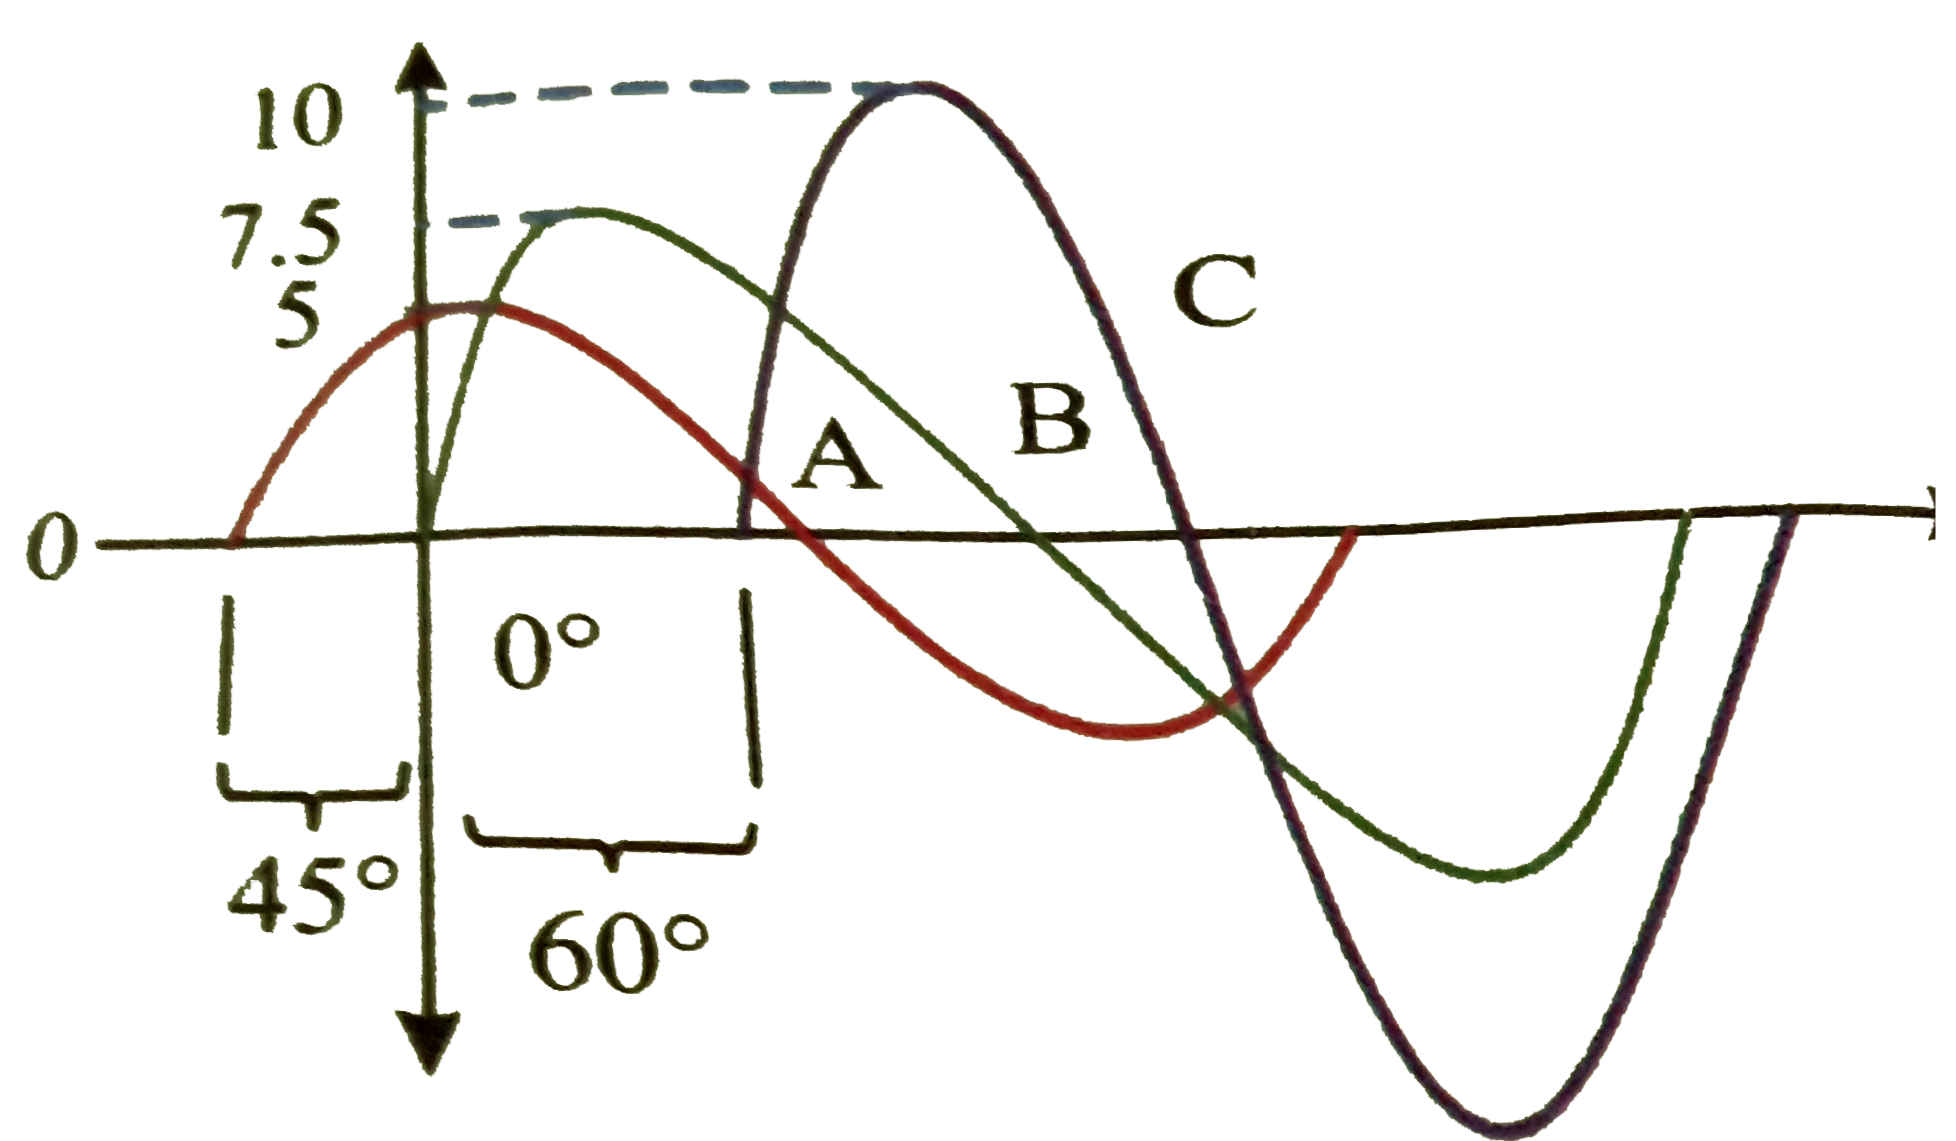
View SolutionUse a phasor diagram to represent the sine waves in the following Figure.
 View Solution
