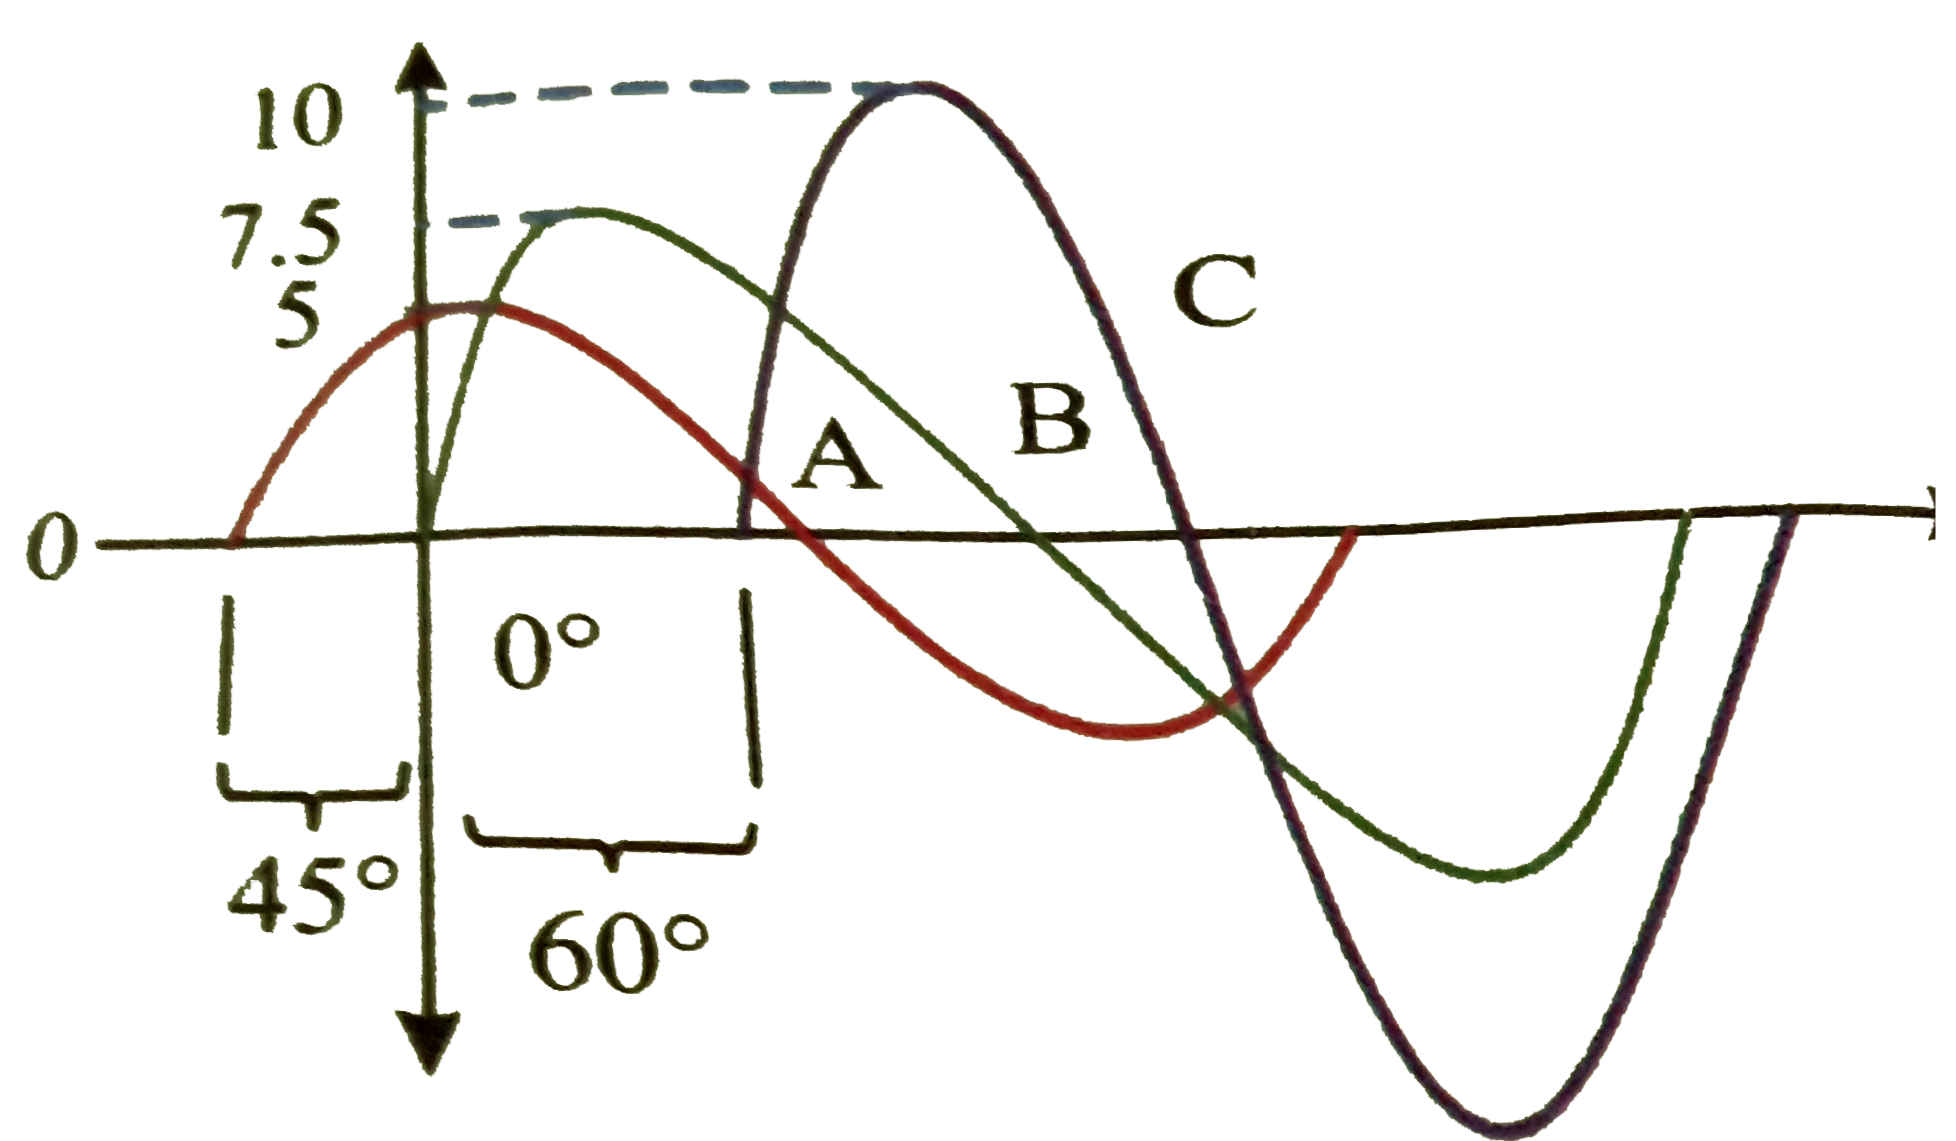
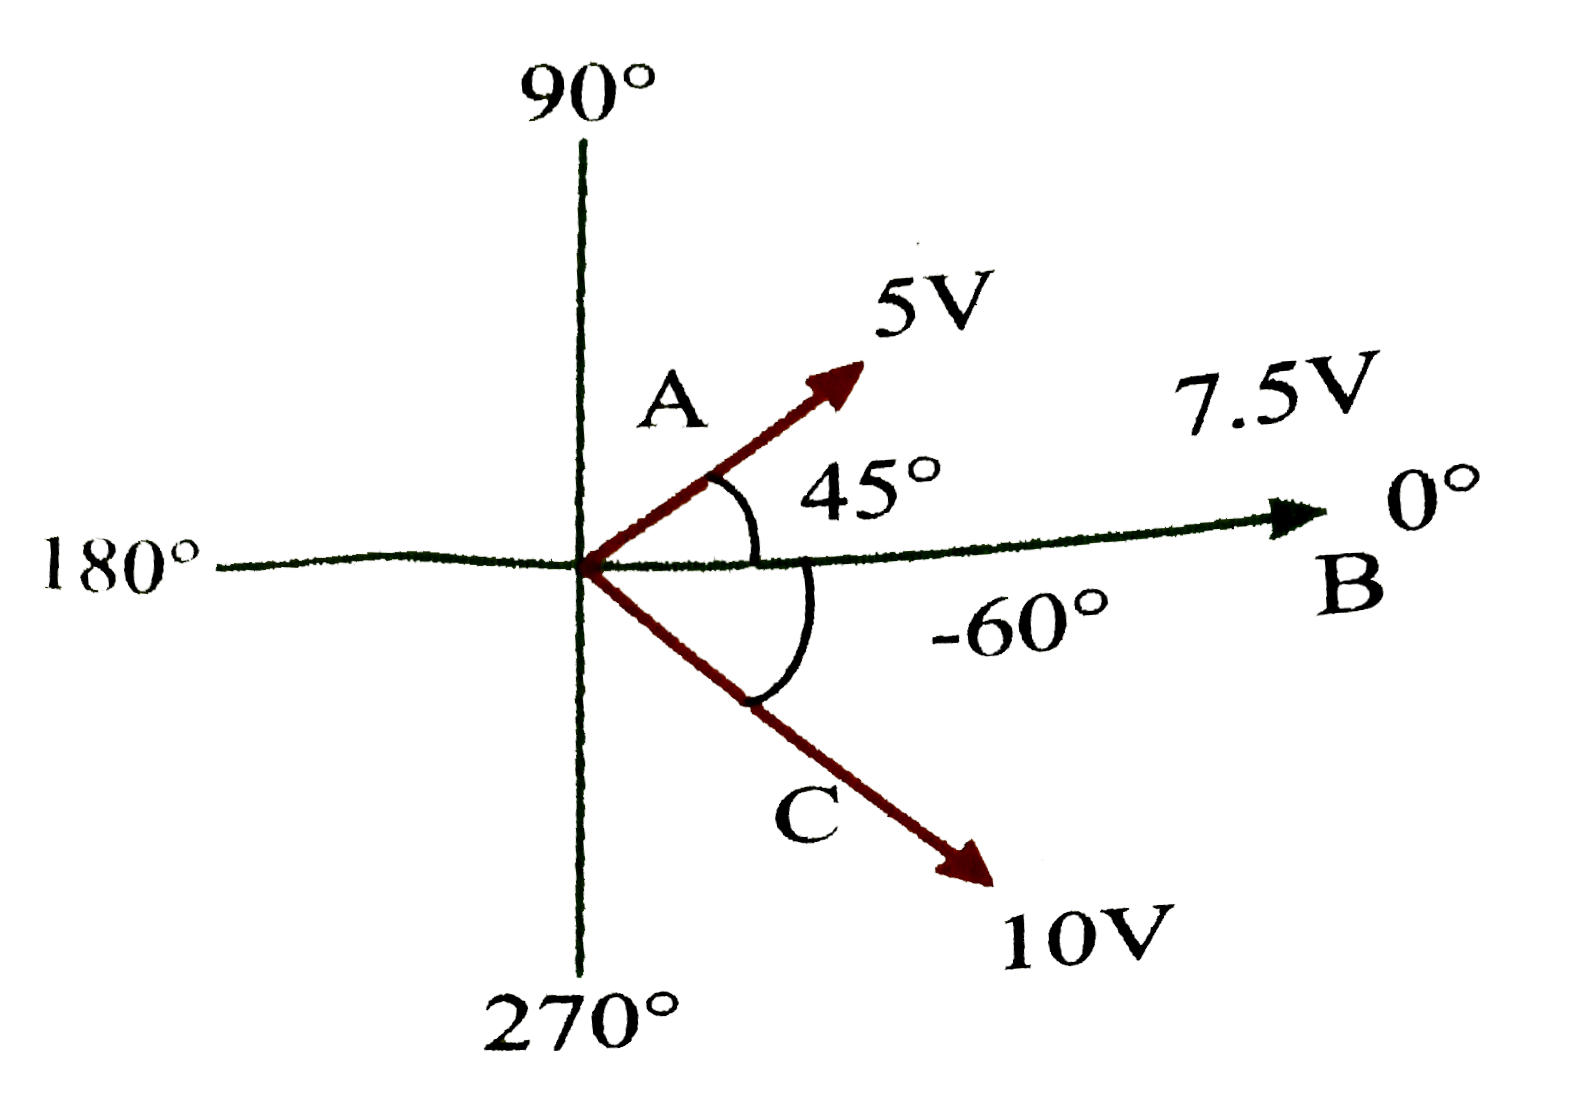
Use a phasor diagram to represent the sine waves in the following Figure.
Video Solution
Text Solution
The phasor diagram representing the sine waves is shown figure. The length of each phasor represents the peak value of the sine wave.
|
Updated on:21/07/2023
Topper's Solved these Questions
Similar Questions
Knowledge Check
- Question 1 - Select One
The following diagram represents the situation of:
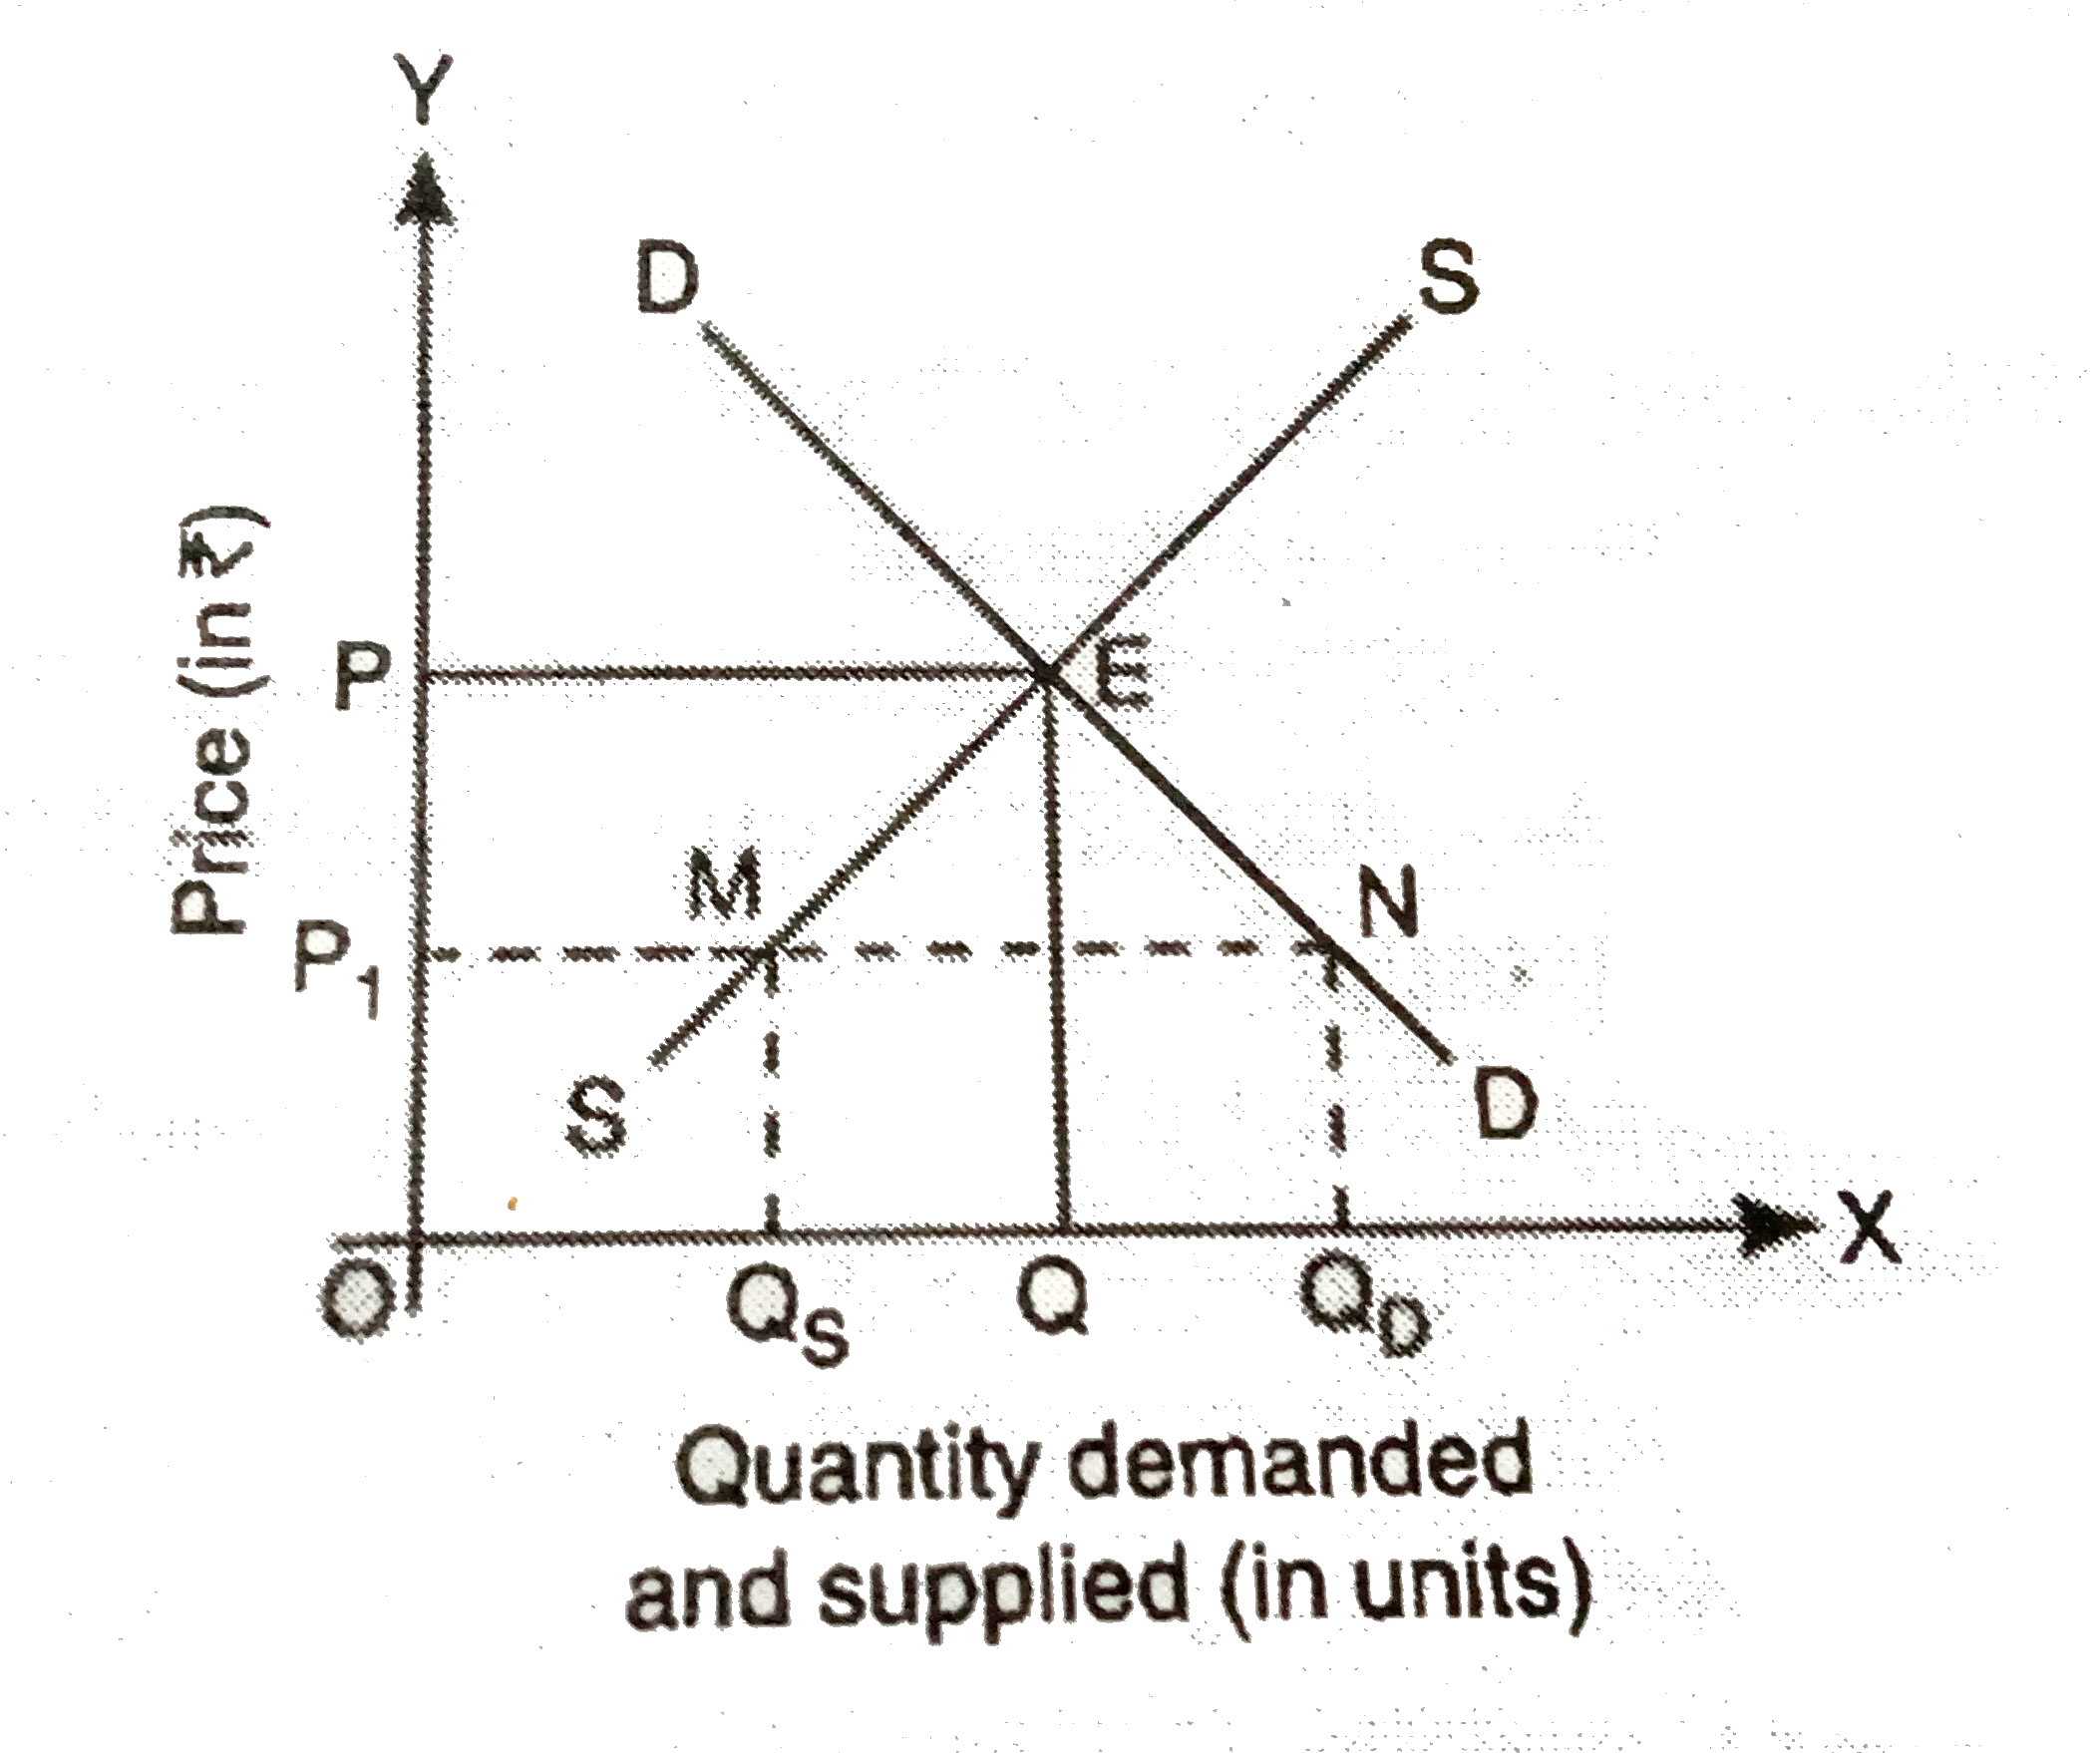 APrice FloorBPrice CeilingCEither (a) or (b)DNeither (a) nor (b)
 - Question 2 - Select One
The following diagram represents:

a) Adaptive radiation
b) Divergent evolution
c) Convergent evolution
d) Both (a) and (b)AAdaptive radiationBDivergent evolutionCConvergent ecolutionDBoth (a) and (b) - Question 3 - Select One
The following diagram represents the demand curve of:
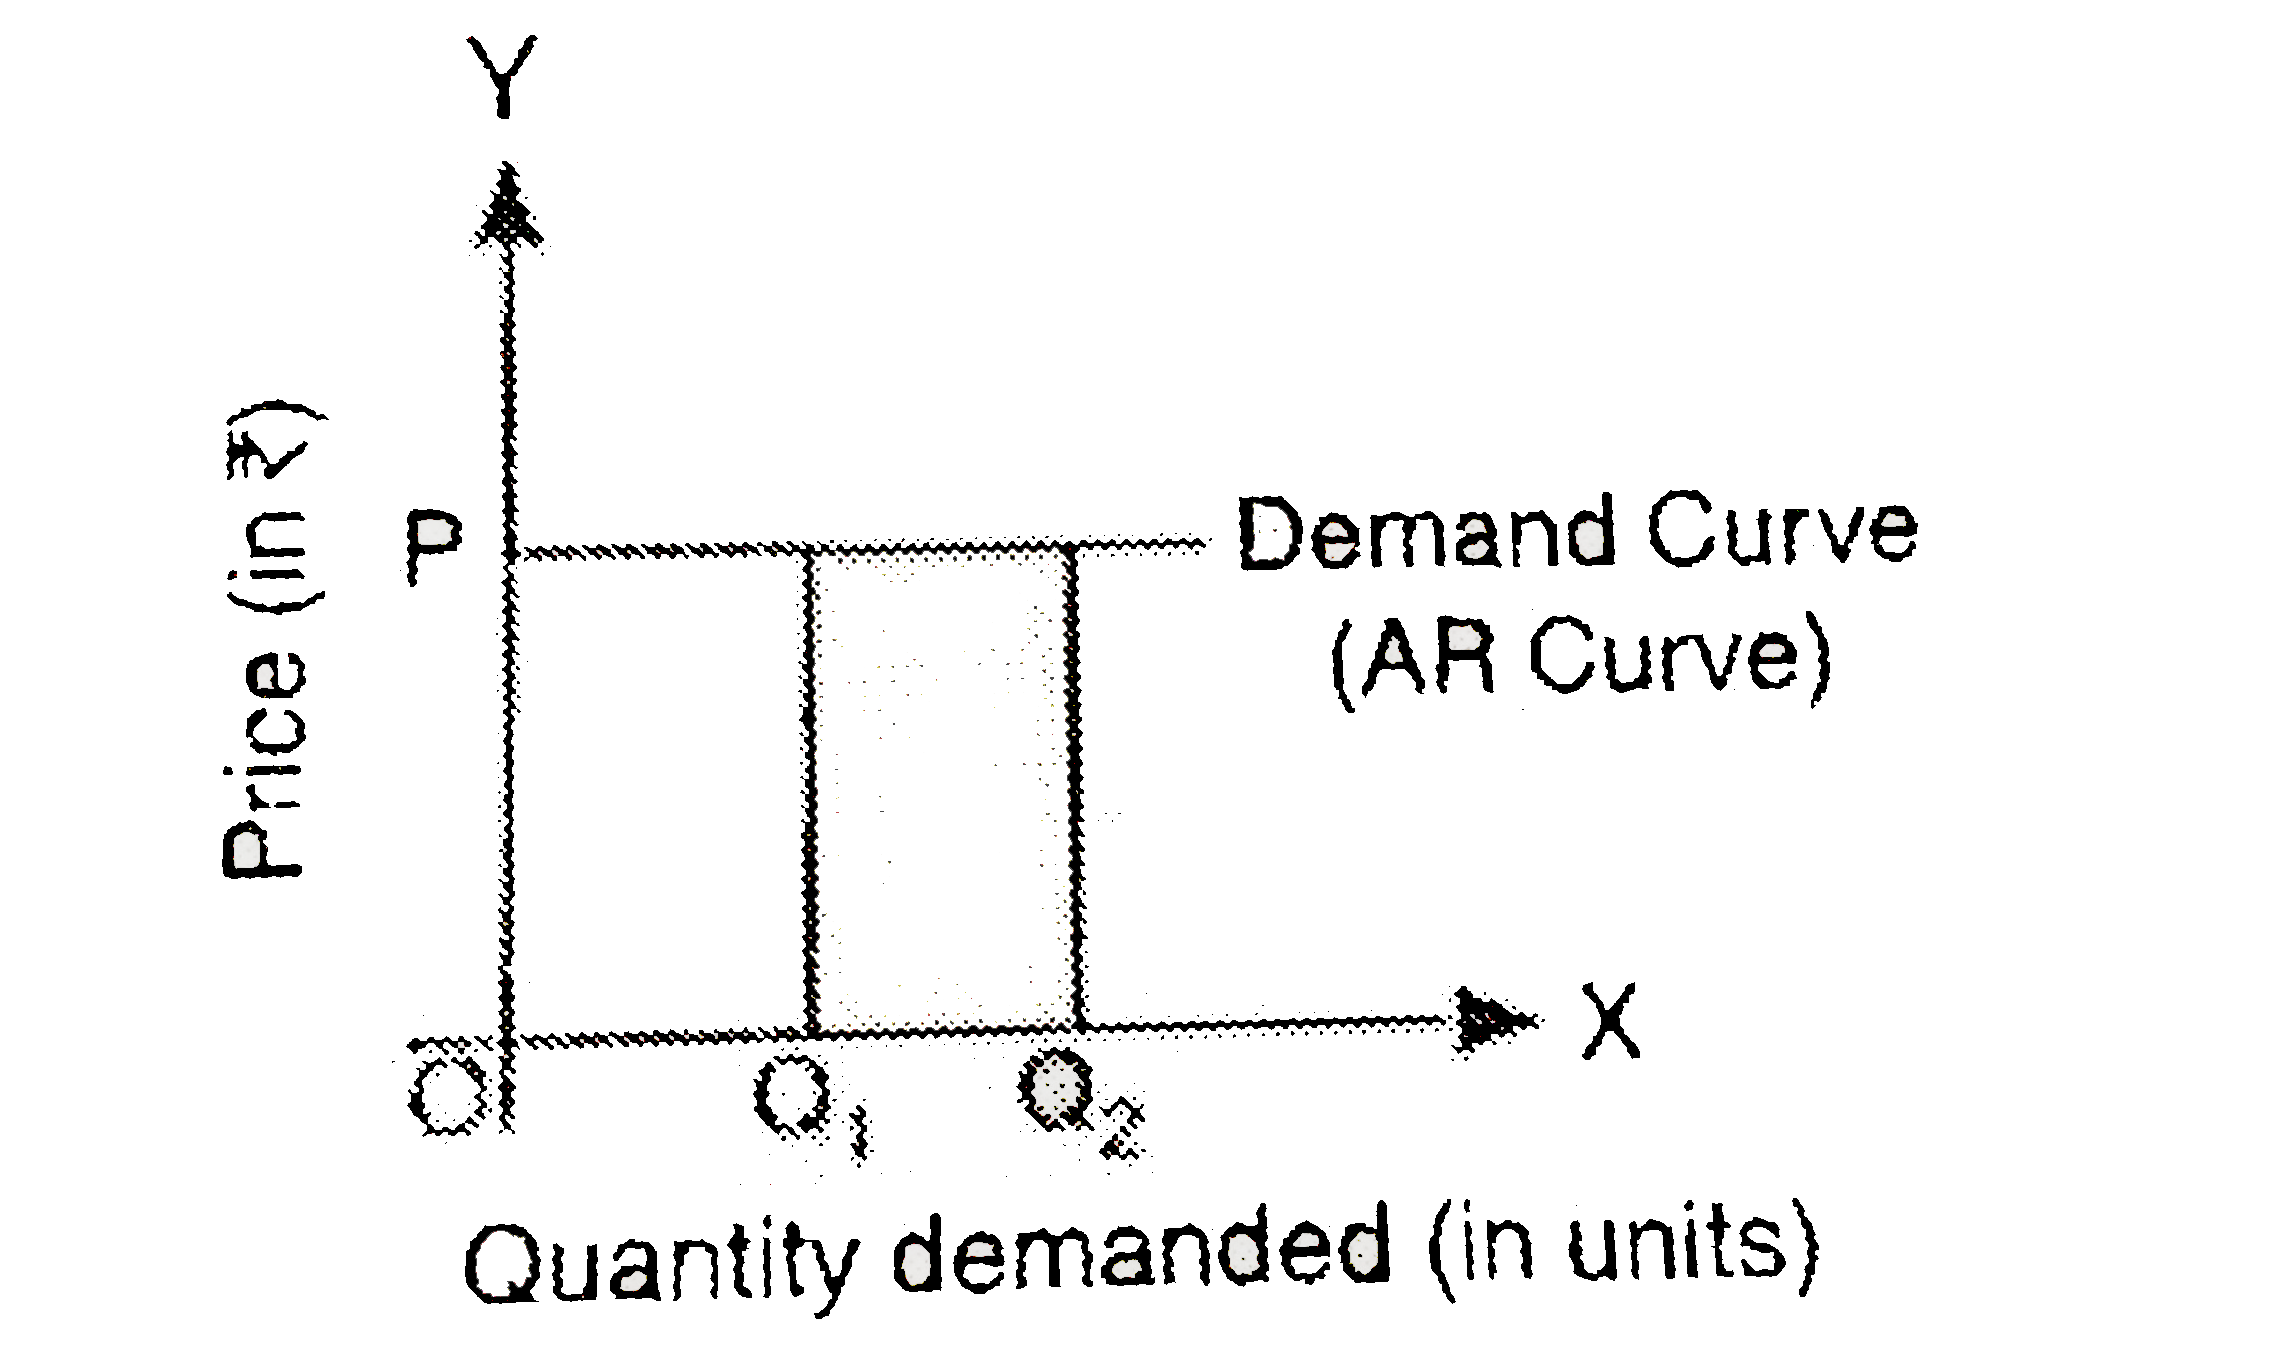 APerfect competitionBMonopolist CompetitionCMonopolyDOligopoly
Phasor diagram & energy OF SHM
View SolutionUsing the sine rule , prove the cosine rule.
View SolutionPhasor diagram of a series AC circuit is shown in figure. Then,
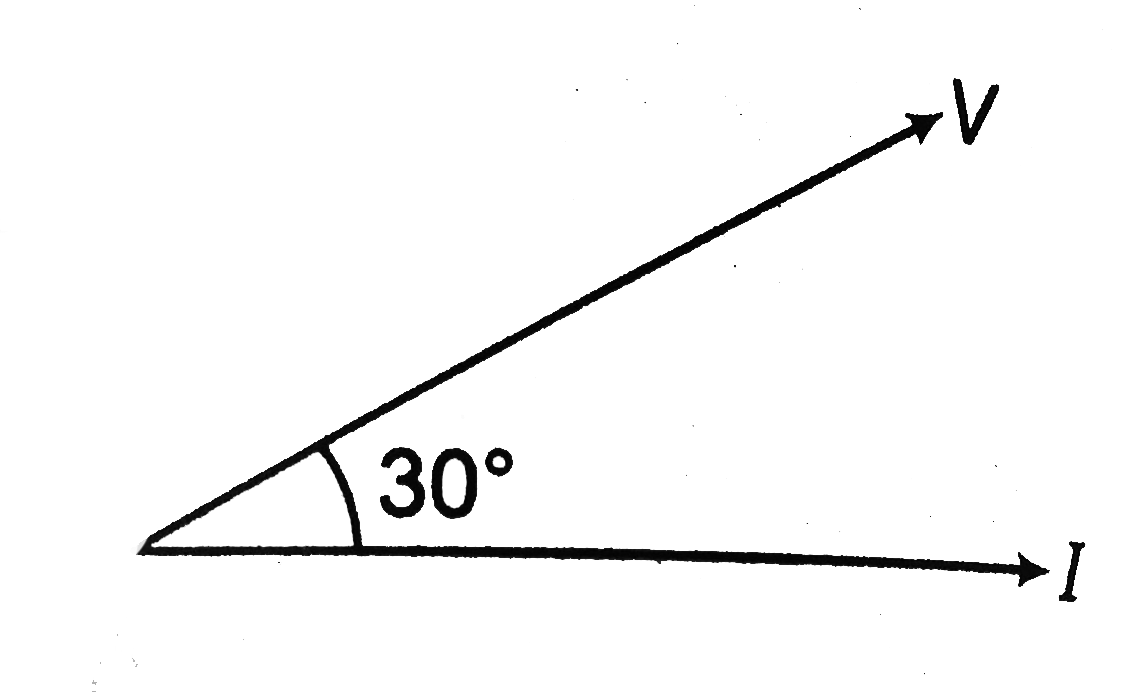 View Solution
In the figure, which of the phasor diagrams represents RLC circuit driven at resonance?
View SolutionThe following figure represents a set of persons-the triangle represents educated persons, the rectangle represents policemen, the ellipse. represents road tax payers and cirde represents shopkeepers.

The following questions are based on the above diagram.
According to this figure, it follows thatView Solution


