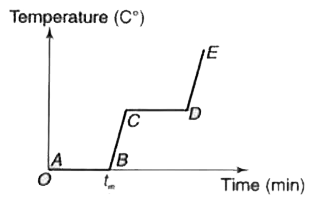
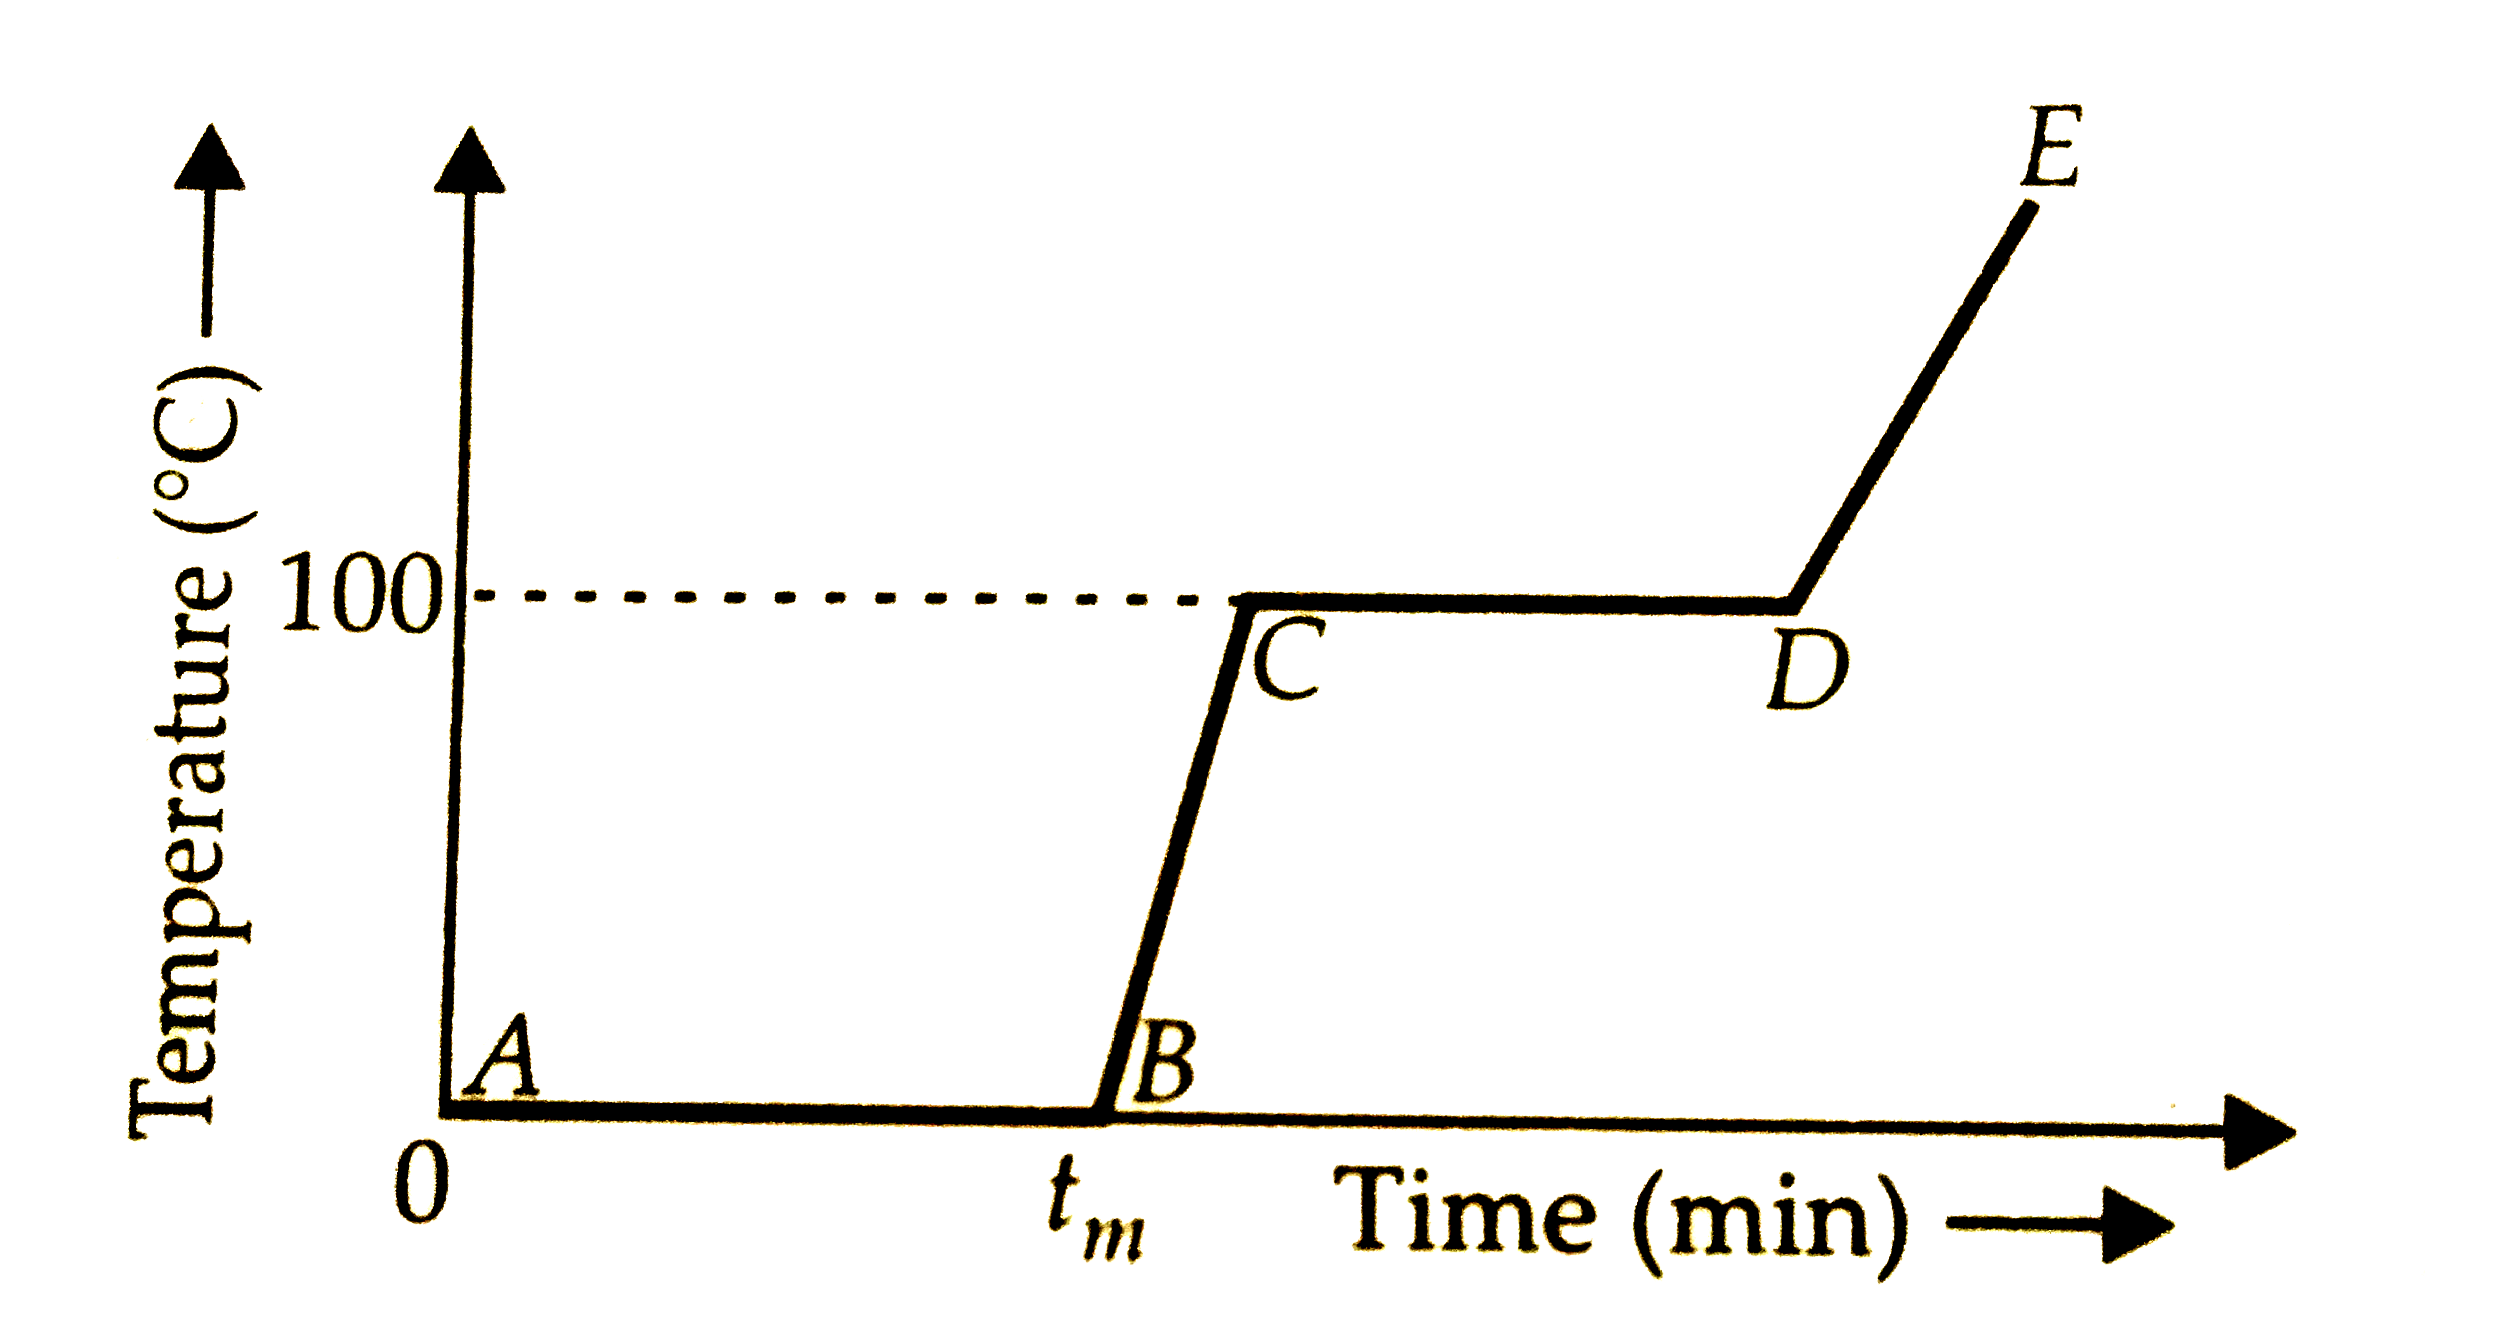
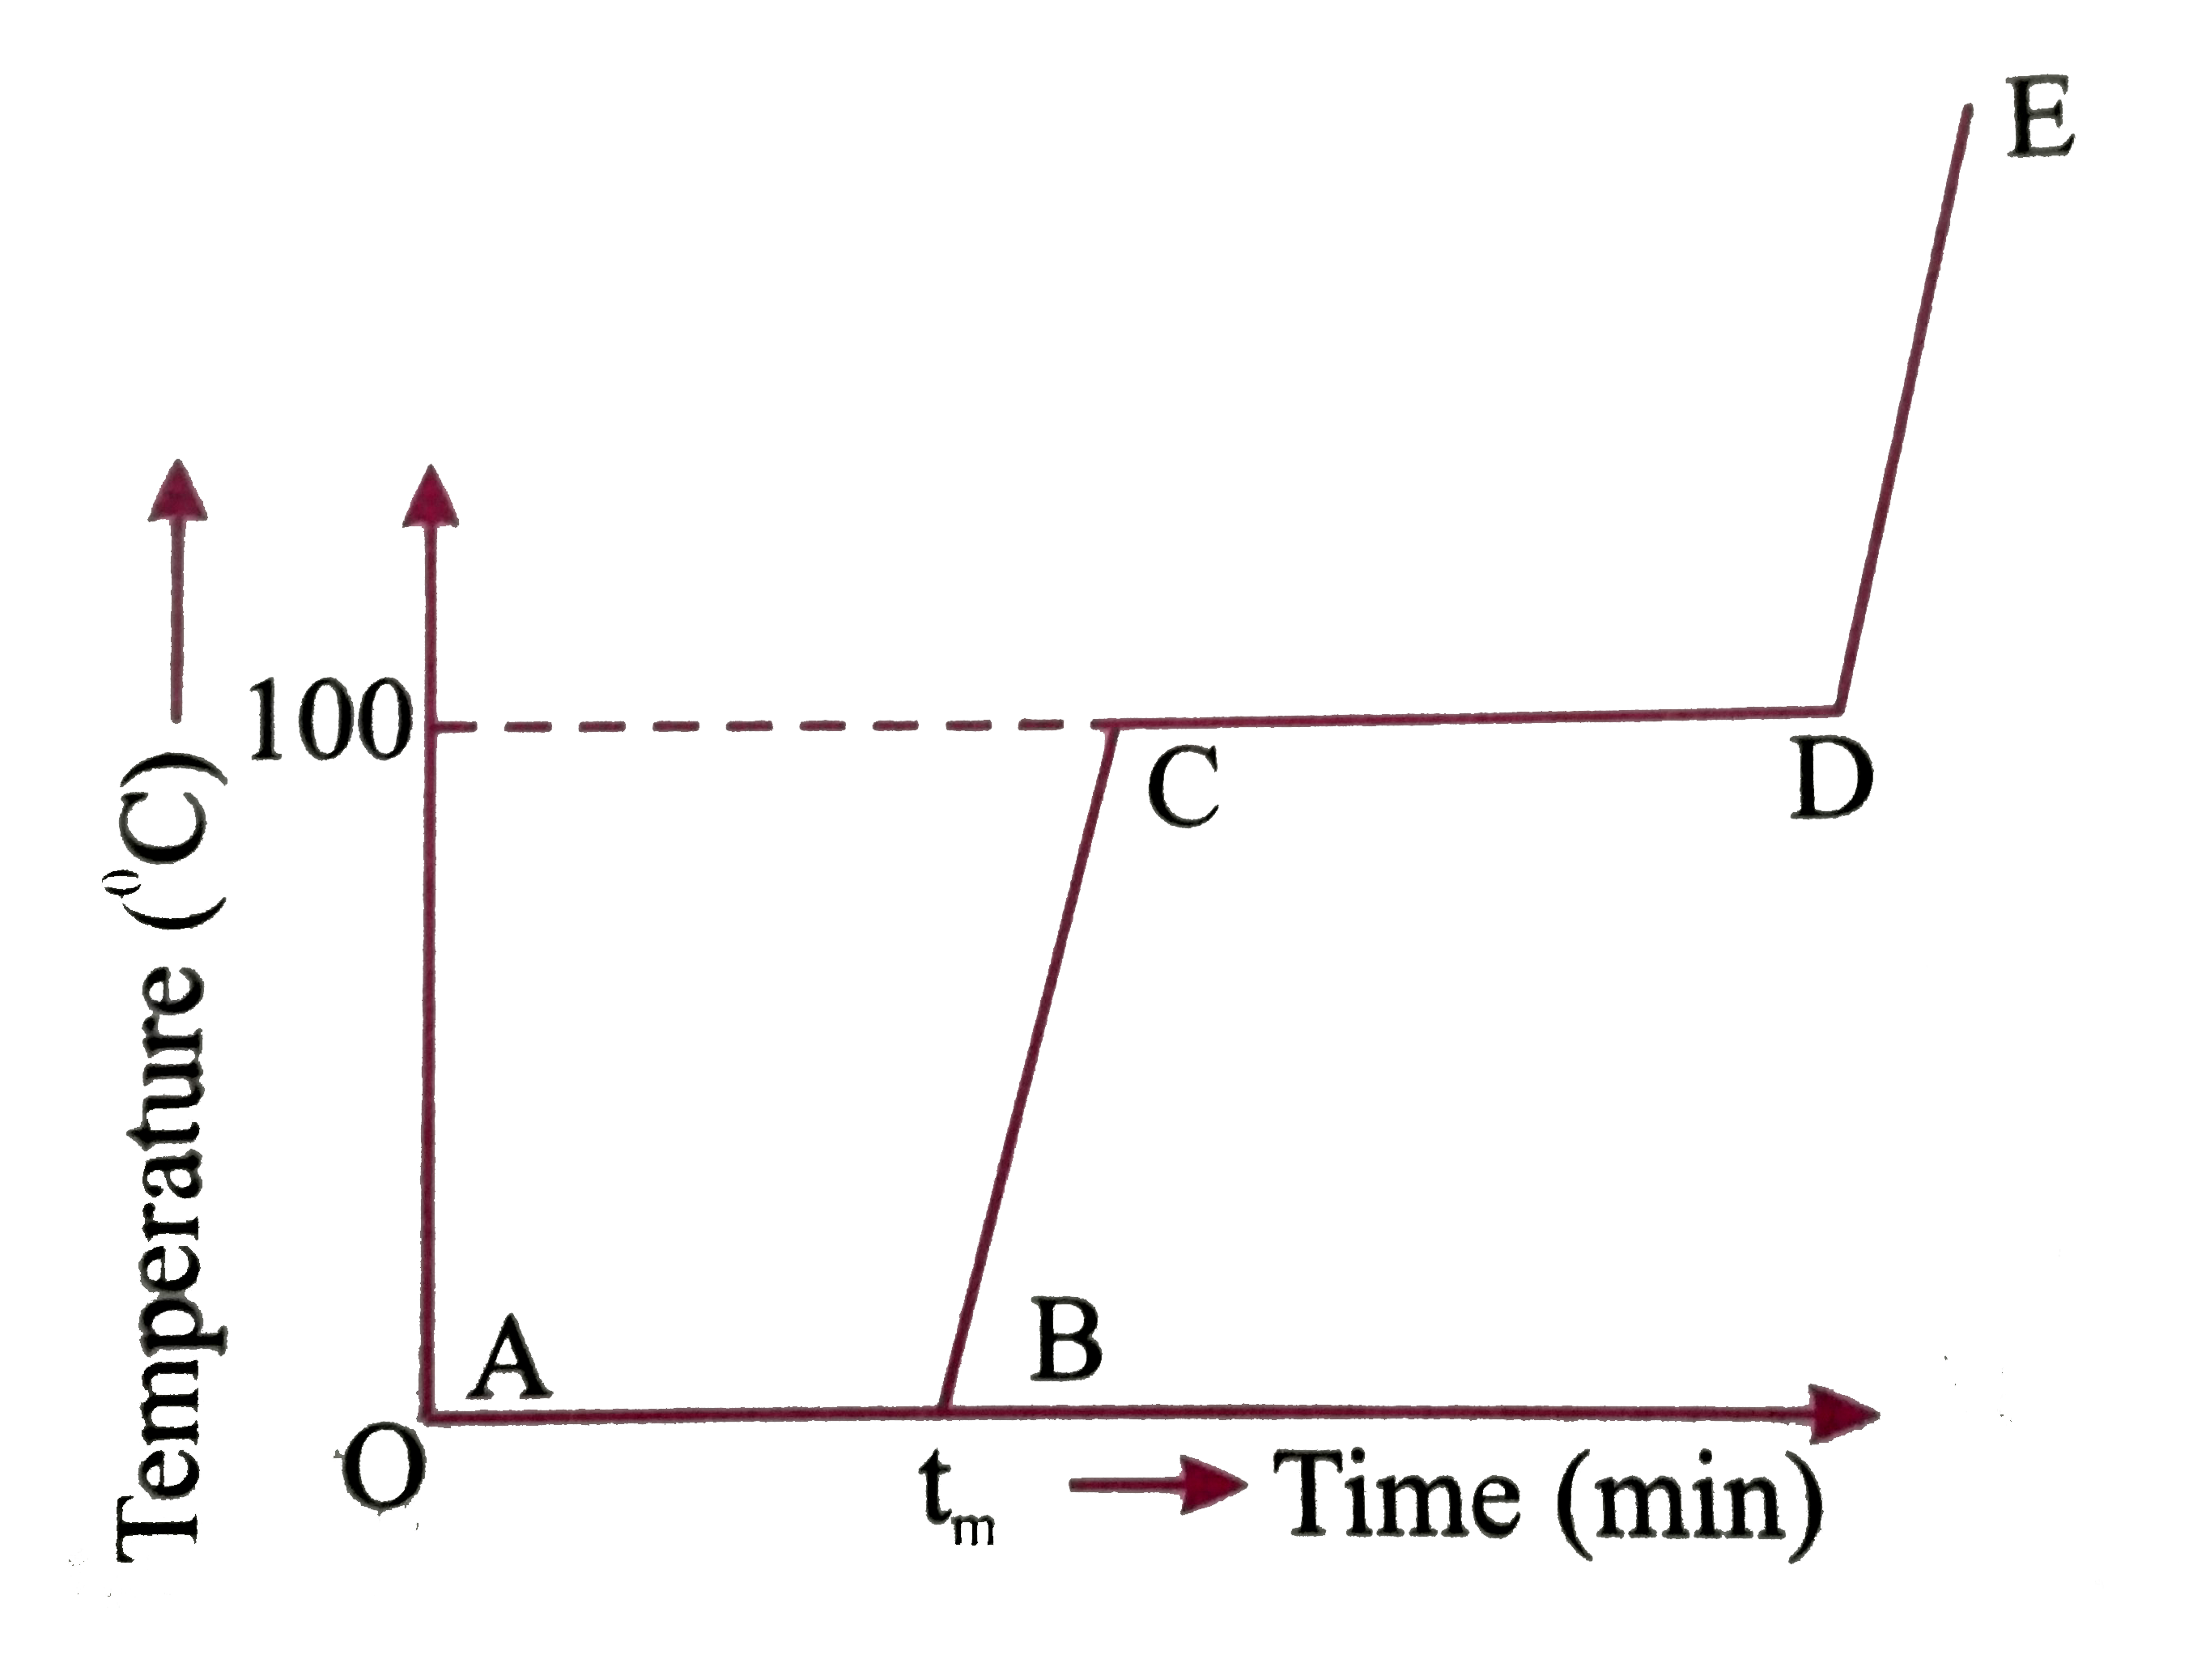
Refer to the plot of temperating versus time showing the changes in the state of ice on heating (not of scale)

Which of the following is correct :
A
The region AB represents ice & water in thermal equilibrium
B
At B water stats boiling
C
At C all the water gets converted into steam
D
C-D represents water & steam in equilibrium at boiling point.
Text Solution
In the given graph, the region AB represents no change the temperature with time. It means ICE & water are in thermal equilibrium.
|
Topper's Solved these Questions
- PROPERTIES OF MATTERBOOK - CBSE COMPLEMENTARY MATERIALCHAPTER - PROPERTIES OF MATTEREXERCISE - NUMERICALS
23 Videos
- NEWTON'S LAWS OF MOTIONBOOK - CBSE COMPLEMENTARY MATERIALCHAPTER - NEWTON'S LAWS OF MOTIONEXERCISE - Laws Of Motion
20 Videos
- ROTATIONAL MOTION BOOK - CBSE COMPLEMENTARY MATERIALCHAPTER - ROTATIONAL MOTION EXERCISE - MULTIPLE CHOICE QUESTIONS
20 Videos
Similar Questions
Knowledge Check
Refer to the plot of temperature versus time, showing the changes in the state of ice on heating (not to scale).

which of the following is correct ?AThe region AB represents steam and water in thermal equilibriumBAt B water starts boilingCAt C all the water gets converted into steamDC and D represent water and steam in equilibrium at boiling pointRefer to the plot of temperature versus time showing the changes in the state of ice on heating (not to scale).

Which of the following is correct ?AAB represents ice and water are not in the thermal equilibriumBAt B water starts boiling.CAt C all the water gets converted into steam.DCD represents water and steam in equilibrium at boiling point.Refer to the plot of temperature versus time showing the changes in the state of ice on heating (not to scale).

Which of the following is correct ?AAB represents ice and water are not in the thermal equilibriumBAt B water starts boiling.CAt C all the water gets converted into steam.DCD represents water and steam in equilibrium at boiling point.
Which of the following plots is/are correct?
View SolutionWhich of the following plots is/are correct?
View SolutionWhich of the following plots is/are correct?
View SolutionRefer to the plot of temperature versus time (figure) showing the changes in the state if ice on heating (not to scale). Which of the following is correct ?
 .
.
View SolutionWhich of the following plots are correct ?
View Solution
