51 students from a locality use different modes of transport to school, as shown by the bar graph given below:
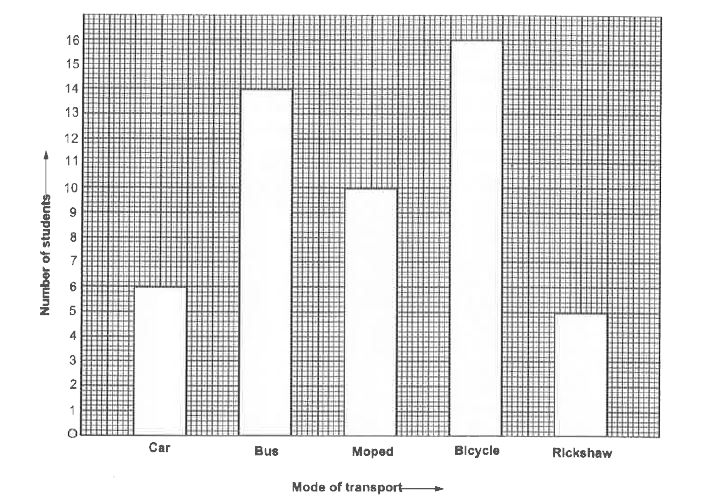
Look at the bar graph given above and answer the question given below:
What does the above bar graph show ?
Which mode of transport is used by maximum number of students ?
How many students use bus for going to school ?
How many students of the locality do not use bus for going to school ?
The correct Answer is:(i) The given bar graph shows the different modes of transport to school used by 51 students of locality.
(ii) Maximum number of students use bicycle for going to school .
(iii) 14 students use bus for going to school.
(iv) 37 students do not use bus for going to school.
Step by step video, text & image solution for 51 students from a locality use different modes of transport to school, as shown by the bar graph given below: Look at the bar graph given above and answer the question given below: What does the above bar graph show ? Which mode of transport is used by maximum number of students ? How many students use bus for going to school ? How many students of the locality do not use bus for going to school ? by Maths experts to help you in doubts & scoring excellent marks in Class 6 exams.
Topper's Solved these Questions
- BOOK - RS AGGARWALCHAPTER - BAR GRAPH EXERCISE - EXERCISE4videos
BAR GRAPH
- BOOK - RS AGGARWALCHAPTER - ANGLES AND THEIR MEASUREMENTEXERCISE - EXERCISE D13videos
ANGLES AND THEIR MEASUREMENT
- BOOK - RS AGGARWALCHAPTER - CIRCLESEXERCISE - C. WRITE T FOR TRUE AND F FOR FALSE FOR EACH OF THE STATEMENTS GIVEN BELOW:1videos
CIRCLES
Similar Questions
70 students from a locality use different modes of transport to go to school as given below:

Draw the bar graph representing the above data.View Solution70 students from a locality use different modes of transport to go to school as given below:
 Draw the bar graph representing the above data.View Solution
Read the bar graph given below and answer the following questions:
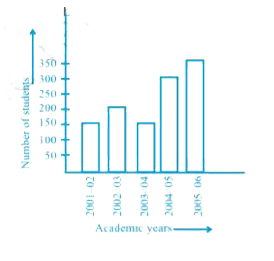
What information is given by the þar graph?View SolutionStudy the following bar graph and answer the questions given below.
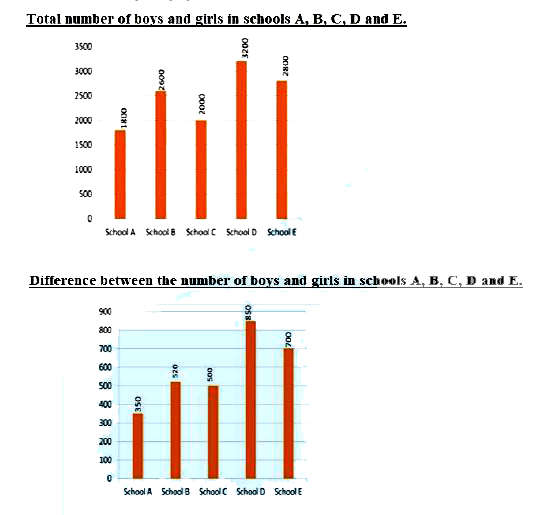
What is the ratio of numbers of boys to the number of girls in school E?View Solution51 students from a locality use different modes of transport to go to school as shown by the bar graph given below.
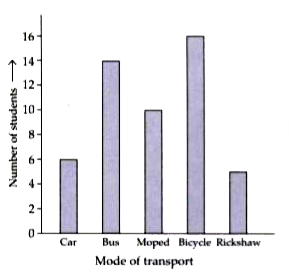
Assertion : Bicycle is used by maximum number of students.
Reason : Height of bar corresponding to bicycle is maximum. So, most students use bicycle to go to school.View SolutionRead the bar graph given below and answer the following questions:
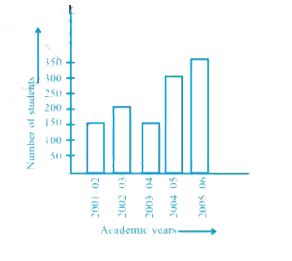
In which year is the number of students maximum?View SolutionLook at the bar graph given below.
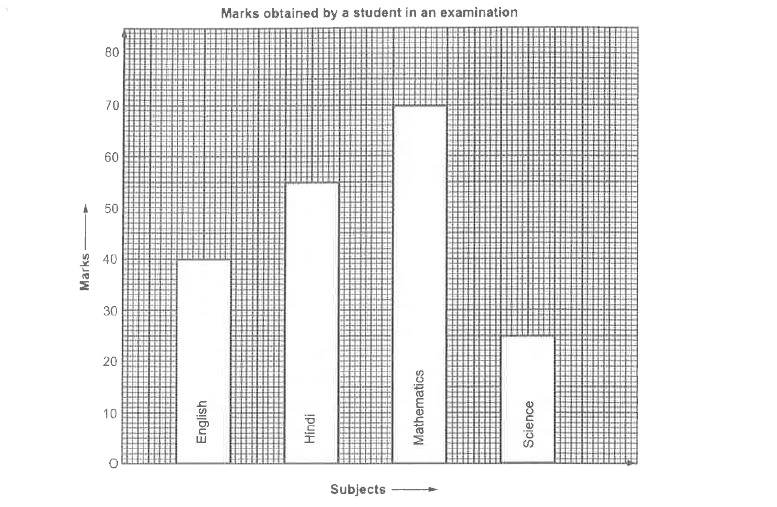
Read if cerefully and answer the questions given below:
What information does the bar graph give ?
In which subject is the student poorest ?
In which subject is the student best ?
In which subjects did he get more than 40 marks ?View SolutionStudy the following bar graph and answer the questions given below.
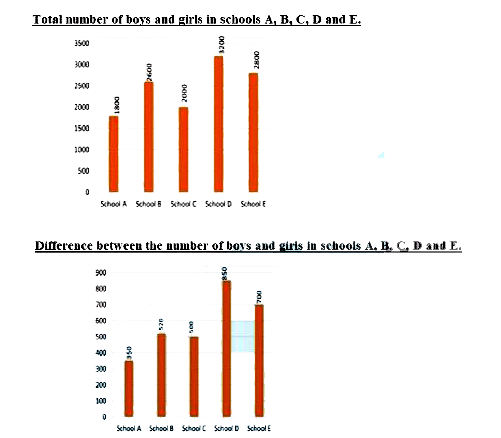
The number of boys in school B is what percentage of the total number of students in that school ?View SolutionStudy the following bar graph and answer the questions given below
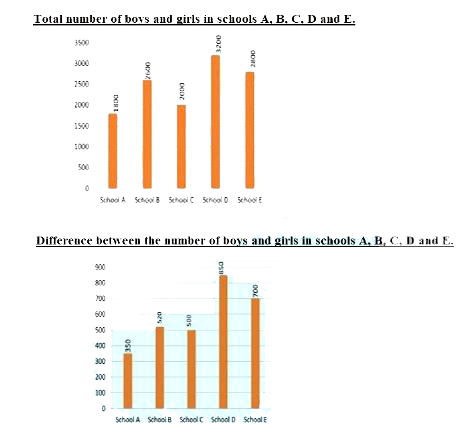
What is the difference the number of girls in school A and the number of girls in school C?View SolutionRead the given bar graph, showing the number of games played by different number of students of a school.
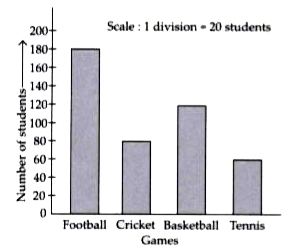
How many students play Cricket and Tennis together ?View Solution

