The following graph shows the speed ofabody which is :
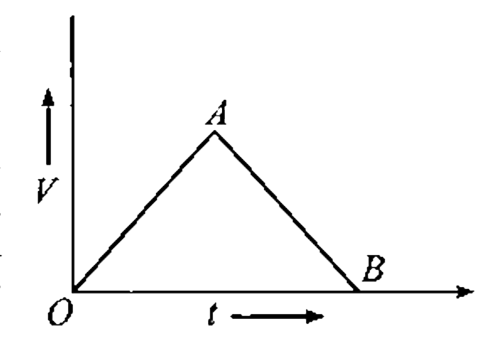
Projected upwards with some velocity in vertical plane
Having only constant accelerated motion
Having only the constant retardation
A perfectly elastic ball falling from a height on a fnction less and hard floor
The correct Answer is:D
Step by step video, text & image solution for The following graph shows the speed ofabody which is : by Physics experts to help you in doubts & scoring excellent marks in Class 11 exams.
Topper's Solved these Questions
- BOOK - PHYSICS GALAXY - ASHISH ARORACHAPTER - KINEMATICSEXERCISE - Numerical111videos
KINEMATICS
- BOOK - PHYSICS GALAXY - ASHISH ARORACHAPTER - KINEMATICSEXERCISE - Advance MCQs with One or More Options Correct17videos
KINEMATICS
- BOOK - PHYSICS GALAXY - ASHISH ARORACHAPTER - KINEMATICSEXERCISE - Discussion Question18videos
KINEMATICS
- BOOK - PHYSICS GALAXY - ASHISH ARORACHAPTER - GRAVITATIONEXERCISE - Unsolved Numerical94videos
GRAVITATION
- BOOK - PHYSICS GALAXY - ASHISH ARORACHAPTER - LINEAR MOMENTUM & ITS CONSERVATIONEXERCISE - exercise 1.33videos
LINEAR MOMENTUM & ITS CONSERVATION
Similar Questions
The following graph shows the sales of cars (in thousands) in four cities in 4 years. Study the graph and answer the question.
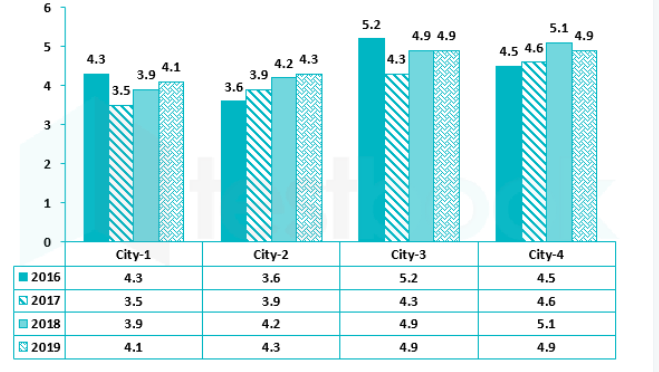
Which city has the highest sales?View SolutionThe following graph shows the sales of cars (in thousands) in four cities in 4 years. Study the graph and answer the question
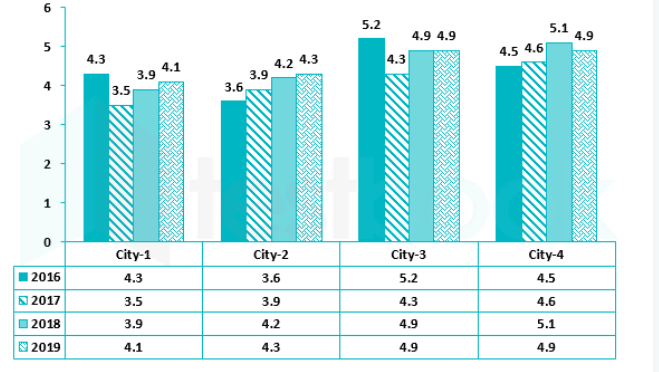
In which year. the sales are highest?View Solution
Knowledge Check
- Question 1 - Select One
The following graph show that the reaction is:
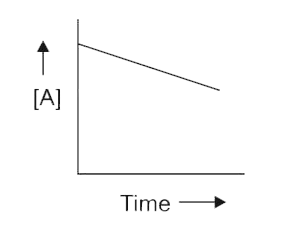 Azero orderBfirst orderCsecond orderDfractional order
 - Question 2 - Select One
The current is an induction coil varies with time t, according to the graph shown in figure. Which of the following graphs shows the induced emf (e) in the coil with time.
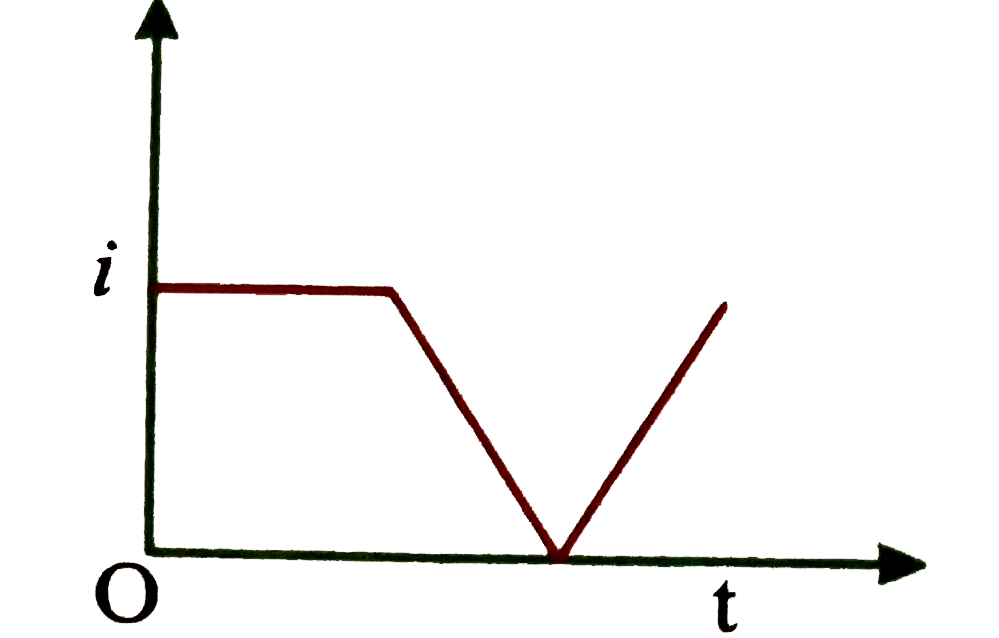 A
A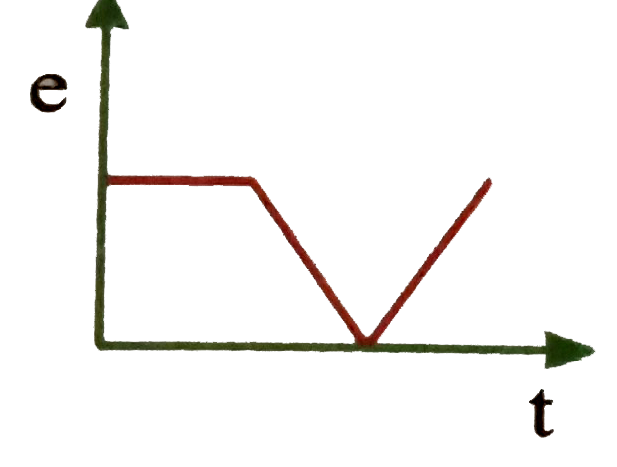 B
B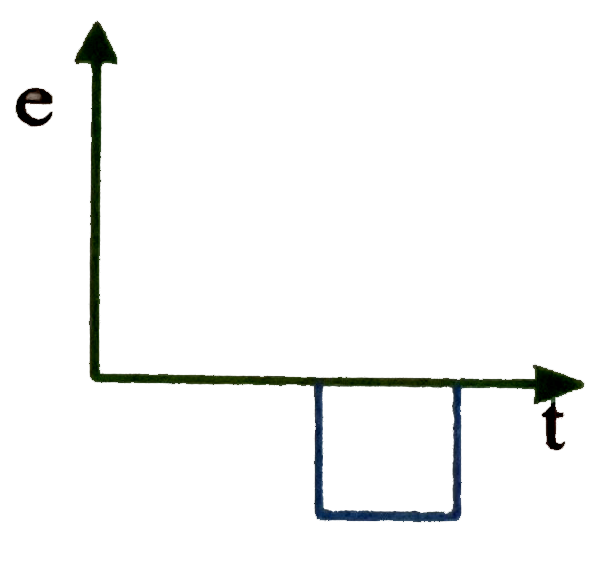 C
C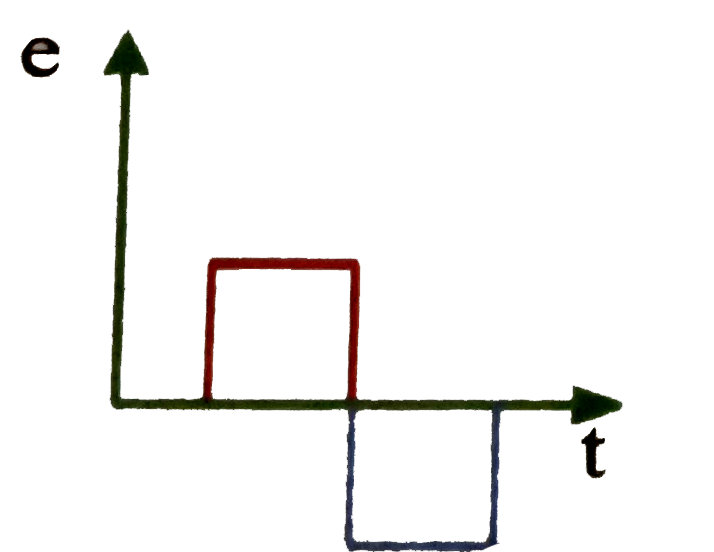 D
D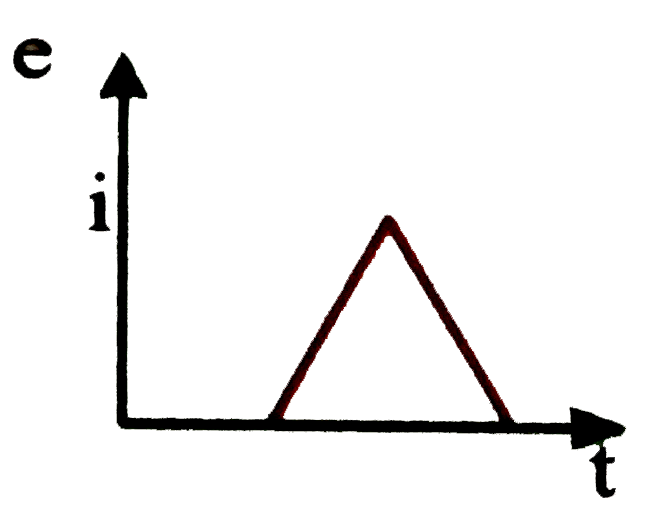
- Question 3 - Select One
Which of the following graphs show the v−t graph of a ball thrown upwards ?
A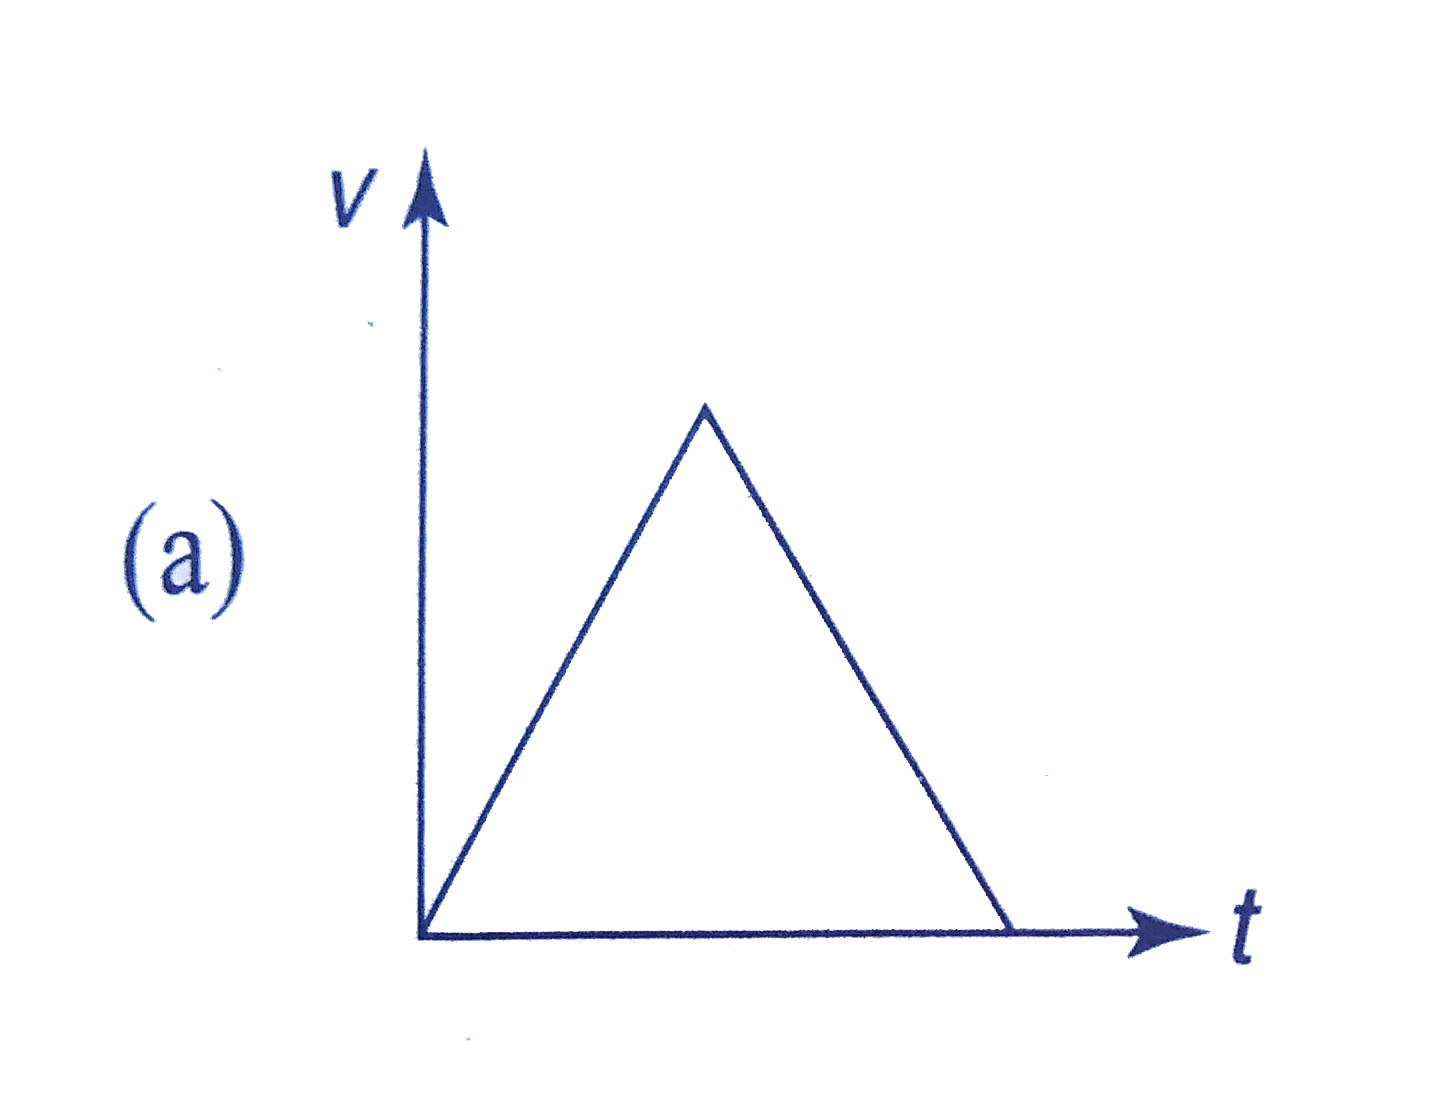 .B
.B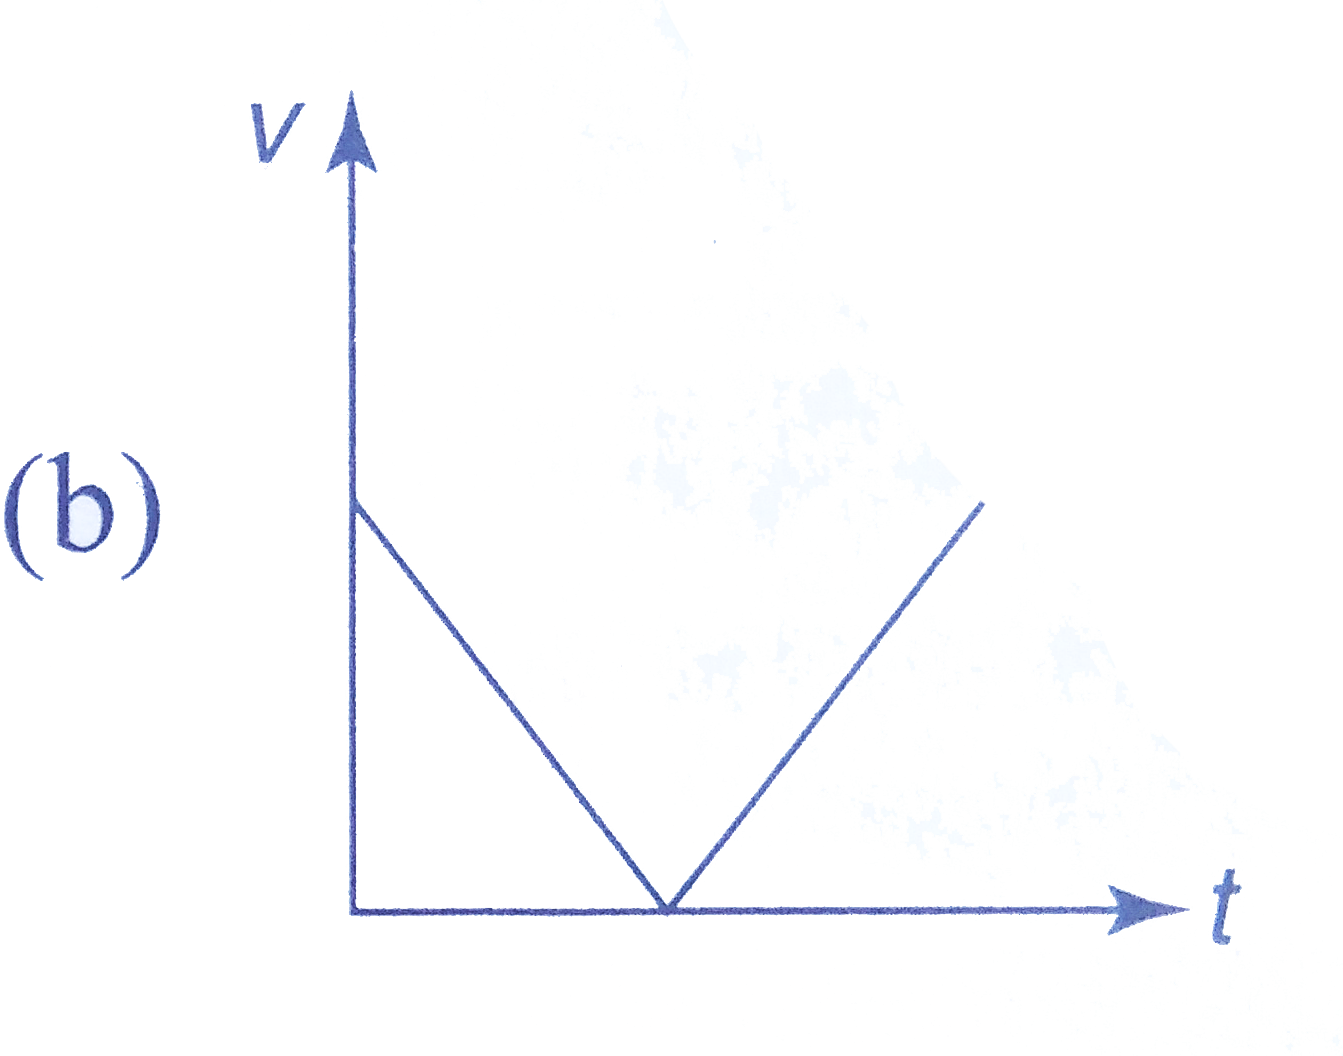 .C
.C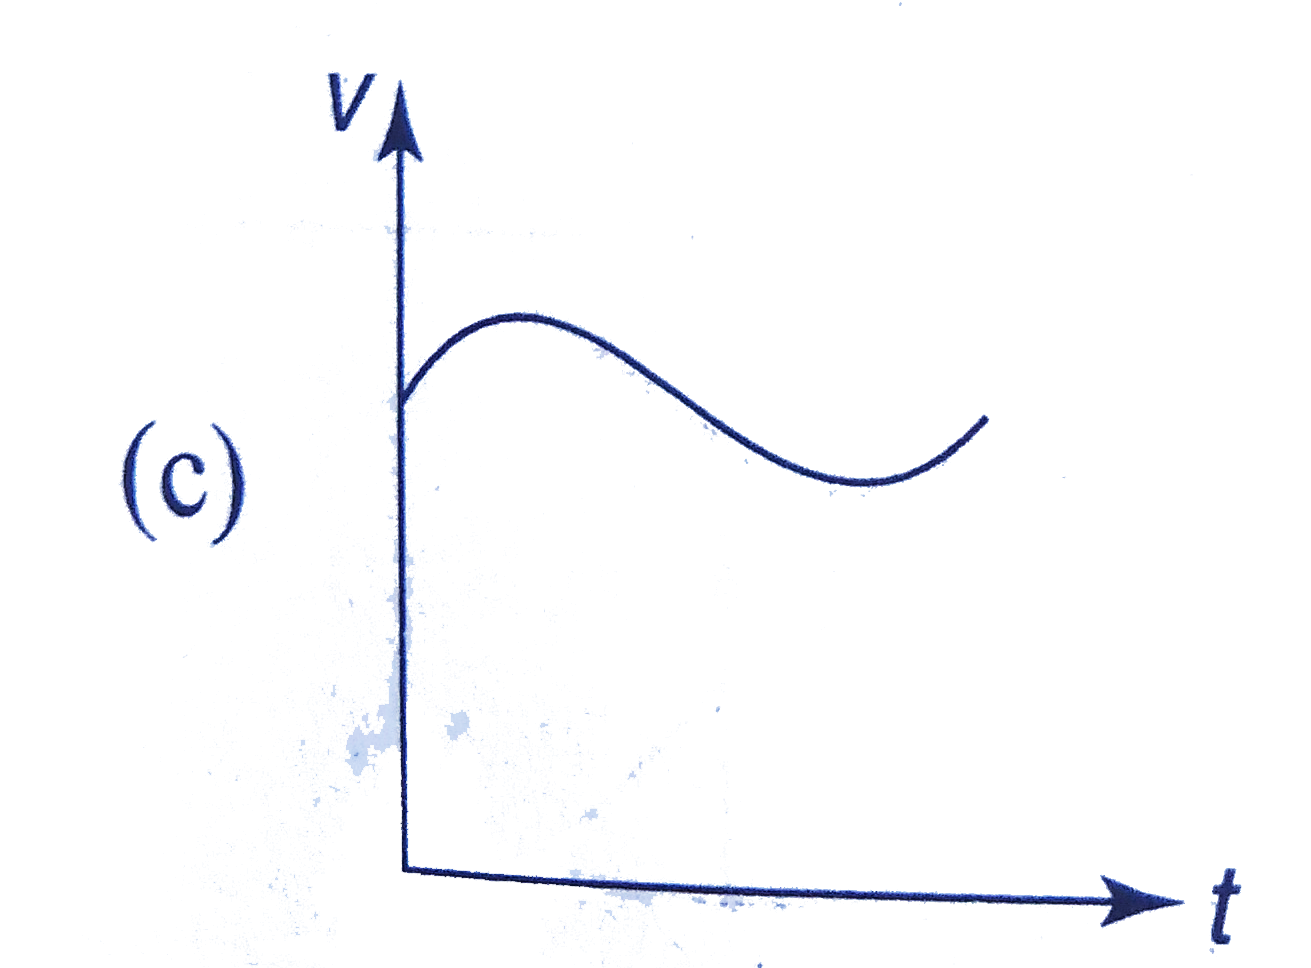 .D
.D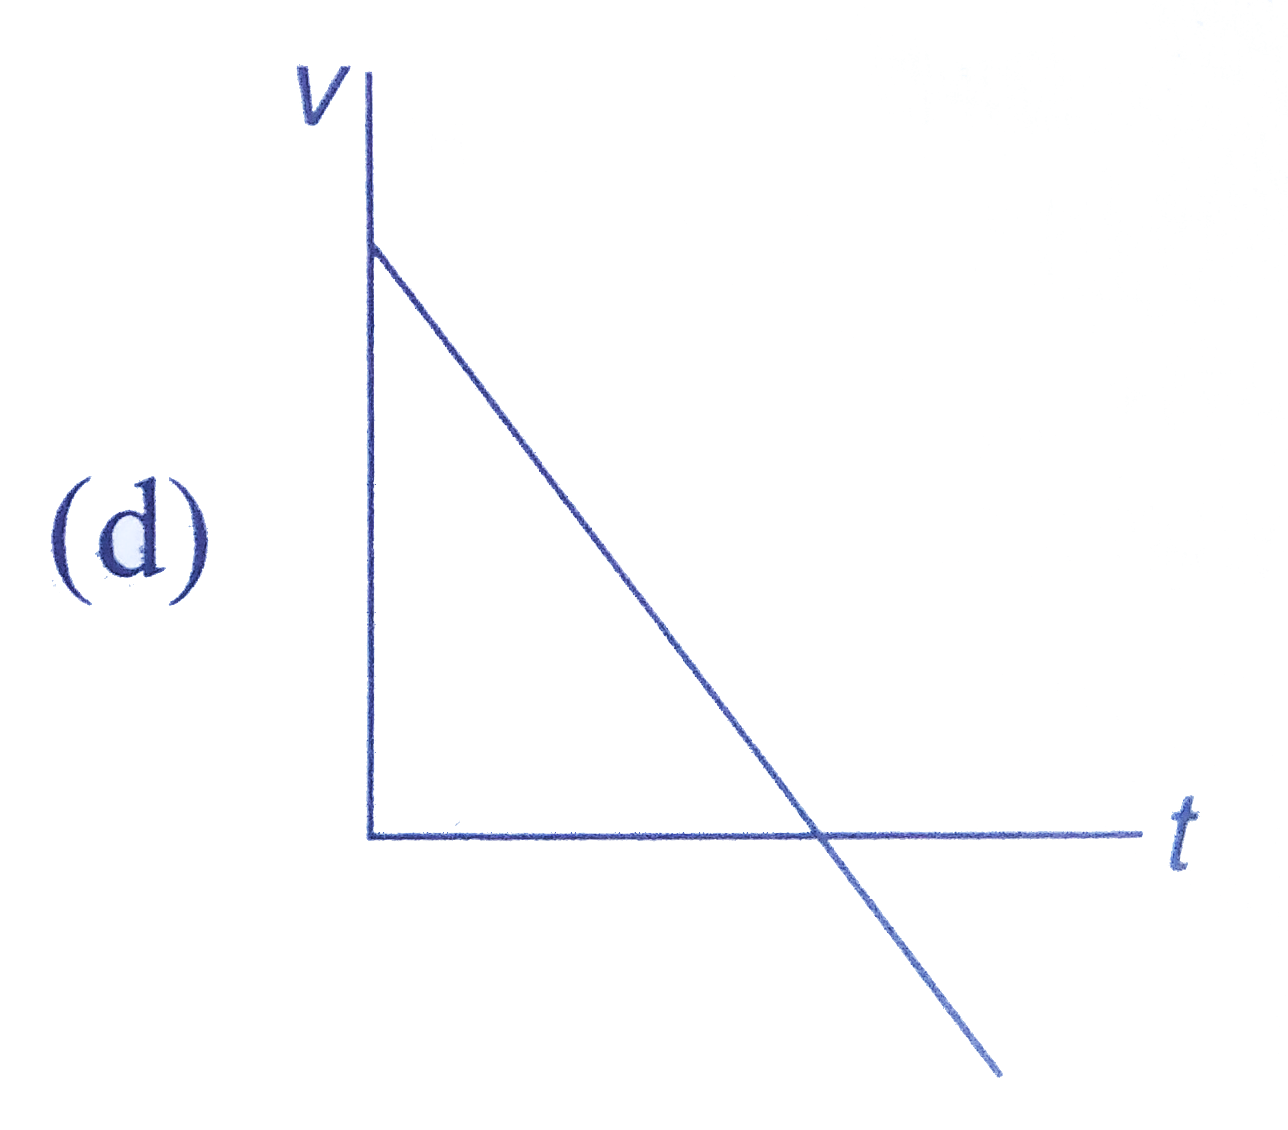 .
.
Which of the following graphs shows the type of natural selection which favours polymorphisms ?
View SolutionFollowing graph shows the income of a company in six different years. Study the graph , carefully and answer the questions that follow.
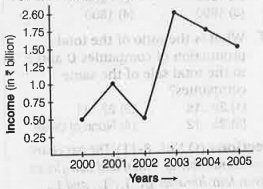
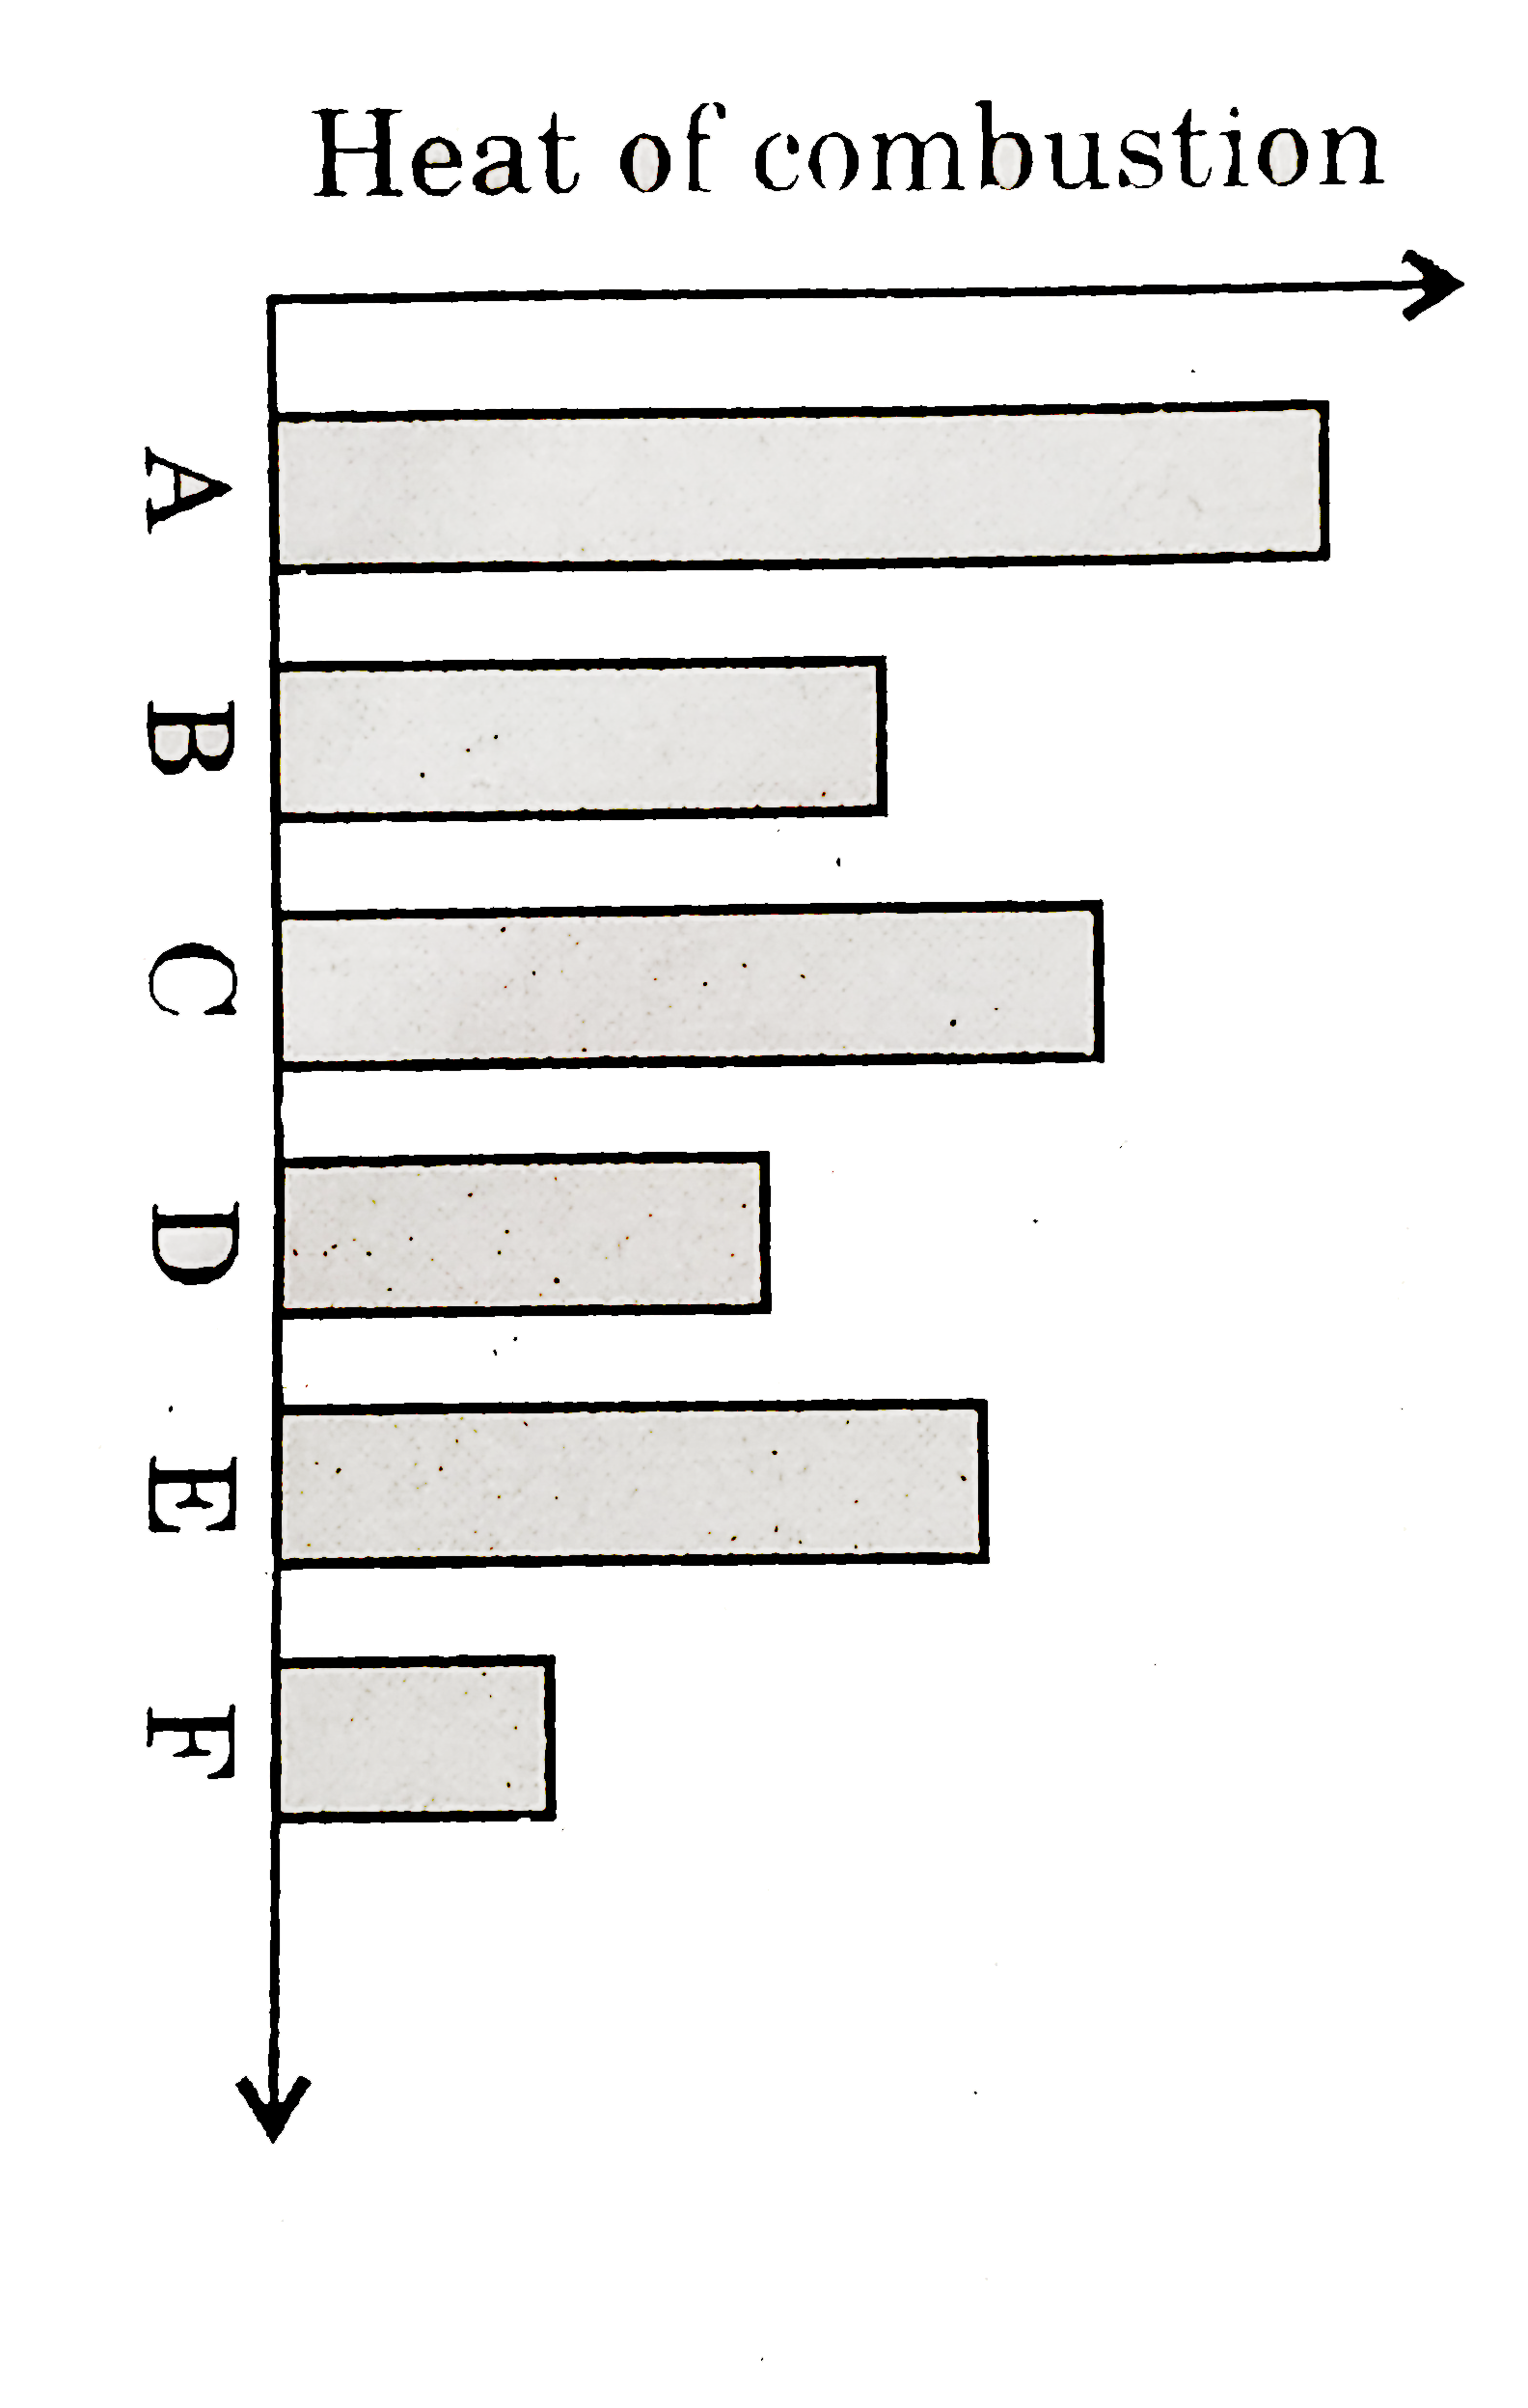
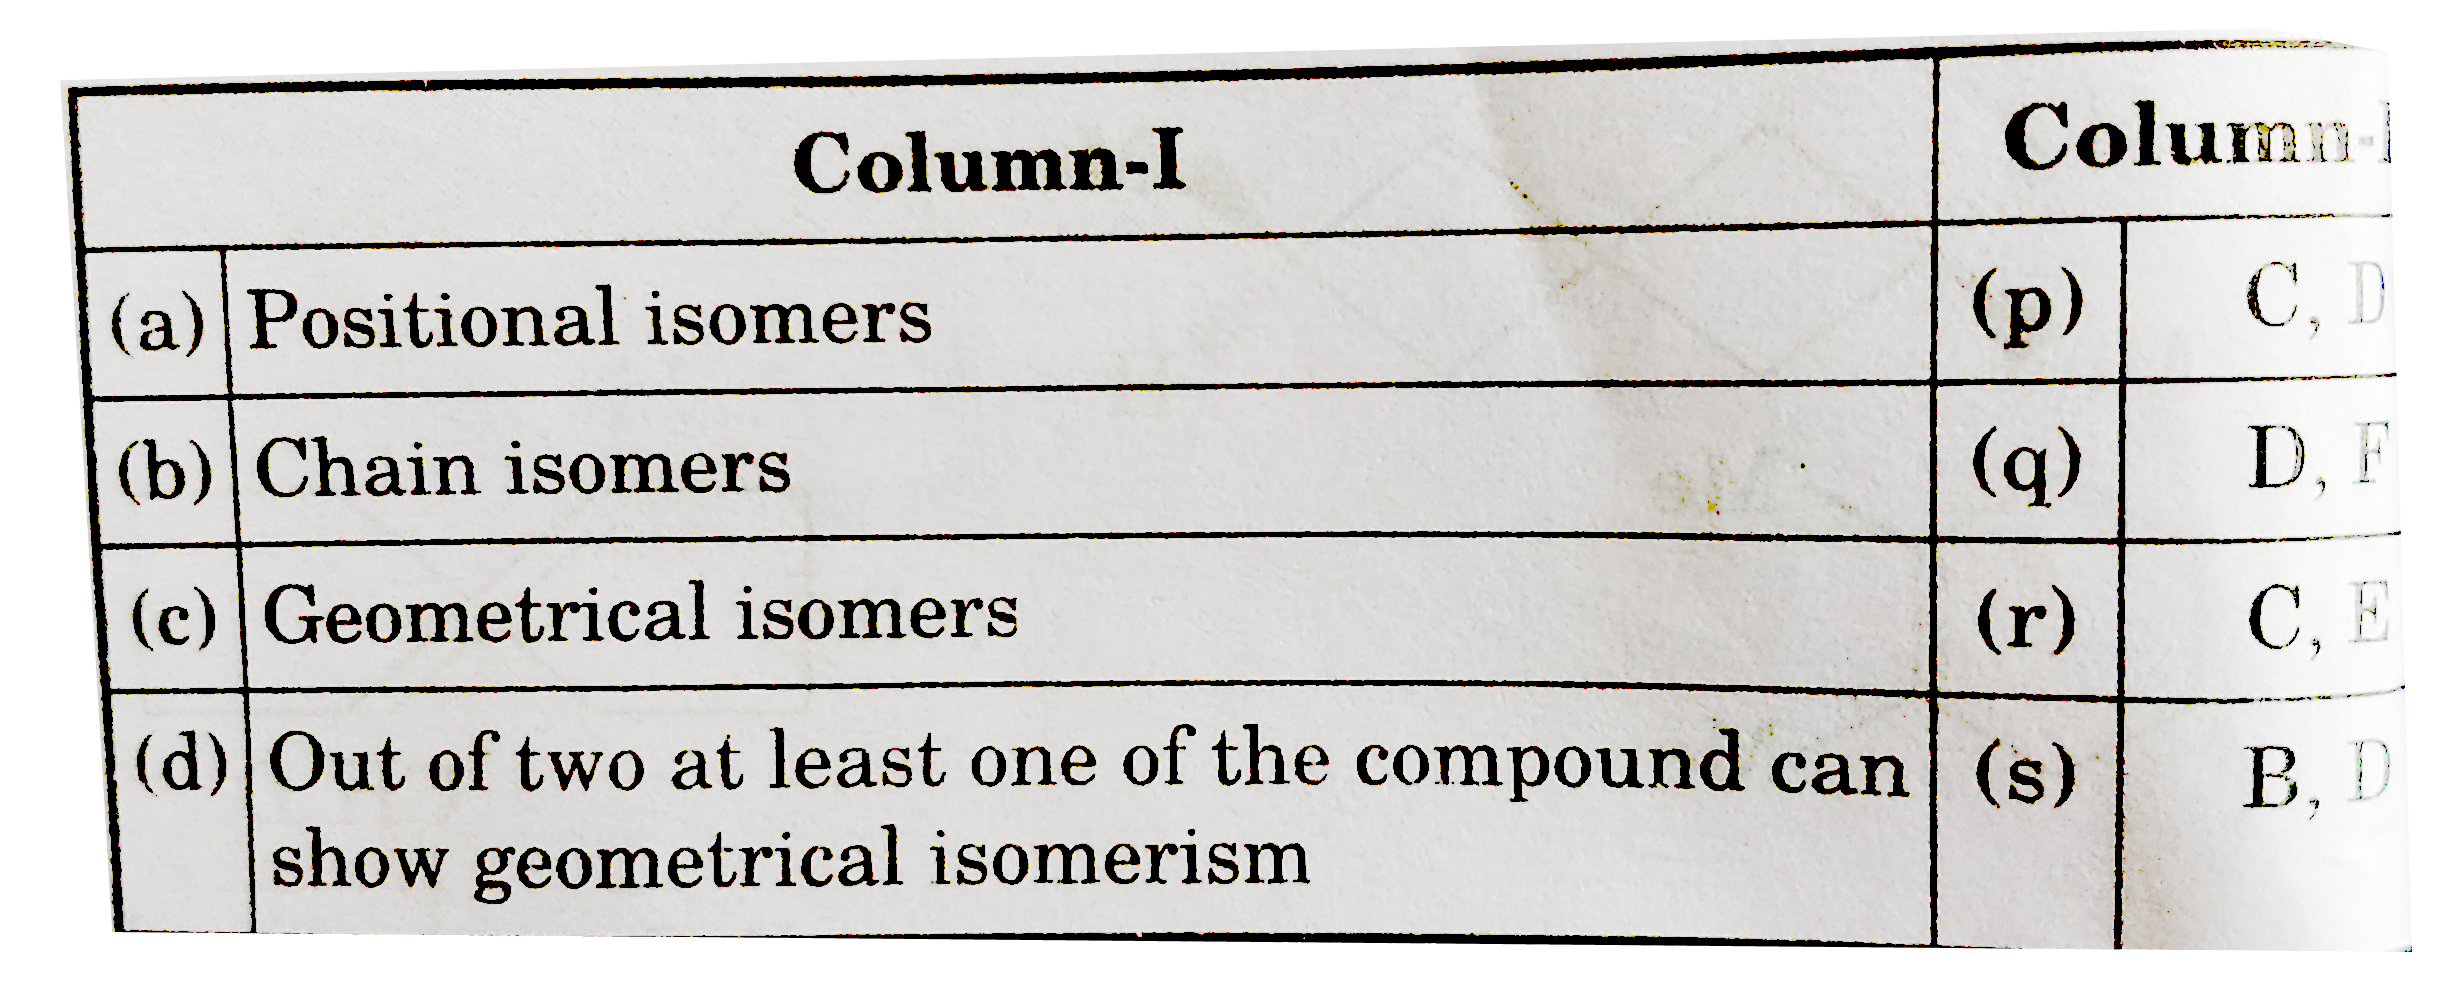
In which year income of the company is the highest?View SolutionConsider the following graph which shows heat of coubustions of isomeric pentenes and match the following.
 View Solution
Which of the following graph shows the variationi of density of water increase in temperature ?
View SolutionWhich of the following graphs shows the correct description of effect of pH on enzyme activity?
View Solution

