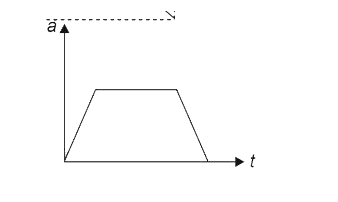
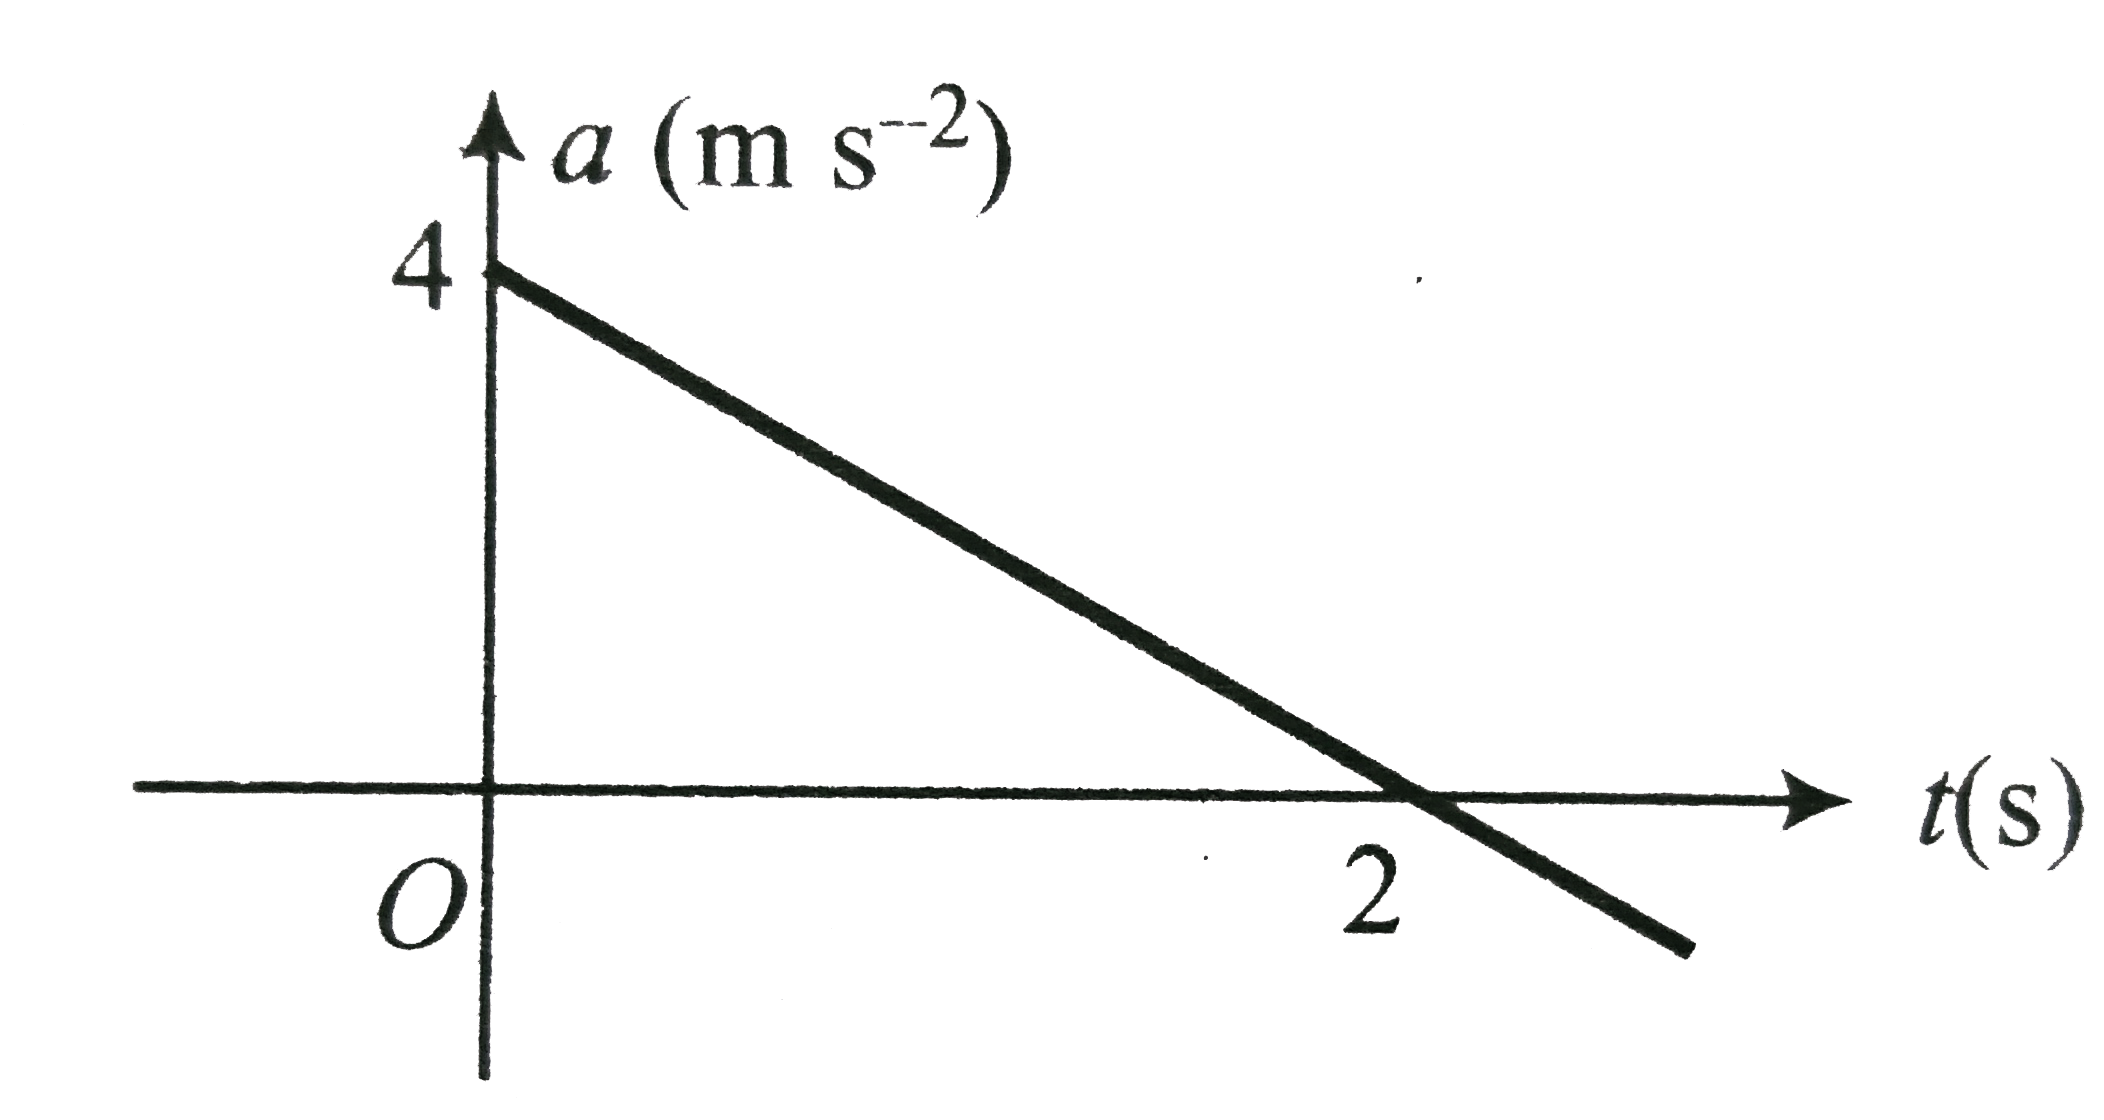
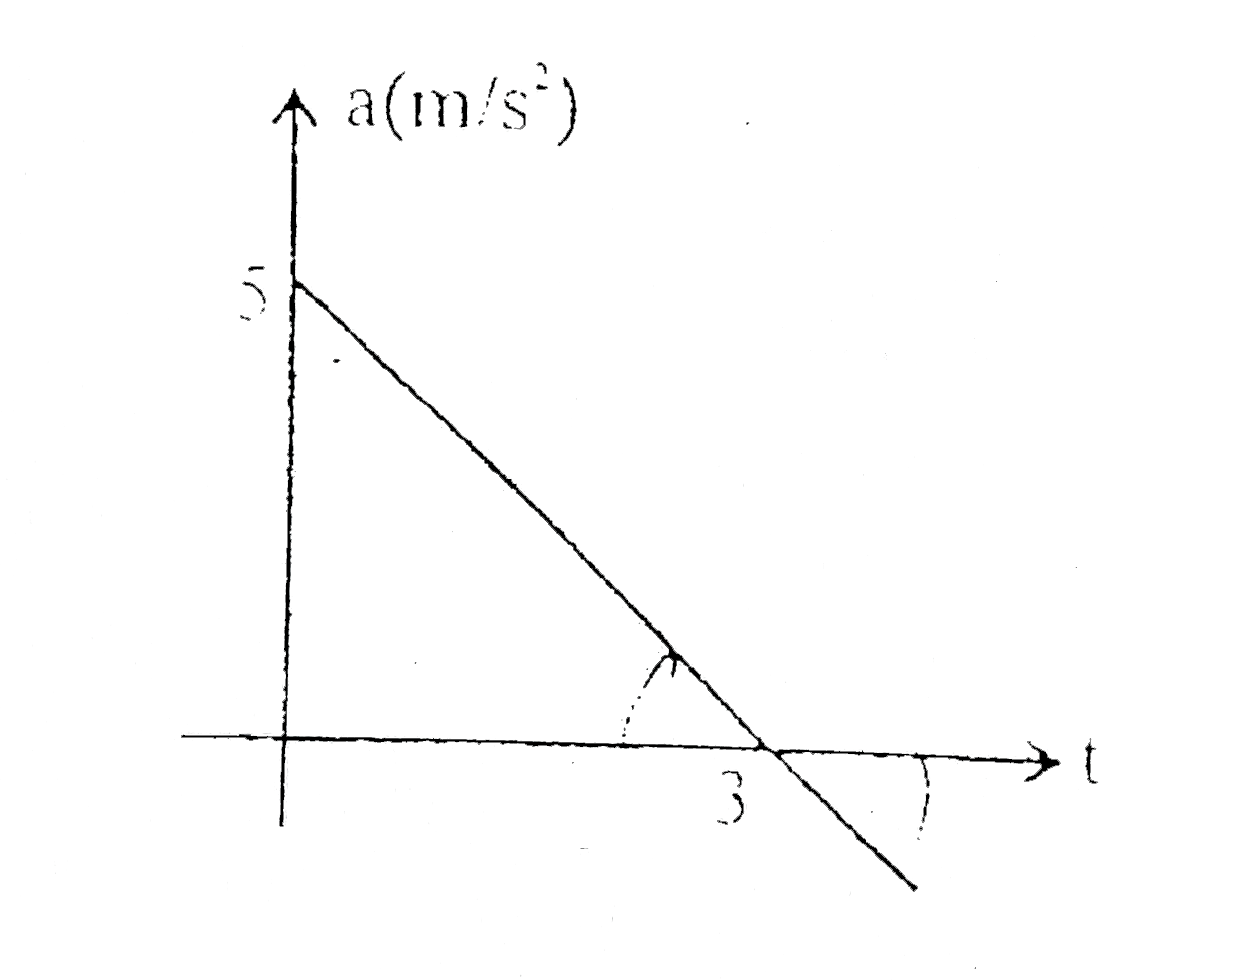
Acceleration versus time graph of a particle moving in a straight line is as shown in adjoining figure. If initially particle was at rest. Then corresponding kinetic energy versus time graph will be :
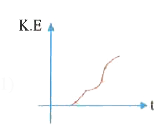
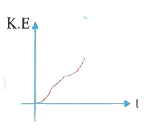
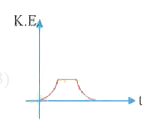
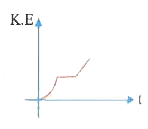
The correct Answer is:(1)
KE always increases since particle is always in a accelerated motion
Topper's Solved these Questions
- BOOK - NARAYNACHAPTER - WORK , ENERGY & POWER EXERCISE - EXERCISE -III54videos
WORK , ENERGY & POWER
- BOOK - NARAYNACHAPTER - WORK , ENERGY & POWER EXERCISE - EXERCISE IV43videos
WORK , ENERGY & POWER
- BOOK - NARAYNACHAPTER - WORK , ENERGY & POWER EXERCISE - EXERCISE -II (C.W)75videos
WORK , ENERGY & POWER
- BOOK - NARAYNACHAPTER - WAVESEXERCISE - Exercise-IV56videos
WAVES
- BOOK - NARAYNACHAPTER - WORK POWER AND ENERGYEXERCISE - Level-VI (Integer)12videos
WORK POWER AND ENERGY
Similar Questions
The acceleration time graph of a particle moving along a straight line is as shown in Fig.At what time the particle acquires its initial velocity?
View SolutionThe acceleration versus time graph of a particle moving in a straight line is show in figure. The velocity-time graph of the particle would be
 .View Solution
Knowledge Check
- Question 1 - Select One or More
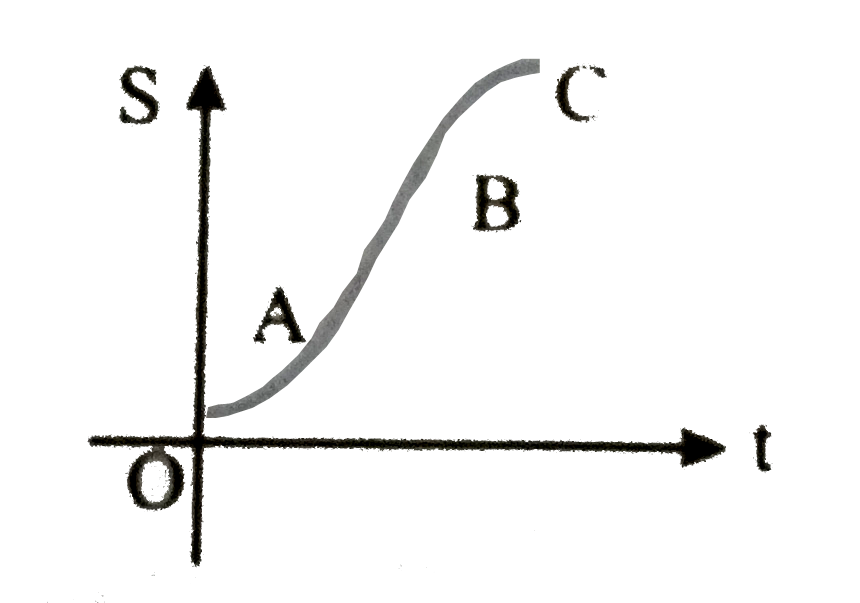
Displacement time graph of a particle moving in a straight line is a shown in figure.
 Ain region A acceleration is positiveBin region B acceleration is negativeCin region C acceleration is positiveDin region D acceleration is negative
 - Question 2 - Select One or More
Velocity displacement graph of a particle moving in a straight line is as shown in figure.
 Amagnitude of acceleration of particle is decreasingBmagnitude of acceleration of particlre is increasingCacceleration versus displacement graph straight lineDacceleration versus displacement graph is parabola
 - Question 3 - Select One
The velocity versus time graph of a body moving in a straight line is as shown in the figure below
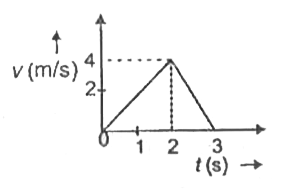 AThe distance covered by the body in 0 to 2s is 8mBThe acceleration of the body in 0 to 2s is 4ms−2CThe accelerationof the body in 2 to 3s is 4ms−2DThe distance moved by the body during 0 to 3 is 6 m
Velocity versus displacement graph of a particle moving in a straight line as shown in figure.
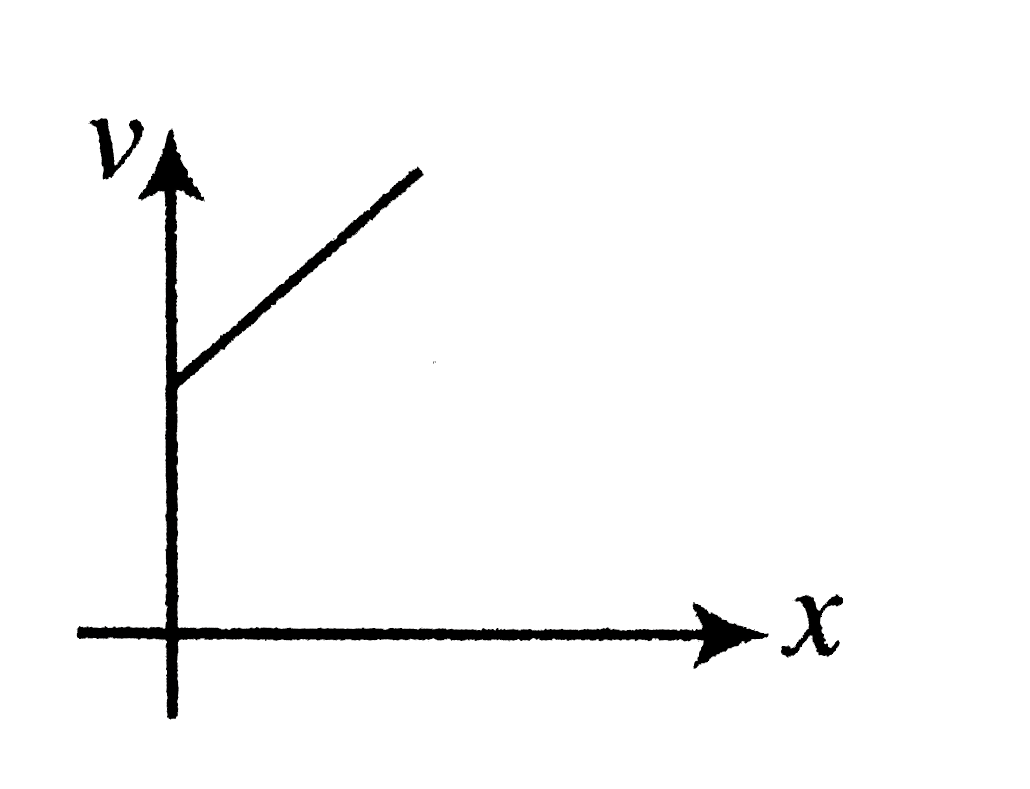
The acceleration of the particle.View SolutionAcceleration-velocity graph of a particle moving in a straight line is as shown in the figure. Then slope of velocity-displacement graph
 View Solution
The acceleration-time graph of a particle moving along a straight line is as shown in figure. At what time the particle acquires its initial velocity ?
 View Solution
The acceleration-time graph of a particle moving along a straight line is as shown in figure. At what time the particle acquires its initial velcoity ?
 View Solution
Displacement time graph of a particle moving in a straight line is as shown in figure. Select the correct alternative (s) :
 .View Solution

