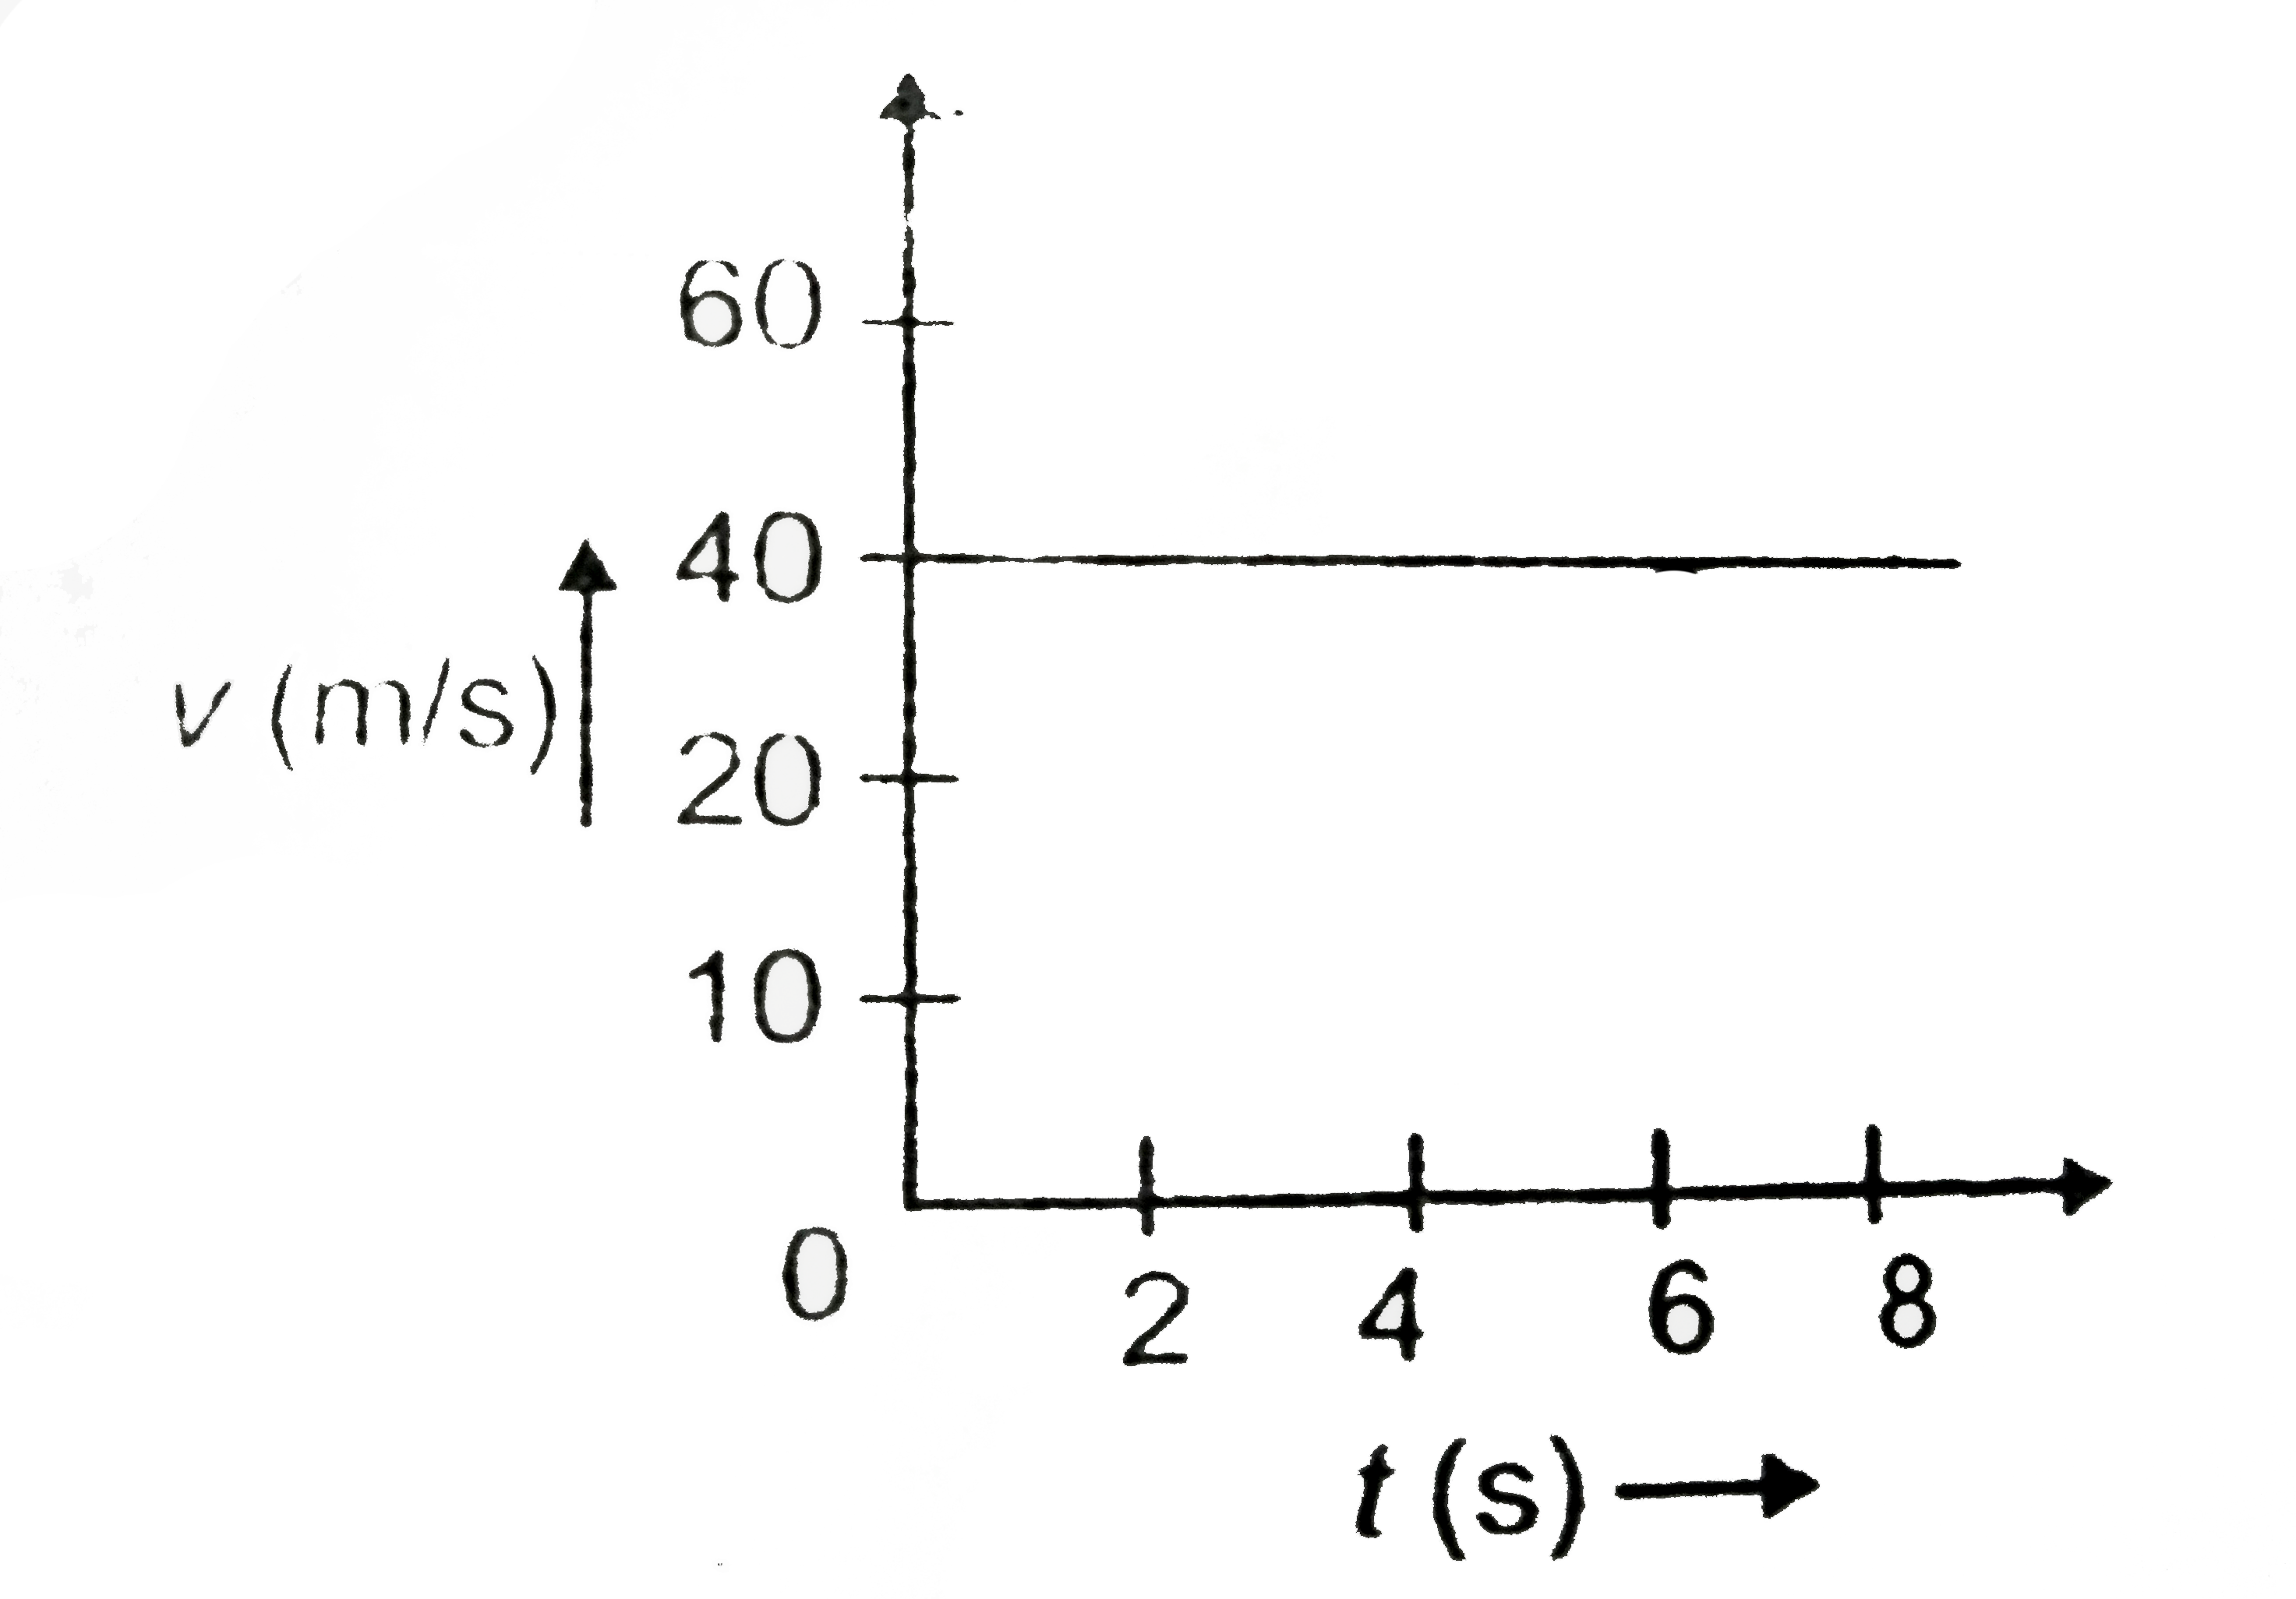
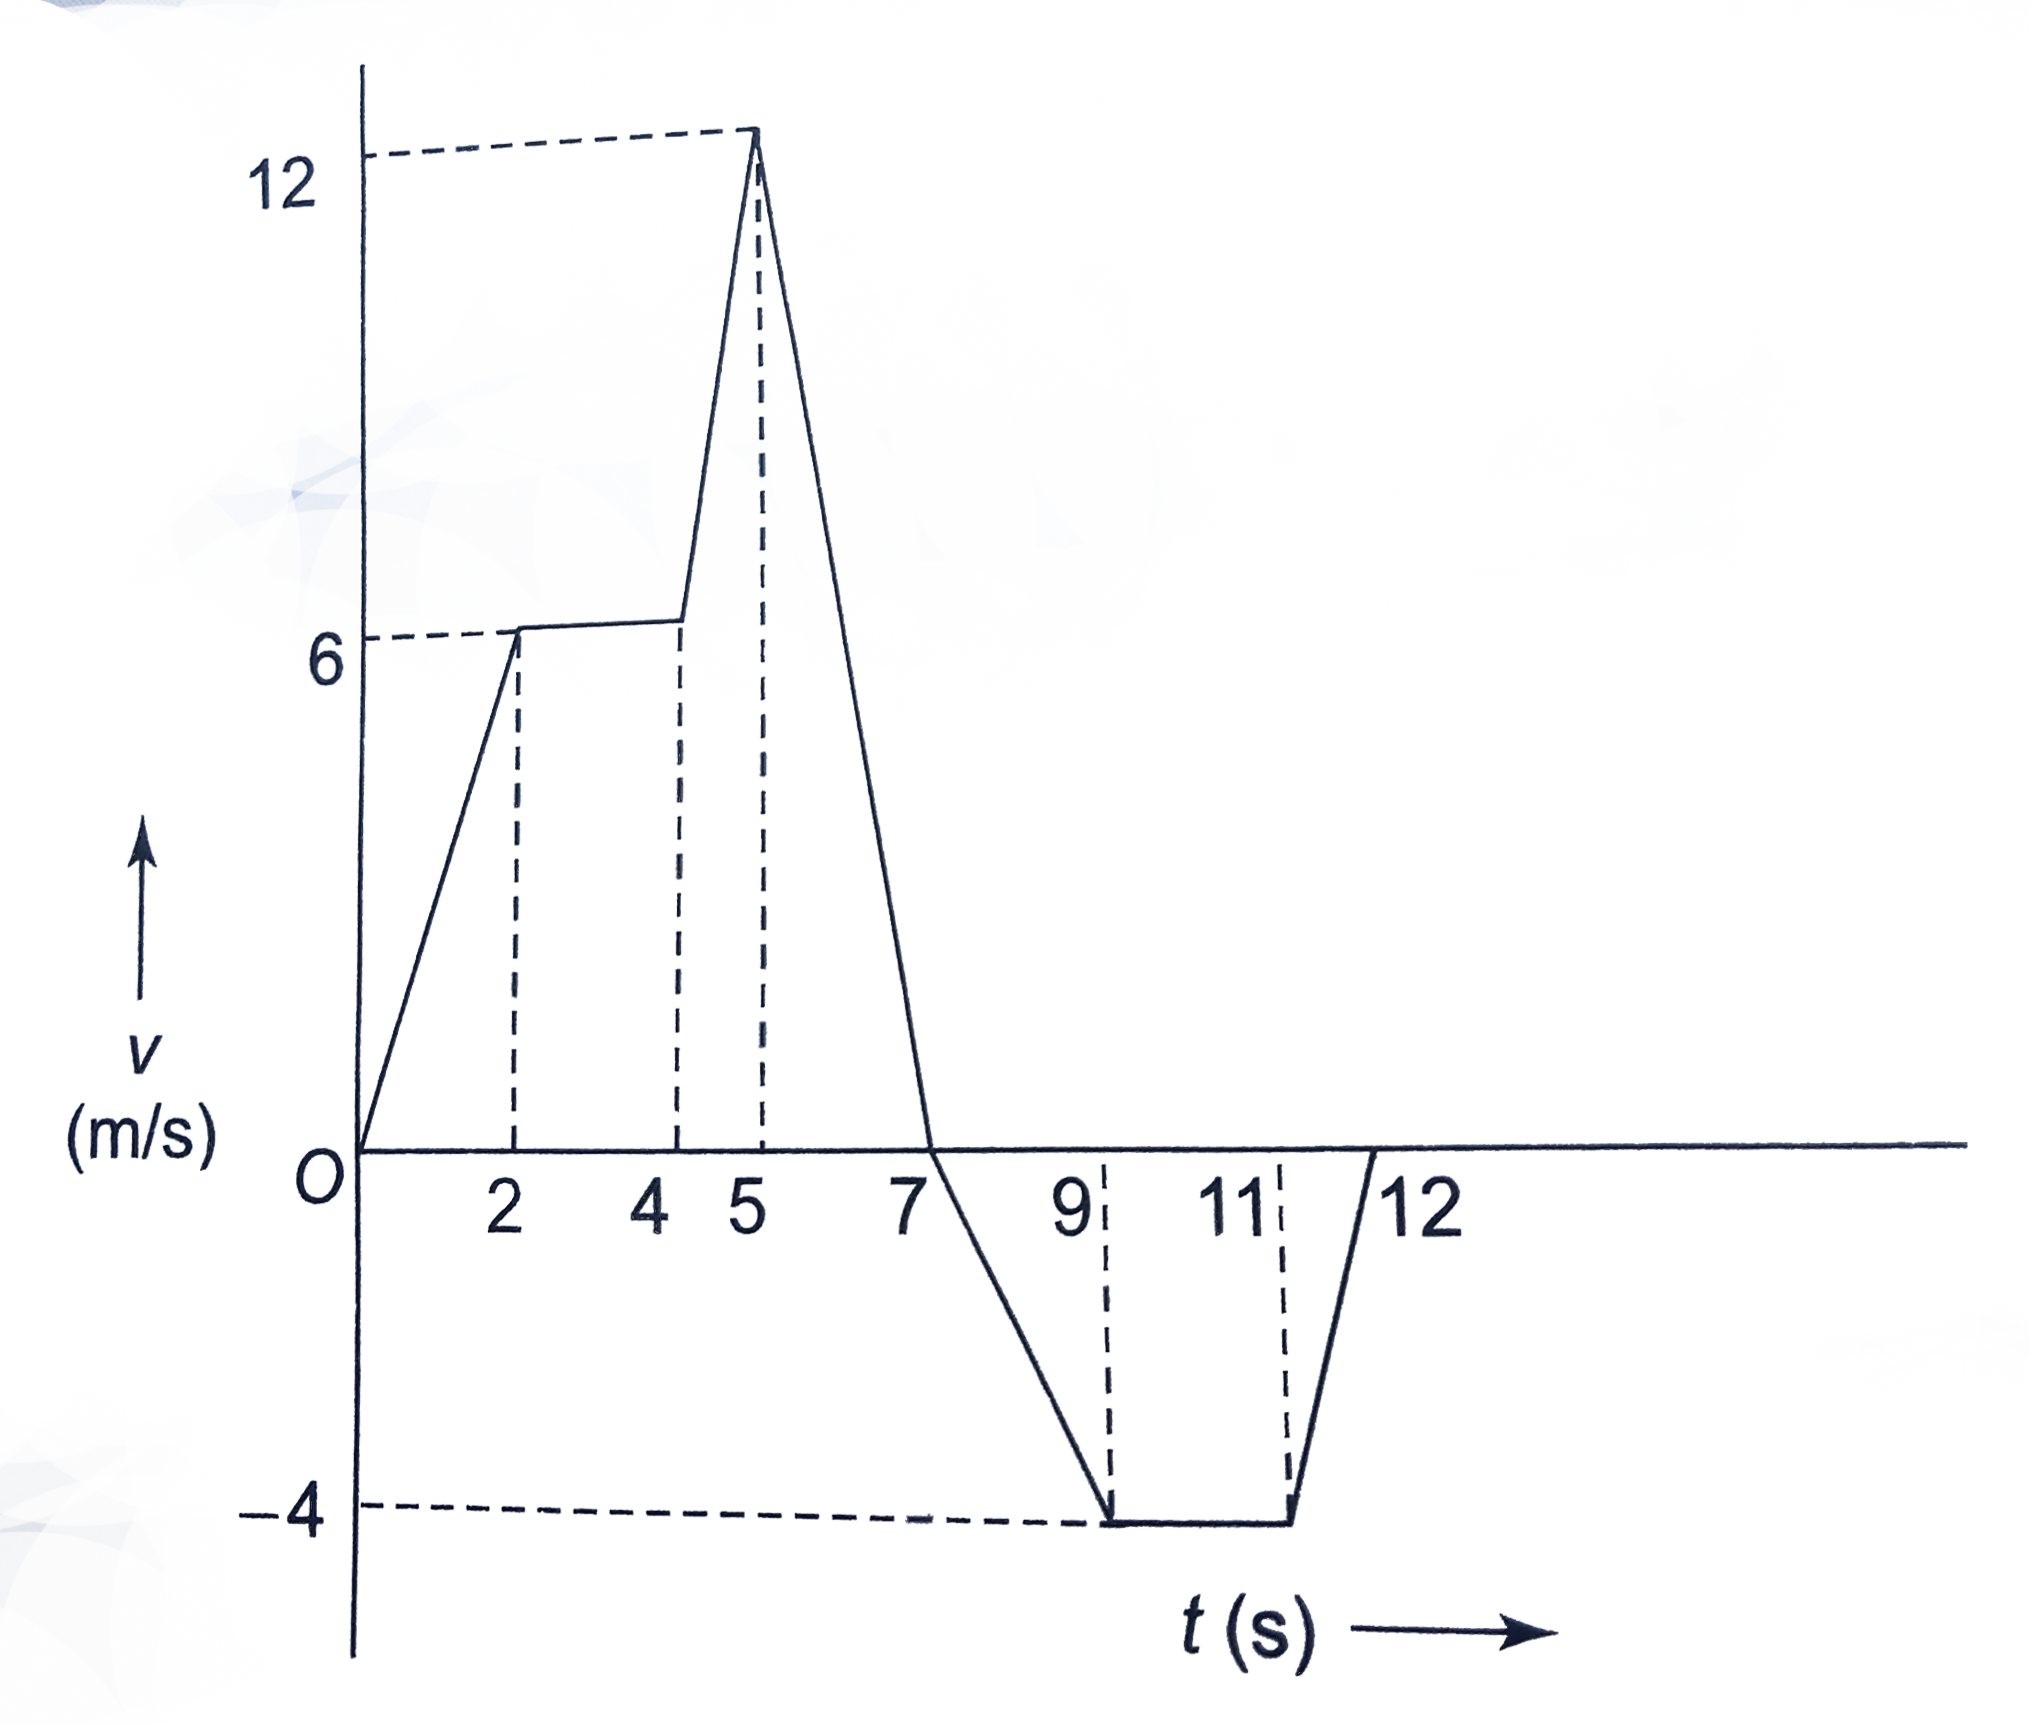
The velocity-time graph of an objects is as shown. The displacement during the interval 0 to is
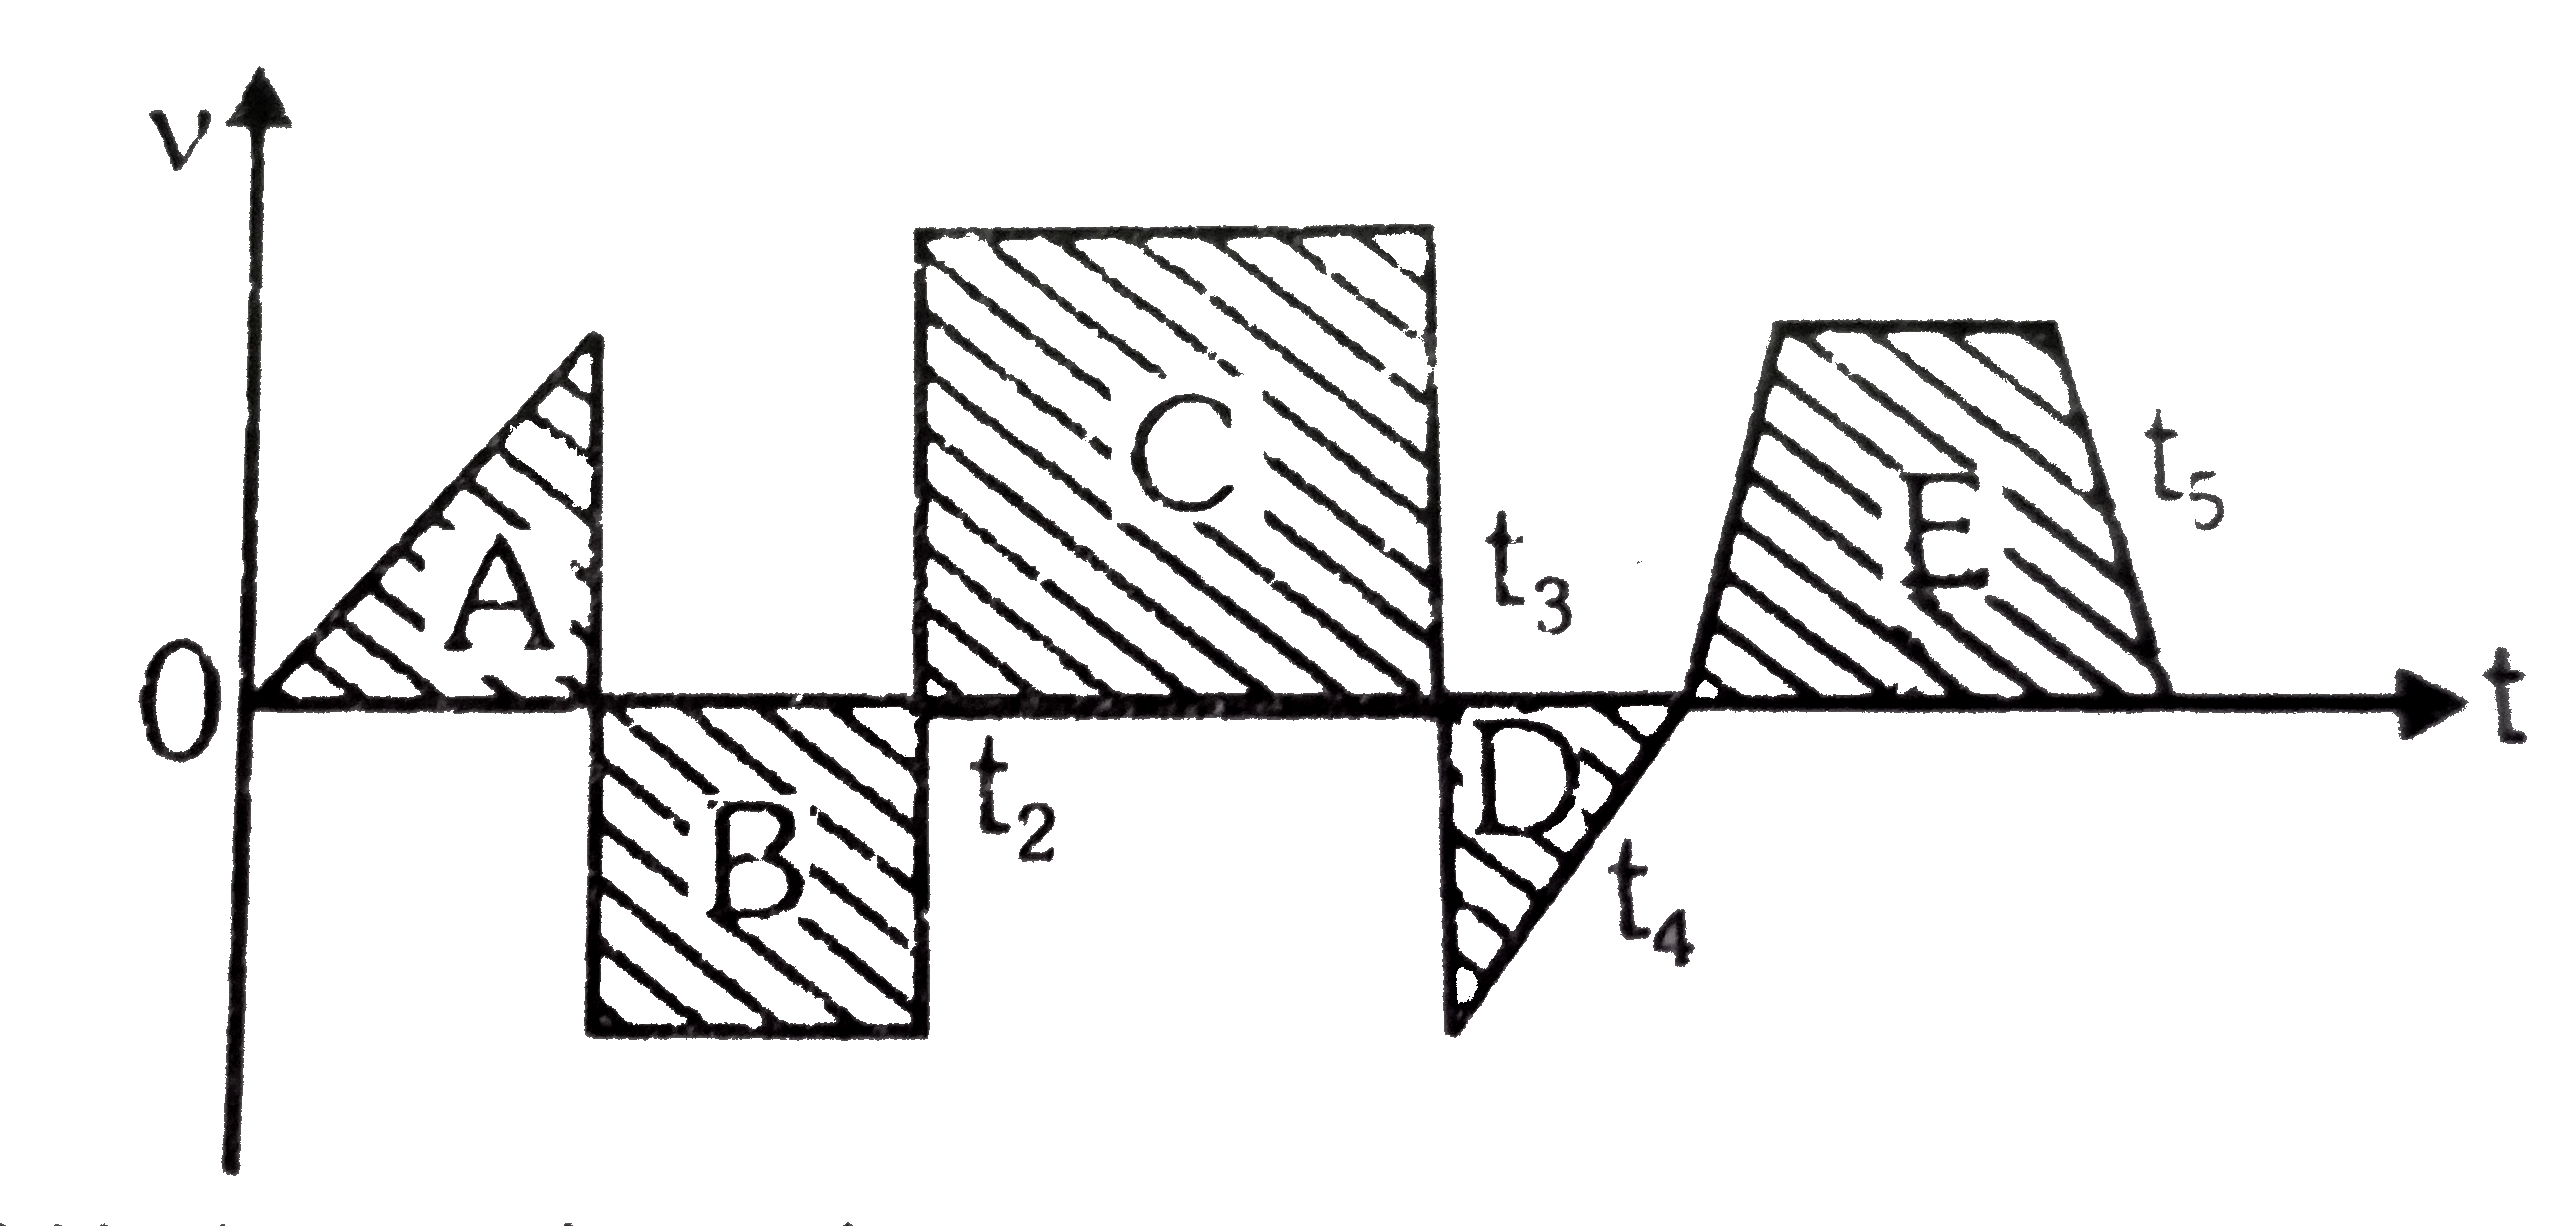
Area A+AreaB+AreaC+AreaD+AreaE
AreaA+AreaC-AreaB-AreaD
Area+AreaB+AreaC+AreaD
AreaA+AreaC+AreaE-AreaB+AreaD
The correct Answer is:B
Displacement is a vector quantity. Area above time axis is + ve and below time axis is -ve.
Topper's Solved these Questions
- BOOK - ALLENCHAPTER - MOTION IN A PALNEEXERCISE - EXERCISE-2170videos
MOTION IN A PALNE
- BOOK - ALLENCHAPTER - MOTION IN A PALNEEXERCISE - EXERCISE-341videos
MOTION IN A PALNE
- BOOK - ALLENCHAPTER - MOTION IN A PALNEEXERCISE - SOLVED EXAMPLE28videos
MOTION IN A PALNE
- BOOK - ALLENCHAPTER - KINEMATICS-2DEXERCISE - Exercise (O-2)48videos
KINEMATICS-2D
- BOOK - ALLENCHAPTER - NEWTON'S LAWS OF MOTION & FRICTIONEXERCISE - EXERCISE (JA)4videos
NEWTON'S LAWS OF MOTION & FRICTION
Similar Questions
Knowledge Check
- Question 1 - Select One
The velocity-time graph of a body is shown in .
The displacement of the body in 8s is.
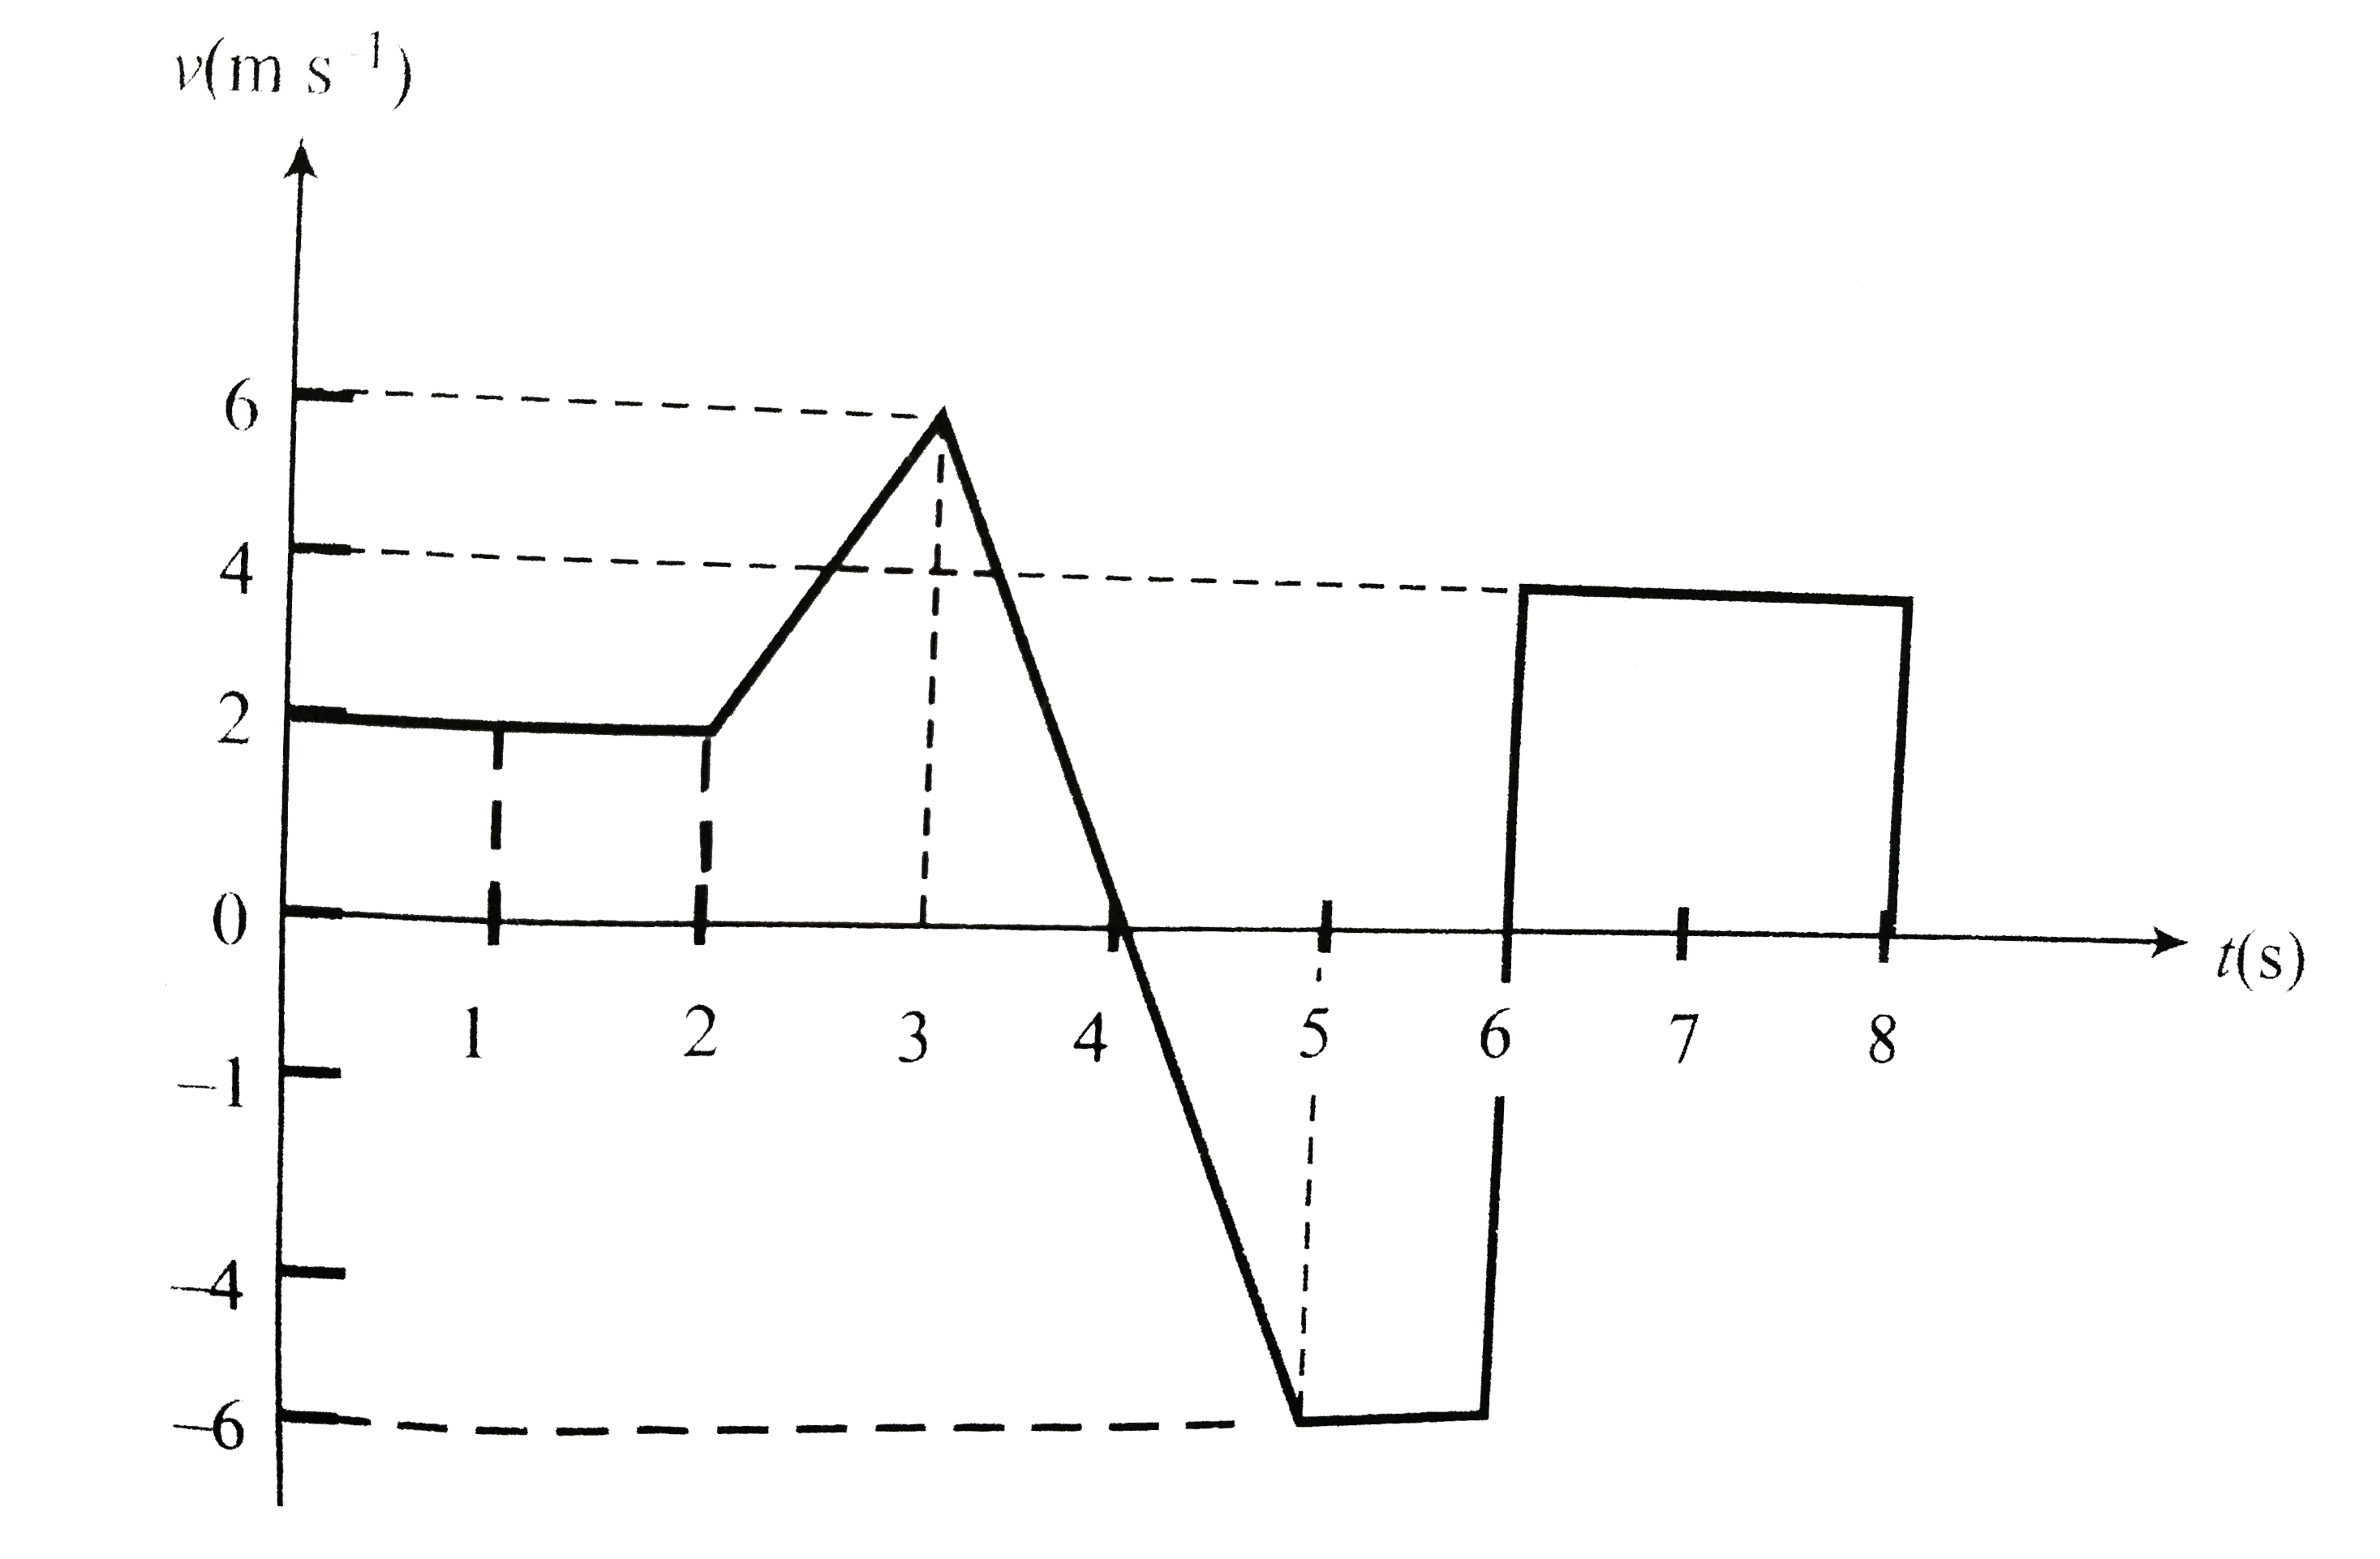 .A9mB12mC10mD28m
 - Question 2 - Select One
velocity time graph of a particle is shown in figure. Find displacement of the particle.
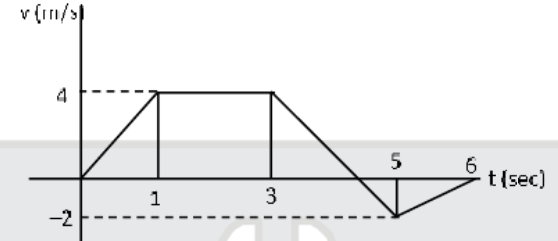 A7B11C5D15
 - Question 3 - Select One
Velocity-time graph for a particle is shown in following figure for time interval 0 to 2T.
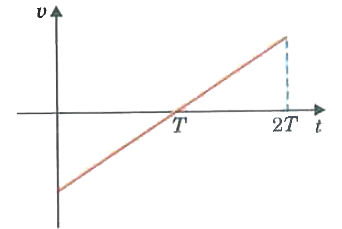 ADuring the motion, particle reverse its direction of motion.BParticle is moving with constant accelerationCNet displacement in time interval 0 to 2T is zero.DSpeeds of particle at t=0 and t=2T are same.
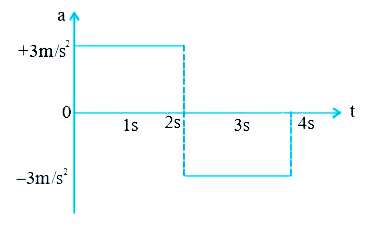
A particle starts from rest at t=0 and undergoes an acceleration as shown in figure.
Draw the velocity-time graph of the motion of the particle during the interval from zero to 4 second.
 View Solution
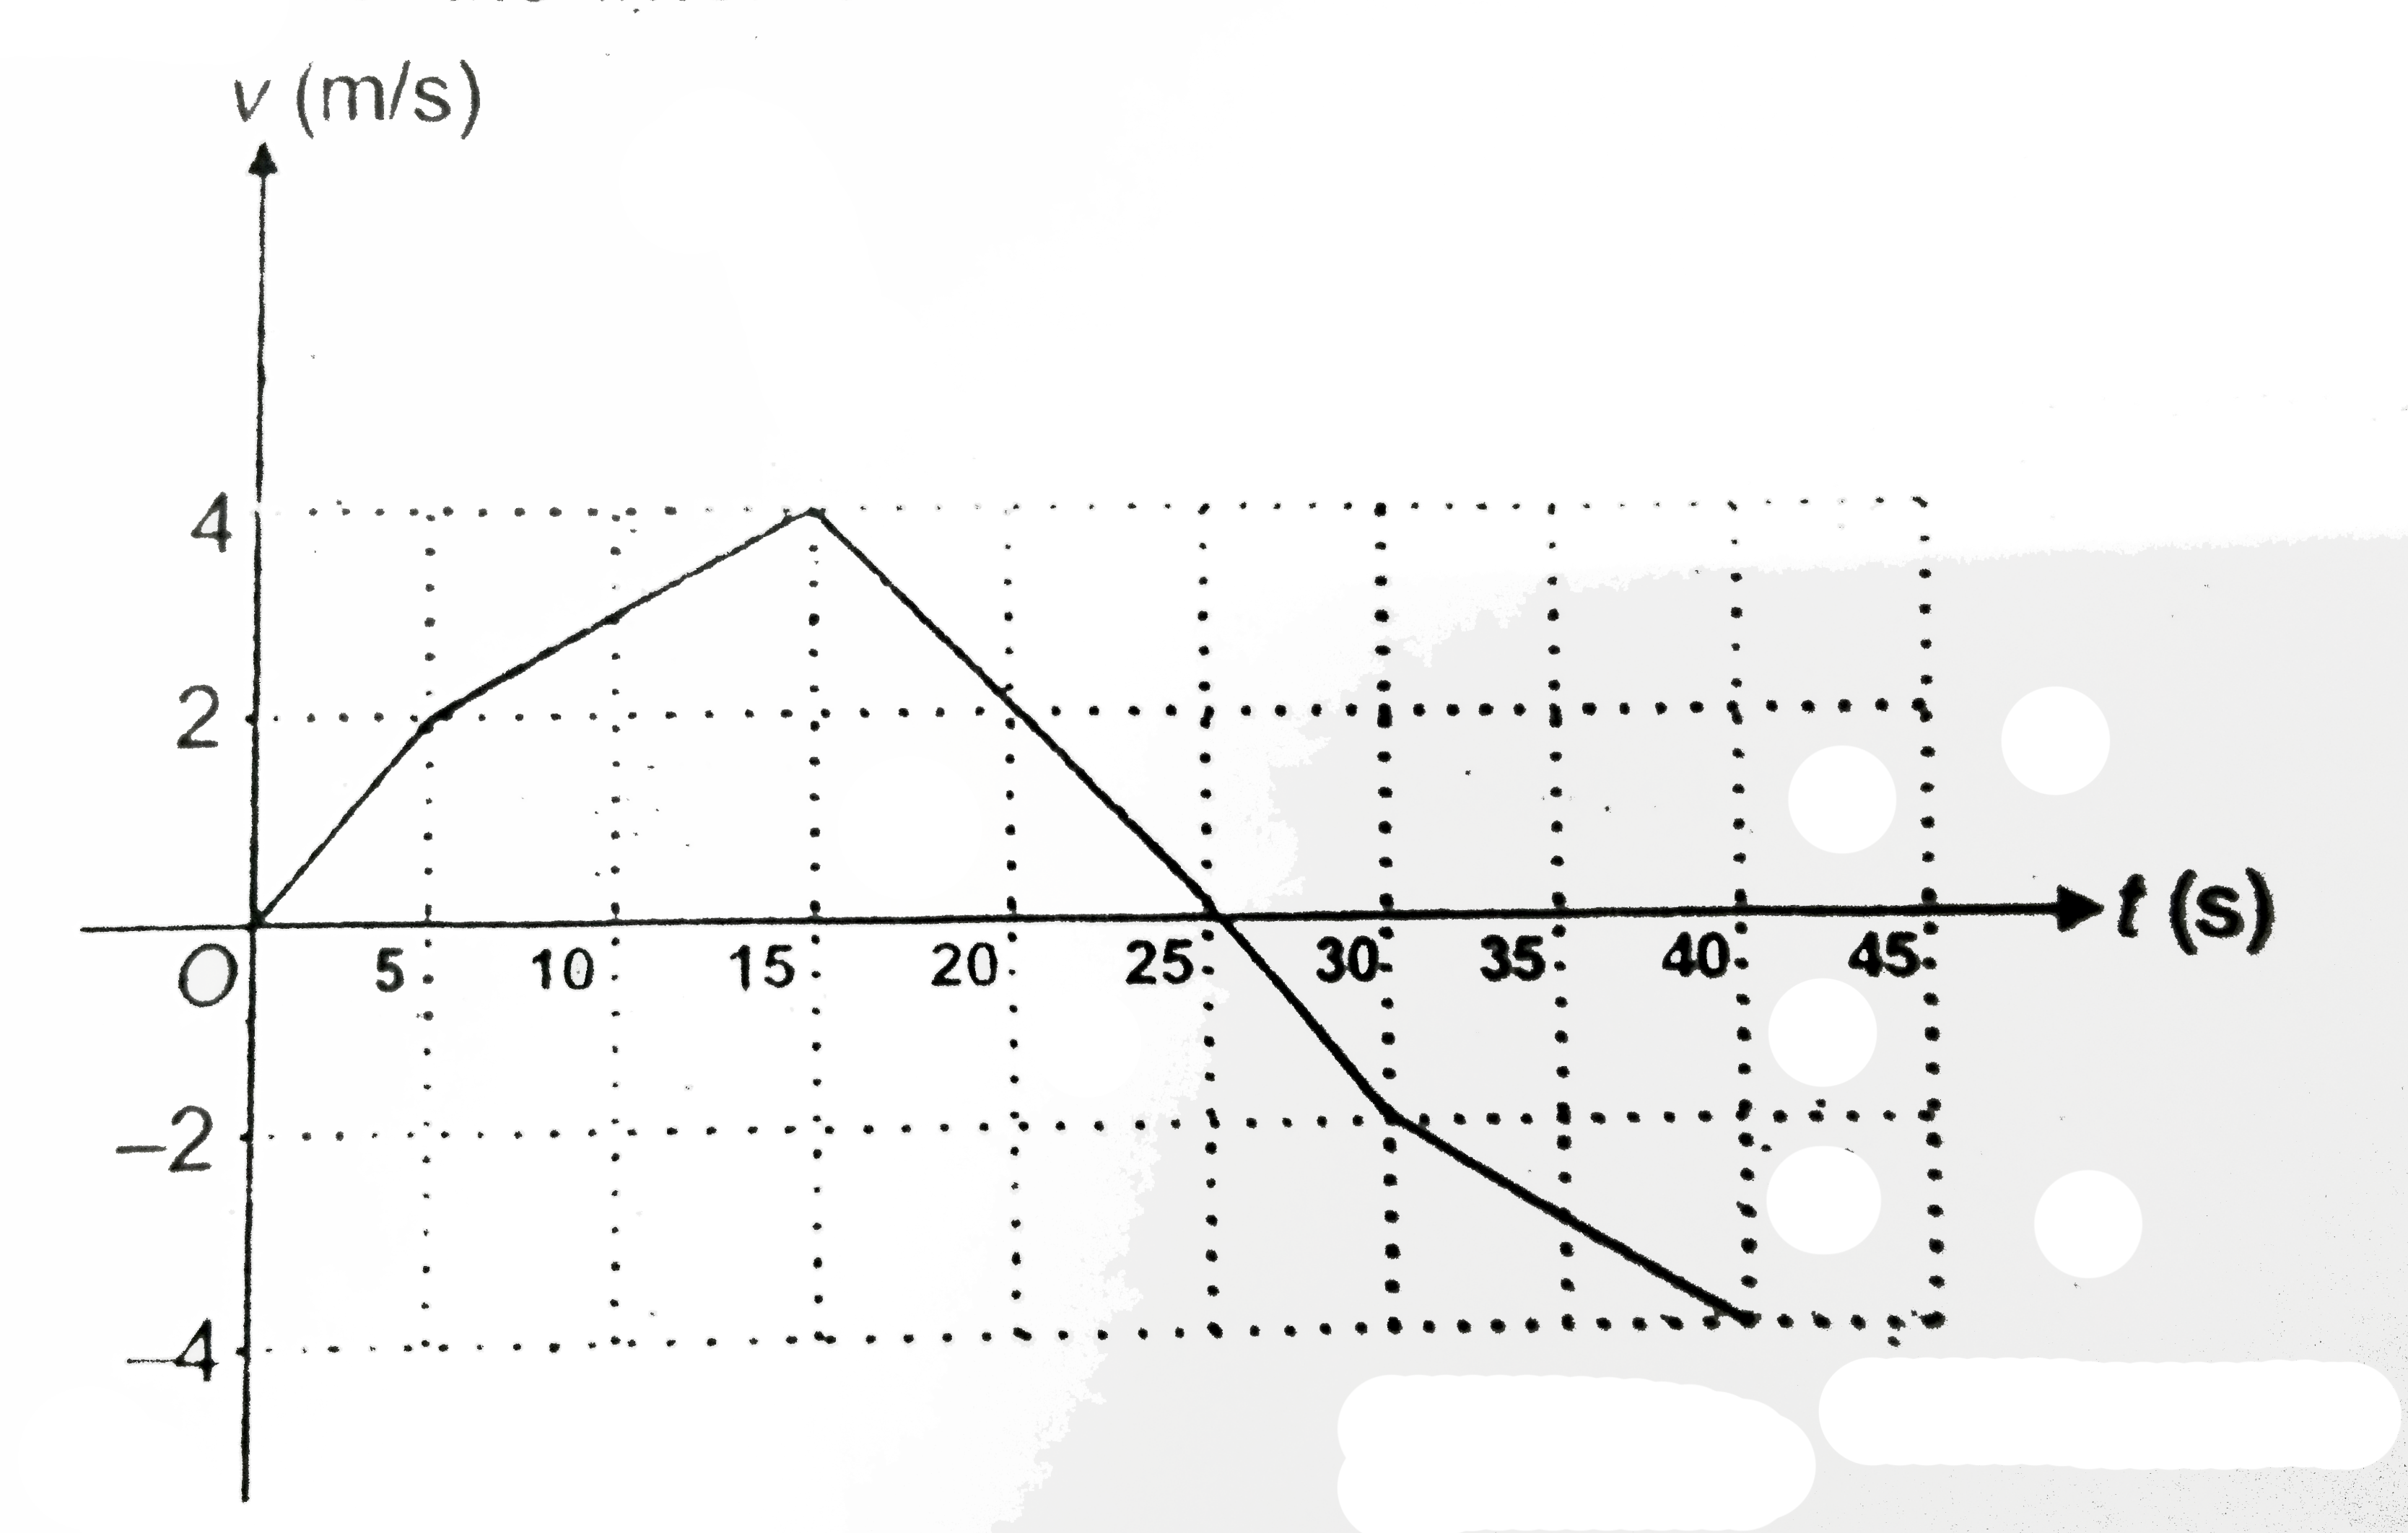
The velocity - time graph for linear motion of an object is as shown. Find
(a) The distance travelled and
(b) Displacement for the interval between 5 s and 40 s.
 View Solution
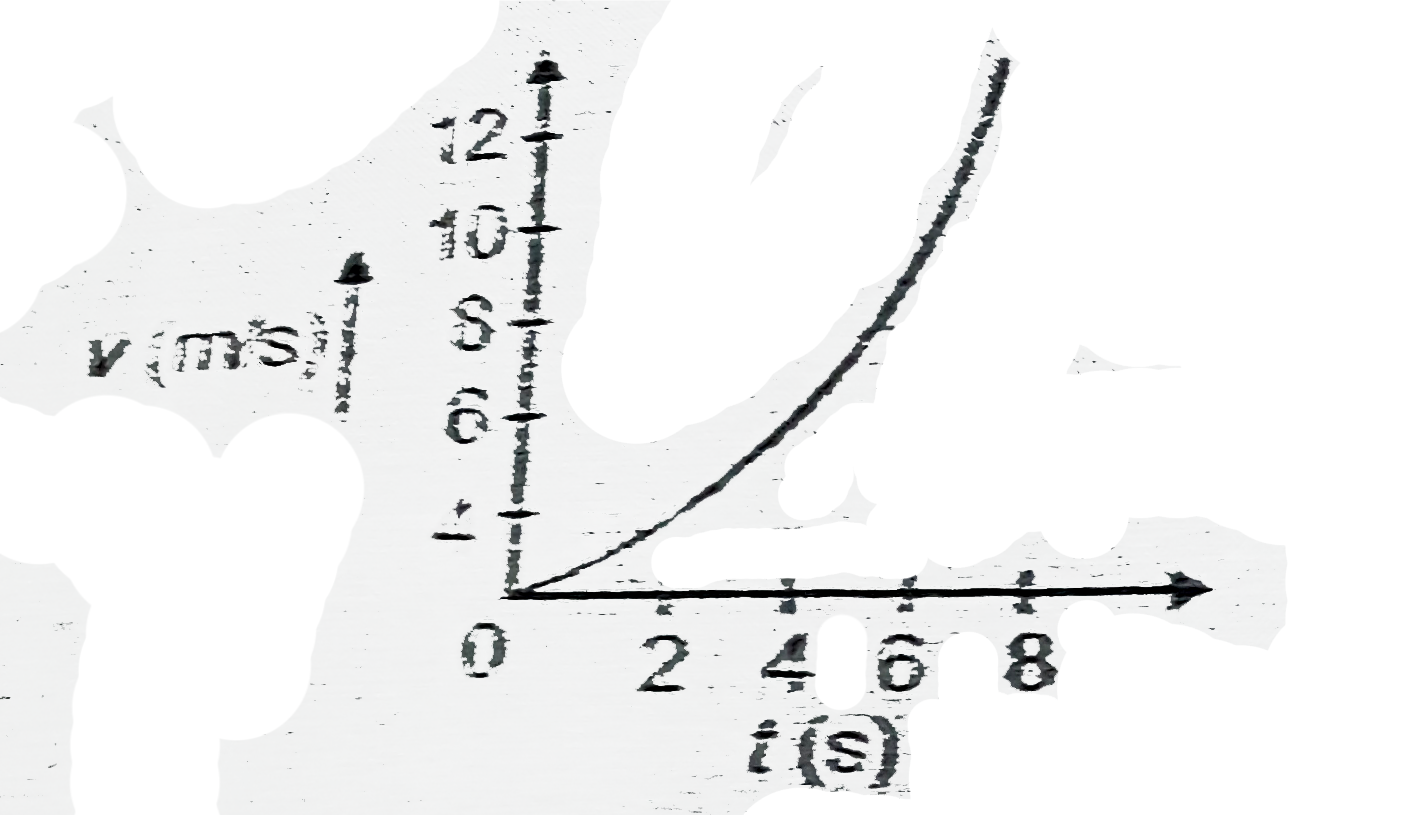
The velocity-time graph of an object is given below. Calculate the average acceleration of the object in the time interval of 4 s to 6 s.
 View Solution
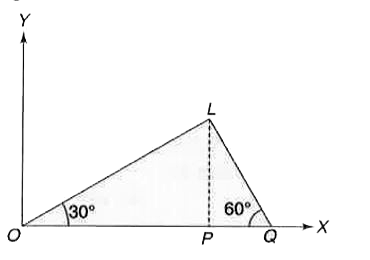
The velocity-time (v – t) graph of a body is shown in the figure. For the intervals OP and PQ, the ratio of the distances covered is
 View Solution
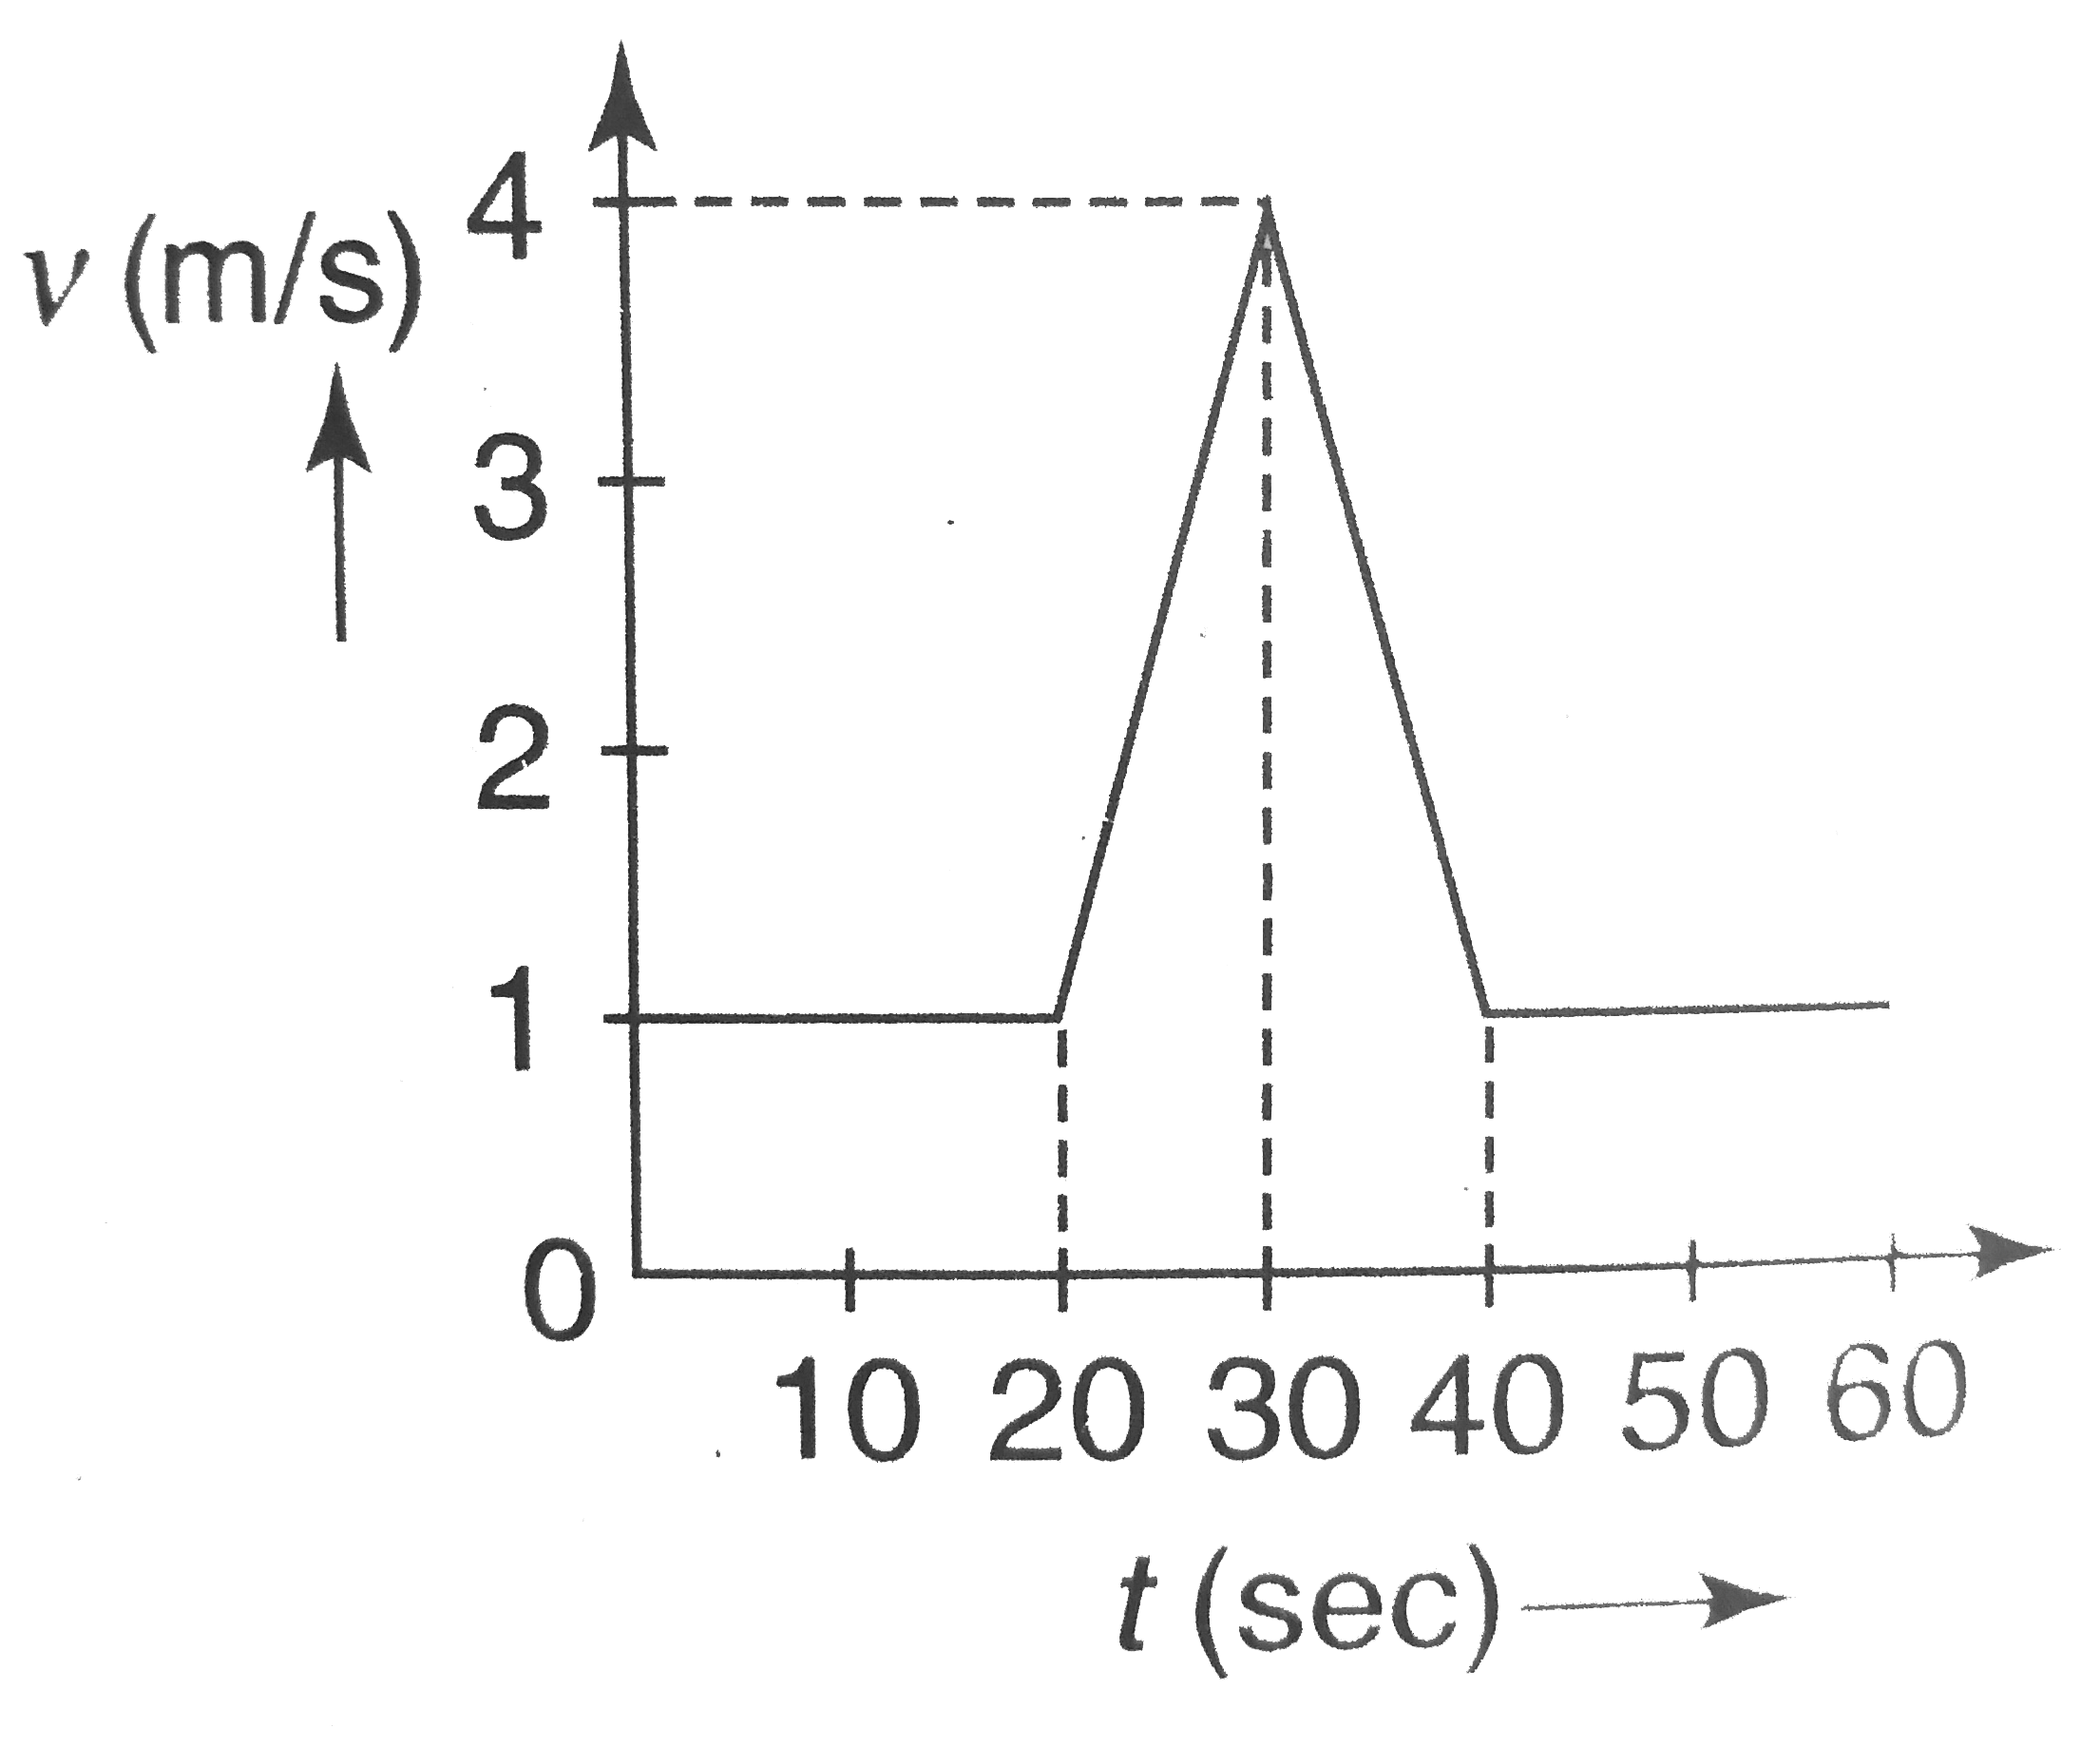
Velocity-time graph for a moving object is shown in the figure. Total displacement of the object during the time interval when there is non-zero acceleration and retardation is.
 View Solution


