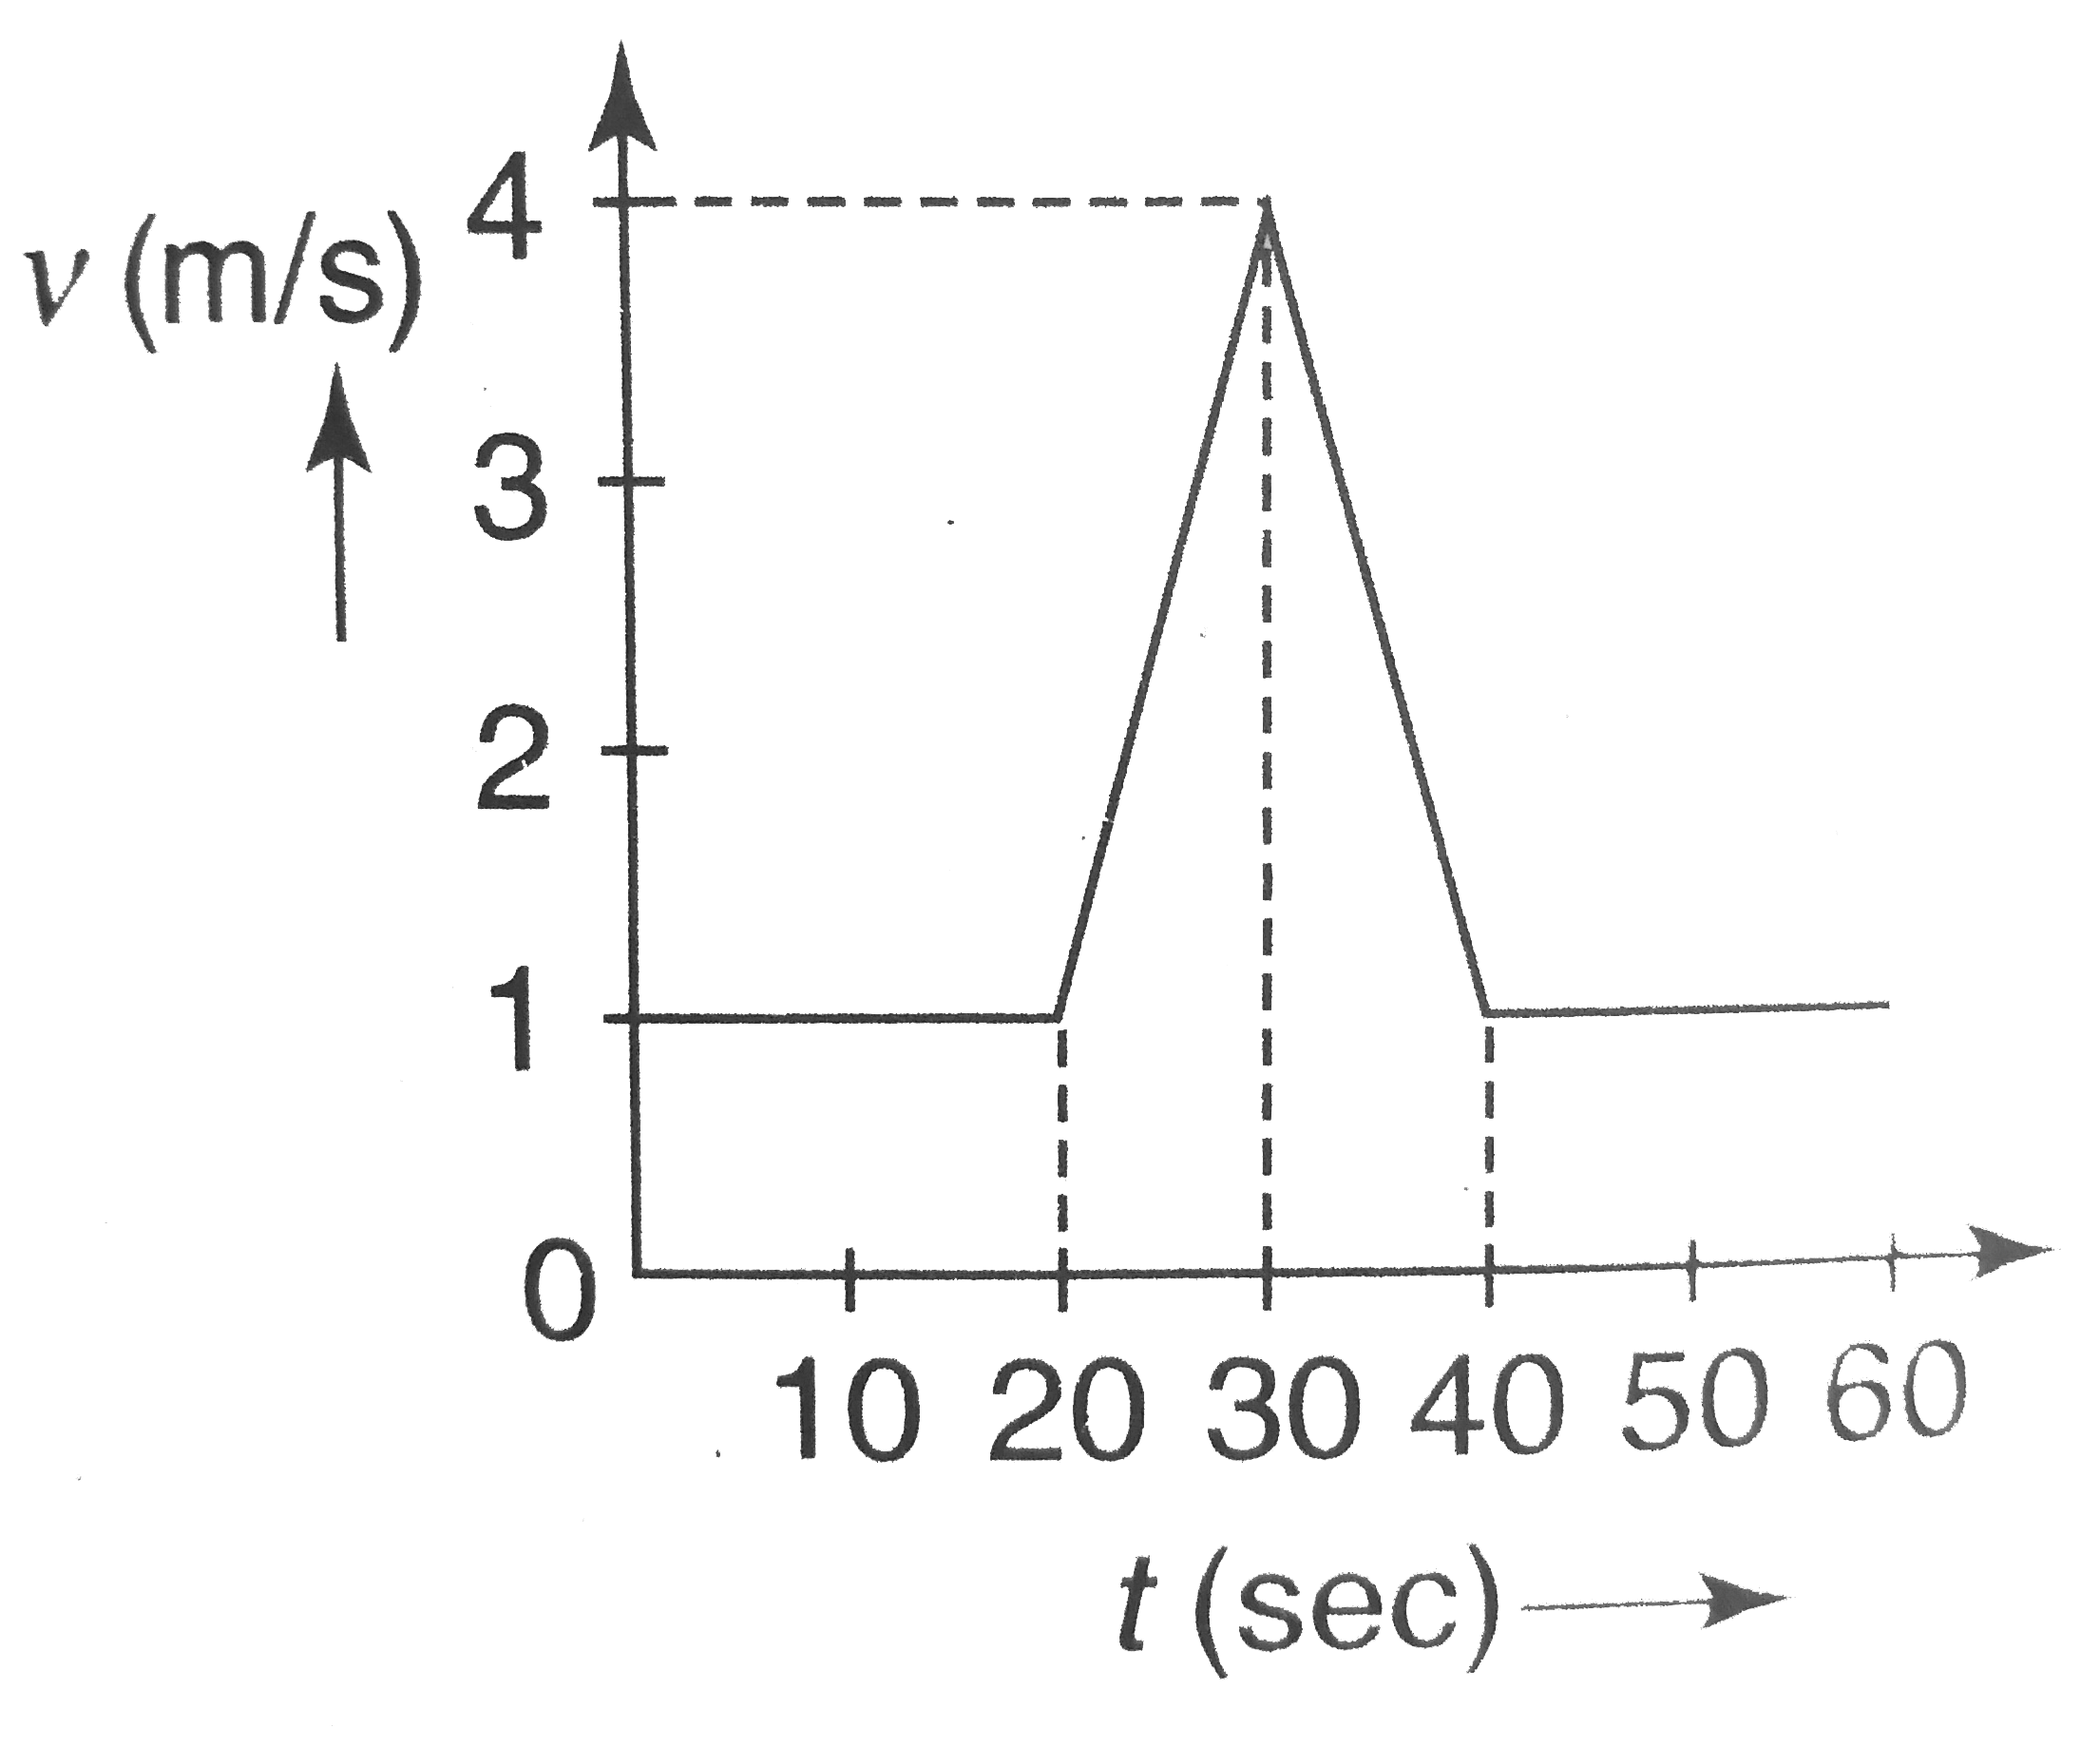
Velocity-time graph for a moving object is shown in the figure. Total displacement of the object during the time interval when there is non-zero acceleration and retardation is.
A
60 m
B
50 m
C
30 m
D
40 m
Video Solution
Text Solution
The correct Answer is:B
Between time interval 20sec to 40sec, there is non-zero acceleration and retardation.
Hence, distance travelled during this interval.
=12×20×3+20×1=30+20=50m.
|
Updated on:21/07/2023
Topper's Solved these Questions
- BOOK - A2ZCHAPTER - GENERAL KINEMATICS AND MOTION IN ONE DIMENSIONEXERCISE - AIIMS Questions20videos
GENERAL KINEMATICS AND MOTION IN ONE DIMENSION
- BOOK - A2ZCHAPTER - FLUID MECHANICSEXERCISE - Chapter Test29videos
FLUID MECHANICS
- BOOK - A2ZCHAPTER - GRAVITATIONEXERCISE - Chapter Test29videos
GRAVITATION
Similar Questions
Knowledge Check
- Question 1 - Select One
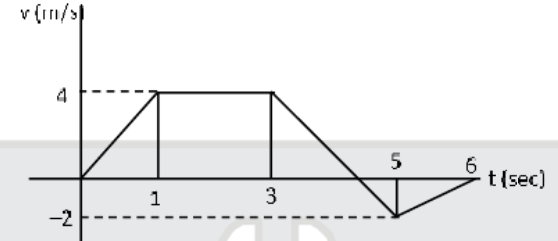
velocity time graph of a particle is shown in figure. Find displacement of the particle.
 A7B11C5D15
 - Question 2 - Select One
The v-t plot of a moving object ios shown in the figure. The average velocity of the object during the first 10 s is
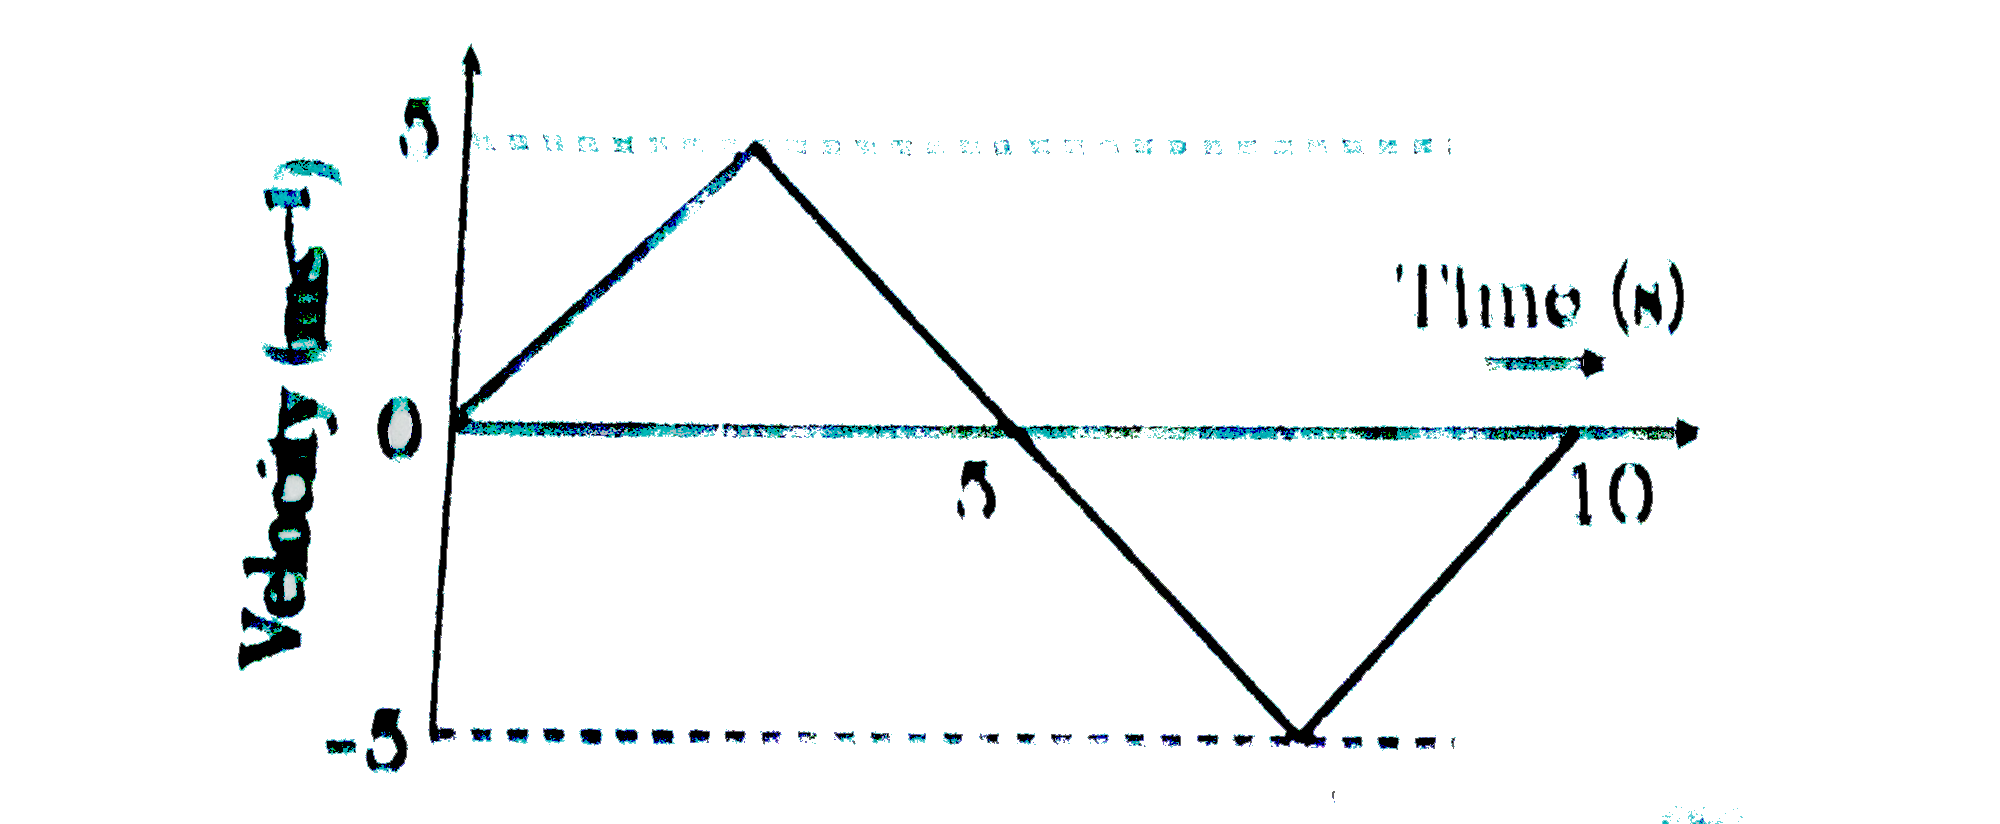 AzeroB2.5ms−1C5ms−1D2ms−1
 - Question 3 - Select One
The distance-time graph of an object shown in figure 2.E2.
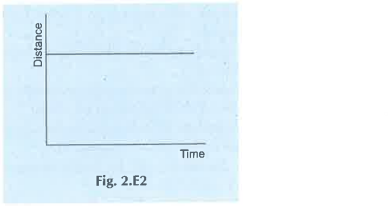
The objectAis at restBmoves with a constant speedCmoves with a constant velocityDmoves with a constant acceleration
The displacement-time graph of a moving particle is shown in the figure. The velocity of the particle is zero at the point ______.
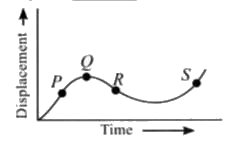 View Solution
Displacement-time graph of any object is shown in the adjacent figure. Draw velocity-time graph for this motion.
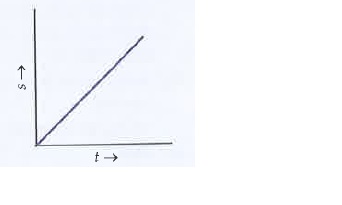 View Solution
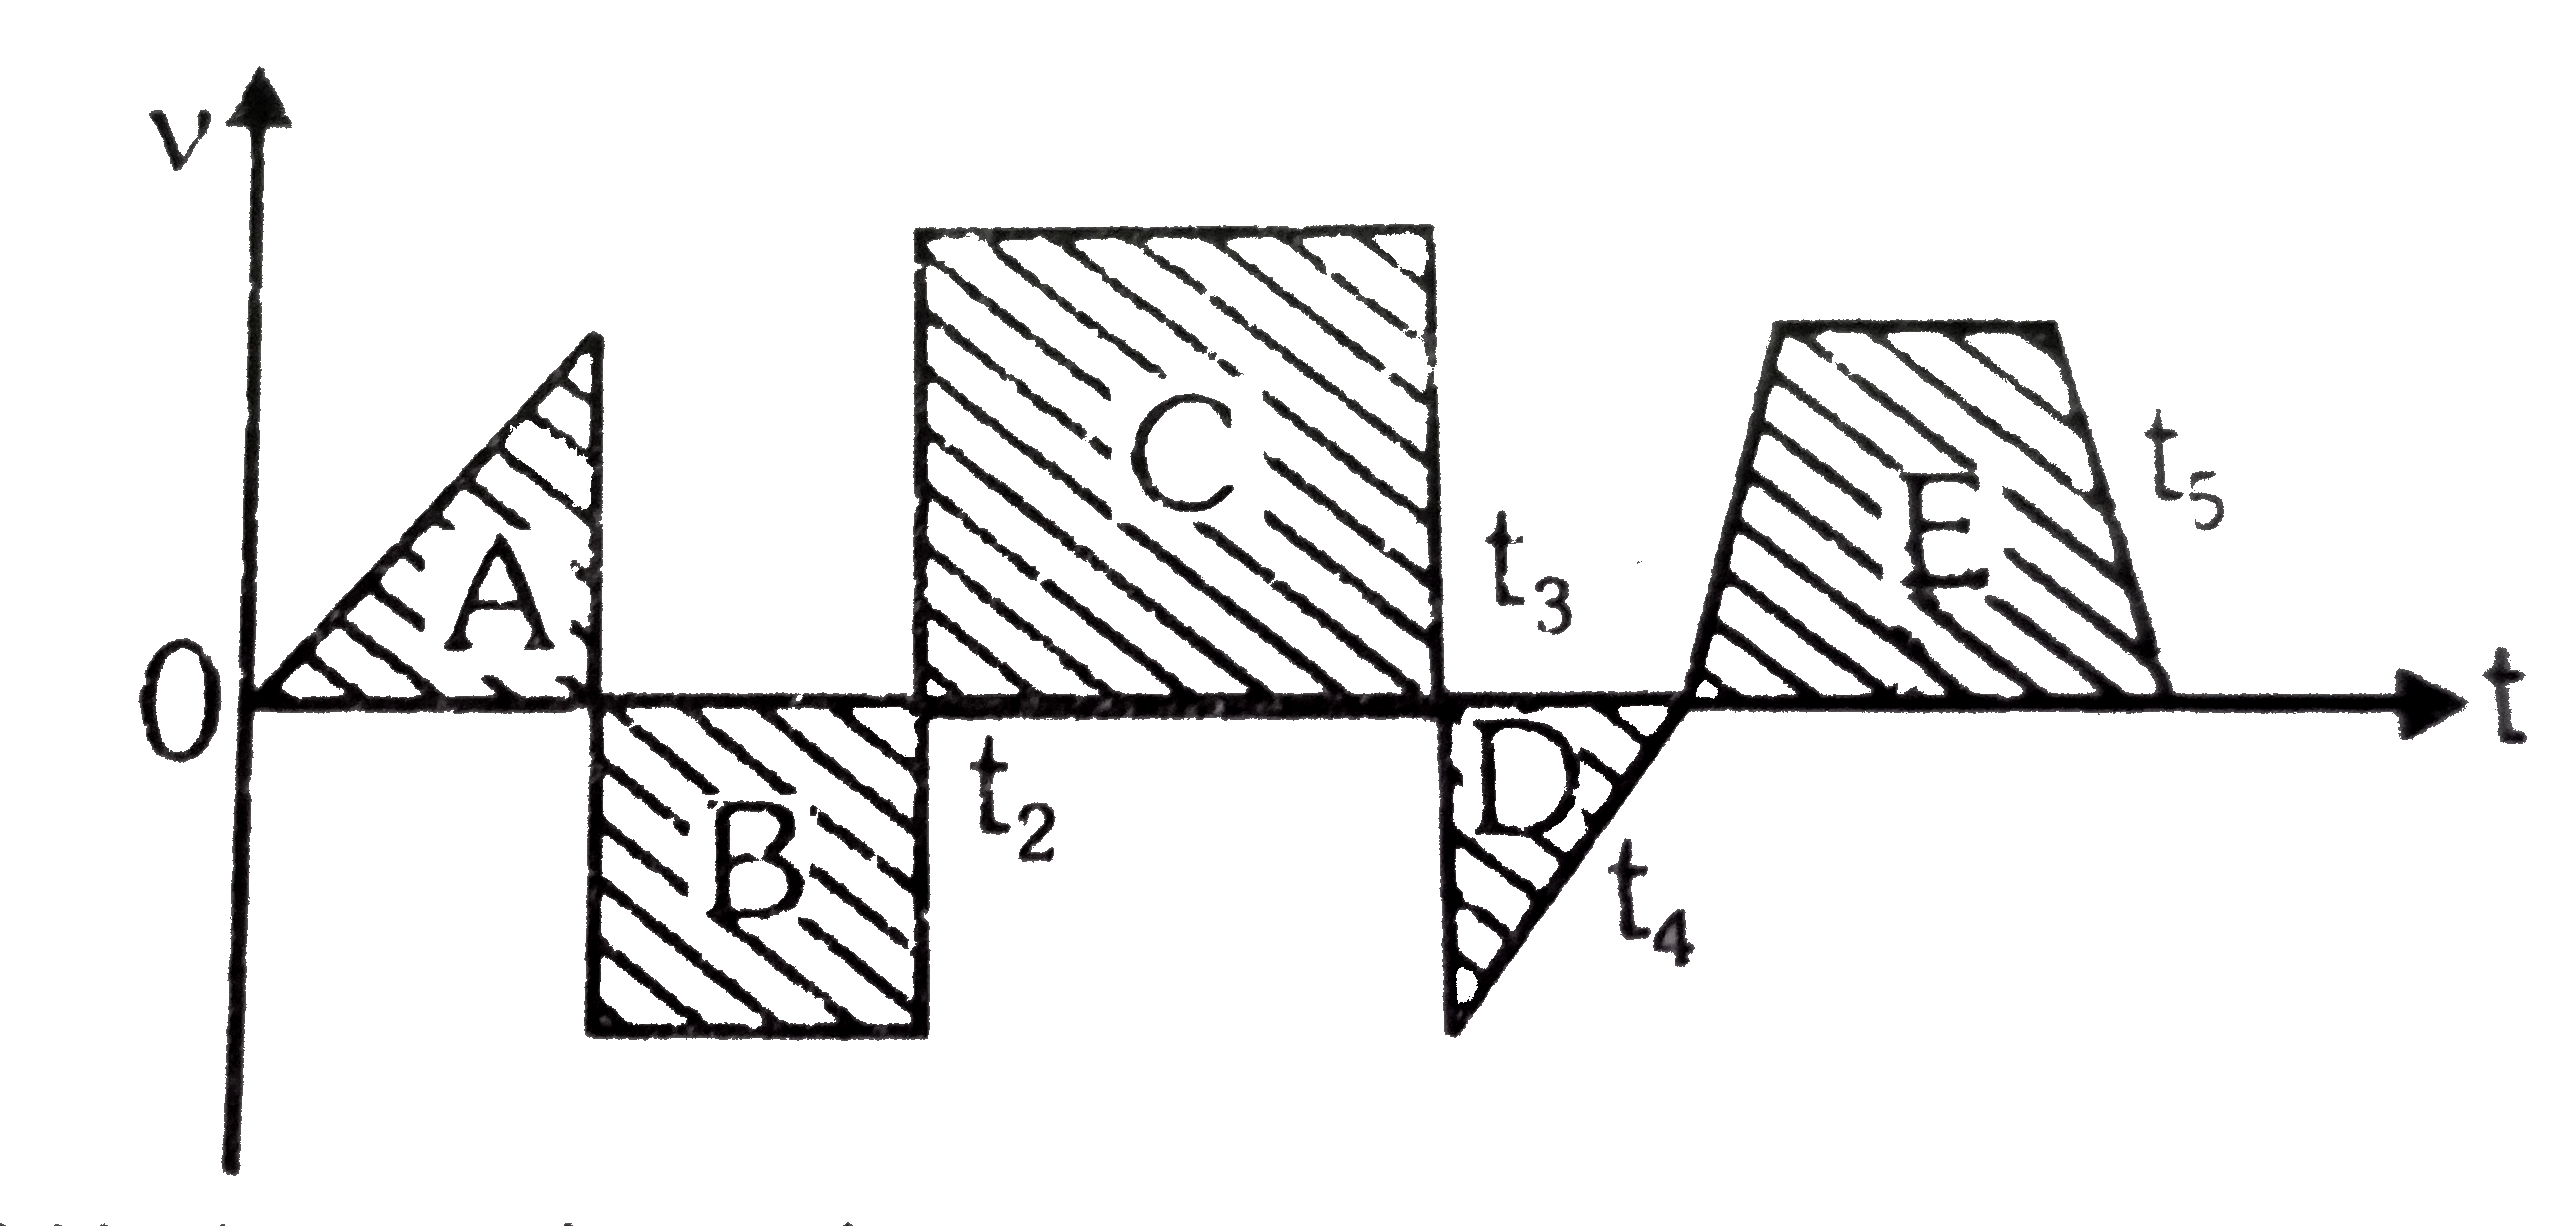
The velocity-time graph of an objects is as shown. The displacement during the interval 0 to t4 is
 View Solution
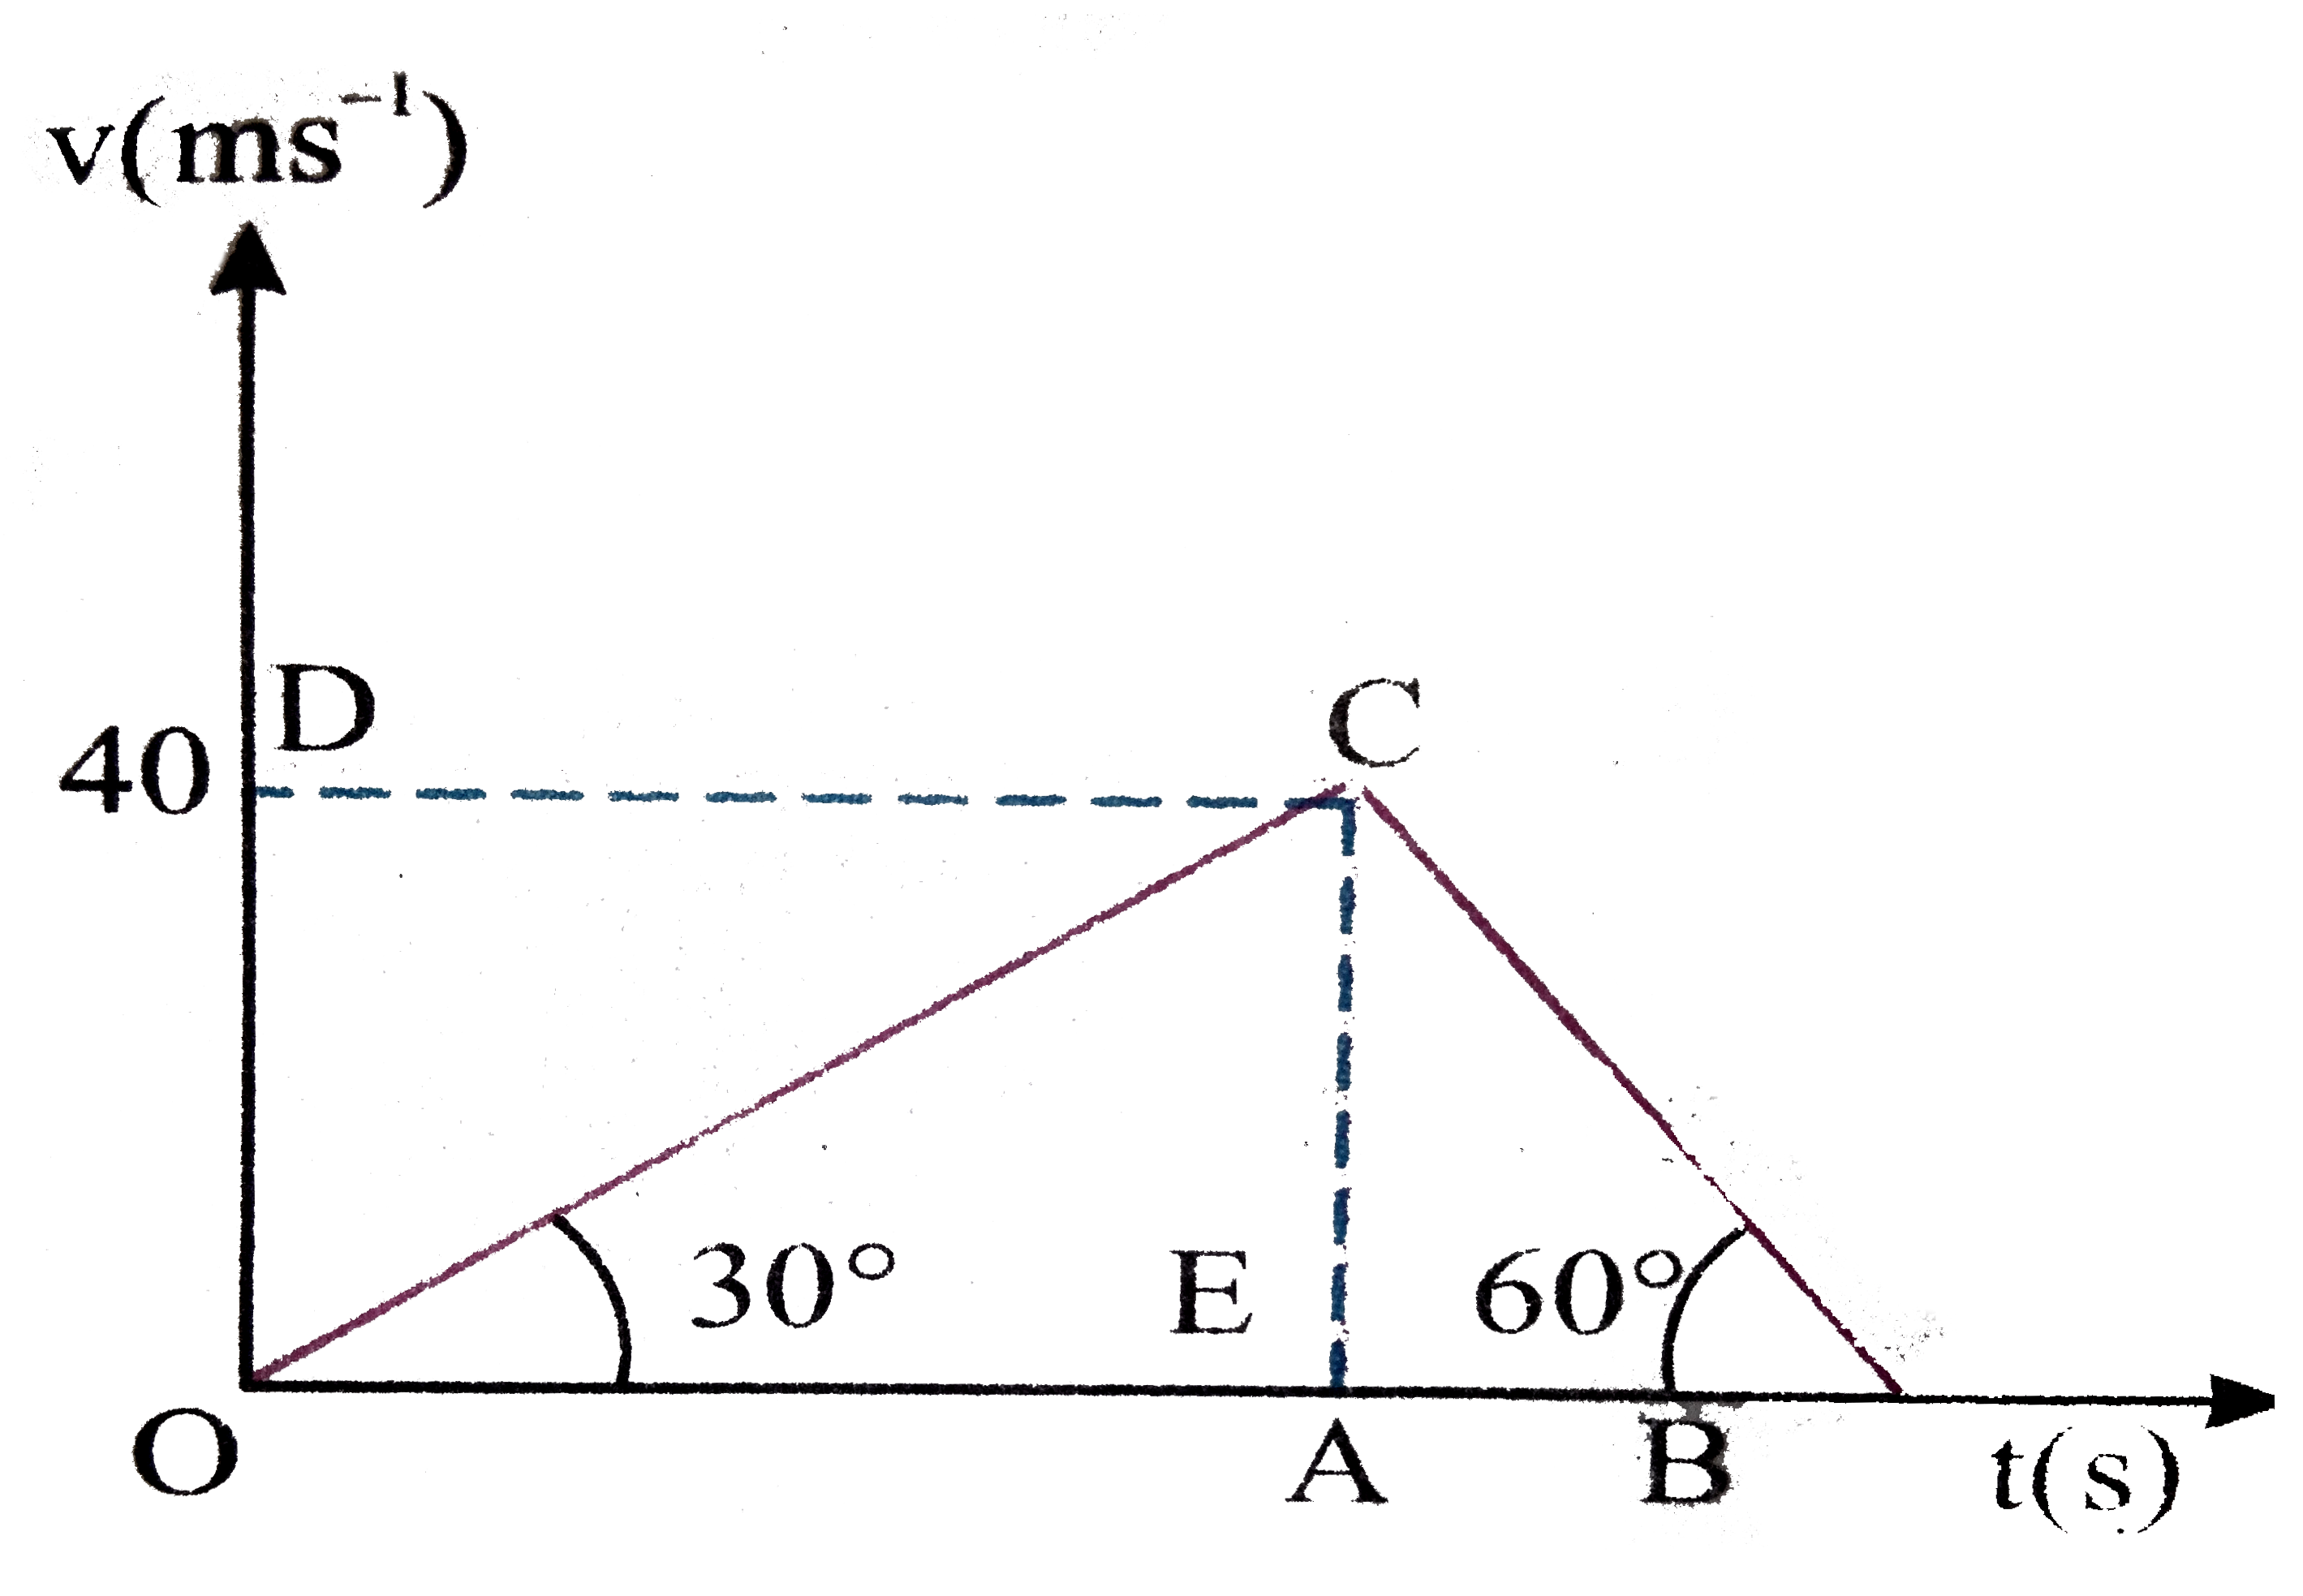
The velocity-time graph of a body is shown in figure. The ratio of magnitude of average acceleration during the intervals OA and AB is
 View Solution
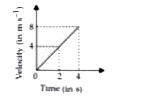
Velocity time graph of an object of mass 2kg is shown in figure. The force required to move the object for first four seconds is
 View Solution


